Newman and Kenworthy state that automobile dependence is " . . . a situation in which 'a city develops on the assumption that automobile use will predominate' " [2]. In their view, automobile dependence is not an inevitable urban condition, but can be modified if decisions change about transportation infrastructure and urban development. In addition, national and local support for multi-modal transportation has increased in the United States since passage of the 1991 Intermodal Systems Transportation and Efficiency Act (ISTEA) and its reauthorization in 1998 as the Transportation Equity Act for the 21st century (TEA-21). The primary purpose of this research paper is to assist in reducing automobile dependence in a highly-automobile dependent city by showing how to identify, monitor, and evaluate local variations in metropolitan transportation capacity of highways, transit, and non-motorized modes.
This research intends to show that average metropolitan levels of automobile dependence include a wide range of local transportation conditions in metropolitan Phoenix encompassing several cities. Transportation and census data is collected for jurisdictions in metropolitan Phoenix with 1995 population over 50,000. This data is used to calculate, analyze and compare automobile dependency within the various study jurisdictions.Central jurisdictions and their local communities have lower than average automobile dependence and higher than average population density levels, while communities at the expanding urban edge have high automobile dependence levels.
The second purpose of this study is to present an analytical approach to monitor automobile dependence that can be applied in other metropolitan areas. This approach has the potential to assist local decision making in the future including monitoring the evolution of local transportation capacity investment and identifying change toward higher or lower levels of automobile dependence.
This approach has the following steps:
· Identify population and transportation indicators of automobile dependence;
· Quantify local variations in these indicators;
· Develo multi-modal indices that reflect each mode.
This study adopted a spatial analysis approach that integrates separate digital data sets with characteristics related to automobile dependence. Population density is calculated for individual areas. Accurate measurements are made about the location and extent of physical transportation infrastructure for the same areas. Multi-modal indicators of automobile dependence are then generated and compared.
Institutional and technical difficulties are encountered that are common in sharing computerized information for integrated studies, such as this automobile dependence analysis. The set of multi-modal indicators are assembled from several databases that are created by multiple agencies for differing purposes. These databases are maintained to differing standards of updating and documentation. However, the benefits of accurate data integration, ease of calculation, and ability to conduct spatial analysis made this the preferred approach.
As could be expected in this large metropolitan area, no single agency had files that described the full set of local transportation modes. While the extent of non-motorized modes of bicycle use and walking are key indicators of automobile dependence, they are not comprehensively monitored locally. Available files documented physical infrastructure but is not always complete in desired attributes including width and number of lanes. Valley Metro, the regional transit agency, provided GIS files showing the route network and route classification for local bus services as of September 1999. Bike paths, bicycle lanes on the street network, and separate bicycle routes are obtained from the Maricopa County Department of Transportation. The City of Phoenix provided boundaries of its villages for 1999. Although the most recent available information was used these variations in the dates of local information are one limitation of this analysis. Since various jurisdictions are being compared to one another, the variation in data collection dates does not present major limitation to the analysis.
This research shows variations in metropolitan Phoenix automobile dependence for twenty local areas and covers the eight incorporated cities with 1995 populations over 50,000 persons. These cities, in order of population size, are Phoenix, Mesa, Glendale, Scottsdale, Tempe, Chandler, Peoria and Gilbert. The City of Phoenix is the largest in area (1,343 square kilometers) and population (1,155,579). Its thirteen communities are called villages, have land areas similar to local cities, and include outer suburbs with small populations (4).
Similar GIS operations are conducted to modify each regional file and identify the twenty local areas and their transportation infrastructure (Figure 2). Each theme is first summarized by jurisdiction to create a new theme showing individual cities of over 50,000 population and City of Phoenix villages. Population density is then determined as follows.
The size of each area and its population are calculated and then saved as database files for spreadsheet calculations. Each file is projected in a common geographic projection of State Plane 83, Arizona Central Zone, feet units, so that information would be spatially registered to the same coordinates for spatial comparison. Six street classes recognized by Federal Highway Administration (FHWA) were used to summarize the street theme, while the bus layer has three types of service. The total road, bus and bike kilometers and meters are then calculated by type of street, bus service, and bicycle facility. This analysis uses Environmental Systems Research Institute (Esri) geographic information systems ArcInfo and ArcView software as well as Microsoft EXCEL and Access programs.
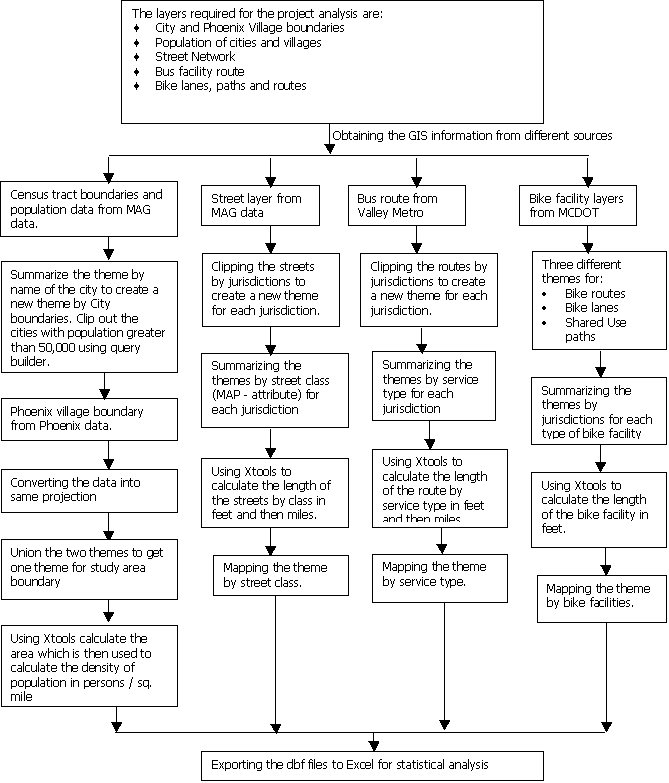
The regional pattern of local population density has an inner core of high density contained within the City of Phoenix, an intermediate zone including older City of Phoenix neighborhoods and inner suburbs, and an outer suburban zone (Table 1).The inner core has a population density range of 17.4 to 23.4 persons per hectare while the established residential district of Alhambra Village has the highest density (2,340 persons per square kilometer). These inner core densities for 1995 closely approximate the 1980 inner area density values identified by Newman and Kenworthy for automobile dependent cities and confirm the low densities found in even the most intensively settled parts of metropolitan Phoenix.
The intermediate zone of mature neighborhoods has population densities that approach the average value of 15.4 persons per hectare (1540 persons per square kilometer) identified by Newman and Kenworthy for high automobile dependence cities. These areas range in population density from of 4.8 to 14.7 persons per hectare (475 - 1464 persons per square kilometer). This zone includes six developed villages of City of Phoenix (Ahwatukee Foothills, Camelback East, Central City, Deer Valley, Paradise Valley, South Mountain) and four suburbs (Chandler, Glendale, Mesa, Tempe). The inner suburb of Tempe is surrounded by other cities and has the highest density of any local city of 14.7 persons per hectare.
| Locality | Population | Area (km) | Population Density (persons/sq km) | Category |
| Phoenix--North
Gateway
Phoenix--Desert View Peoria Scottsdale Gilbert Phoenix--Estrella Phoenix--South Mountain Phoenix--Ahwatukee Foothills Chandler Glendale Phoenix--Deer Valley Mesa Phoenix--Central City Phoenix--Paradise Valley Phoenix--Camelback East Tempe Phoenix--North Mountain Phoenix--Maryvale Phoenix--Encanto Phoenix--Alhambra |
4,793
21,034 85,049 164,328 62,576 37,762 87,538 62,281 137,675 184,134 115,757 378,314 59,884 150,360 131,191 154,033 158,583 153,070 55,212 118,114 |
115.2
176.8 516.9 504.9 188.9 108.4 184.0 93.3 184.4 240.7 149.3 447.1 55.7 111.7 94.2 105.2 91.0 85.2 27.5 50.5 |
41.6
118.9 164.5 325.4 331.3 348.4 475.6 667.2 746.5 764.9 775.2 846.2 1075.5 1345.9 1392.3 1464.7 1743.5 1796.5 2009.4 2340.4 |
Low
Low Low Low Low Low Medium Medium Medium Medium Medium Medium Medium Medium Medium Medium High High High High |
The outer suburban zone cover locations at the edge of the metropolitan area with average population densities below 3.8 persons per hectare. This standard is the minimum level of 385 persons per square kilometer (1000 persons per square mile) that defines urbanized areas in the United States Census of Population. This region includes three villages from outer City of Phoenix (Desert View, Estrella, North Gateway) where large land areas and relatively small populations result in very low densities. Three expanding suburbs (Gilbert, Peoria, Scottsdale) have larger populations within similar large and undeveloped land areas.
These results partly reflect variations caused by the differing spatial extent of the twenty different study areas. Phoenix and Mesa are the two largest cities in 1995 with populations of 1,155,579 and 378,314, respectively, while cities with the largest spatial extent include Phoenix, Scottsdale, Mesa, and Peoria. These cities, like Phoenix, contain variations in population density, but are not analyzed individually [4].
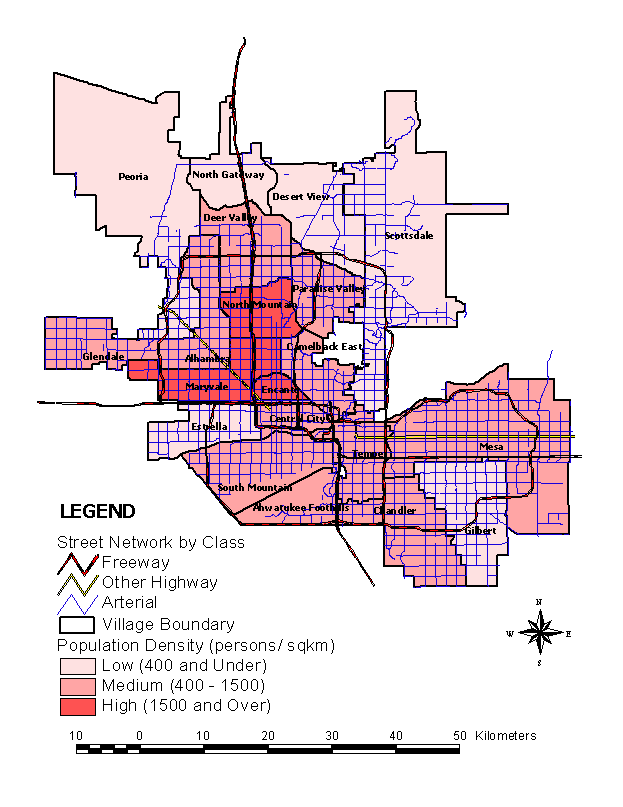
The summary of this street network by location includes six road classi fications reflecting road capacity and quality. Inner locations like the City of Tempe have extensive street networks and relatively high road densities. The City of Mesa has the highest number of local/ collector road kilometers and high total road kilometers. Several outer suburbs have large areas without a uniform street grid. Dirt and unpaved primitive roads provide access to recreational desert and mountain areas in north Phoenix, Peoria, Scottsdale, and Mesa but do not serve as urban routes.
The limited-access highway system found in major American cities is still being built here. In 1997, metropolitan Phoenix had 195 kilometers of freeway and expressway mileage, the lowest amount of the largest fifteen United States metropolitan areas [3]. Major suburbs including Scottsdale, Gilbert, Glendale, Mesa, and Chandler each had less than sixteen kilometers of Interstate highways. North-south and east-west freeways intersect in central city Phoenix. The expanded freeway system was started in 1986 and expects to complete 398 kilometers by the year 2006. Circumferential beltways now serve northwest Phoenix and Glendale and are under construction in Scottsdale, Chandler and Gilbert. Radial freeways connect central Phoenix to east Phoenix, Mesa, and the Paradise Valley village. A freeway (South Mountain Freeway) serving the southwestern portions of region is planned but not funded.
| Name of City | Interstate | Freeway or Expressway | Main Arterial | Minor Arterial | Collector Streets | Local Total | Road Length |
| Chandler
Gilbert Glendale Mesa Peoria Phoenix -Ahwatukee Foothills Phoenix �Alhambra Phoenix �Camelback Phoenix -Central City Phoenix -Deer Valley Phoenix -Desert View Phoenix �Encanto Phoenix �Estrella Phoenix �Maryvale Phoenix -North Gateway Phoenix -North Mountain Phoenix -Paradise Valley Phoenix -South Mountain Scottsdale Tempe |
3.703
0 0 0 0 12.075 16.744 0 50.232 32.844 0 0
18.515 0 14.49 0
|
48.139
0.805 8.05 12.075 27.531 0 0 4.347 13.041 0 0 0
0 0 0 0
|
212.198
228.298 303.002 447.258 146.349 49.588 83.076 113.666 86.618 154.56 79.051 43.309
112.378 130.41 185.955 337.134
|
139.426
6.762 70.196 41.86 548.688 40.411 0.161 12.075 2.898 64.239 54.418 5.313
20.447 79.534 68.264 30.107
|
425.201
567.042 1141.329 2501.618 636.111 246.652 529.207 682.801 350.819 787.934 183.218 286.741
795.662 1023.638 520.996 1592.29
|
15.295
0 1.288 0 63.595 41.055 86.135 0 3.22 125.58 0.966 0
4.025 141.68 309.12 35.903
|
843.962
802.907 1523.865 3002.811 1422.274 389.781 715.323 812.889 506.828 1165.157 317.653 335.363
951.027 1375.262 1098.825 1995.434
|
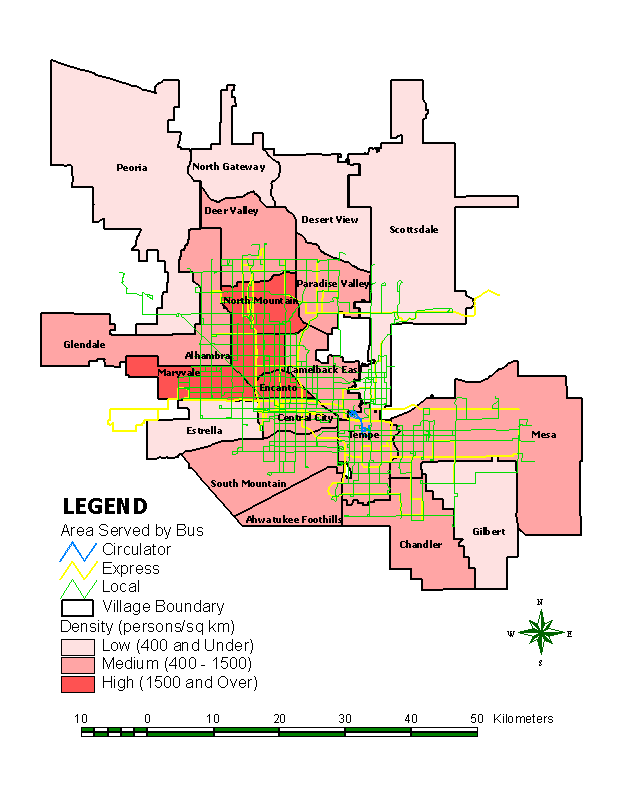
Local transit consists of buses that use this street network to provide scheduled service (Figure 3). Express route service provides extensive connections between Tempe and employment centers in the central business district of Phoenix. Express route service is available in almost all study areas except the City of Peoria. Only Tempe and Central City Phoenix have circulator bus services near major employment centers. When measured by total bus service kilometers, bus service is least available in outer areas of the City of Phoenix (Ahwatukee Foothills and Estrella) and Gilbert.
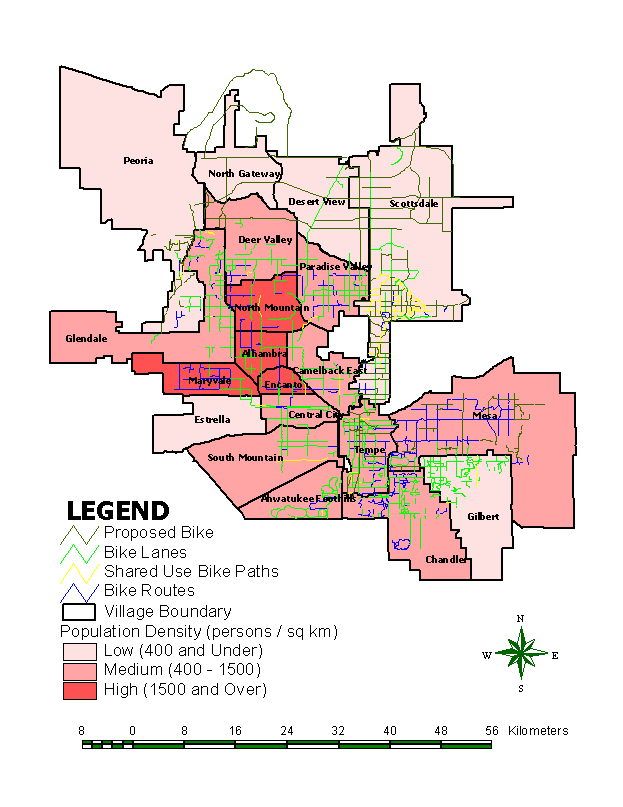
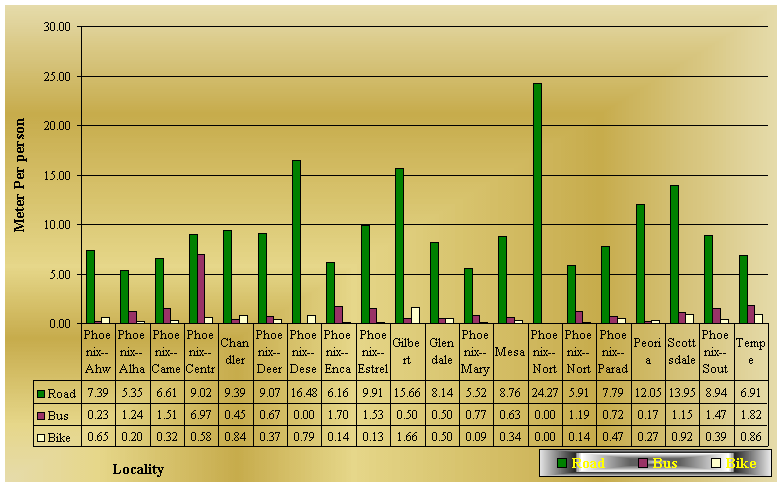
In an effort to document non-motorized traffic, bicycle facilities were inventoried. Existing bike facilities were limited, but existed in each jurisdiction, and included recreational shared use, bike routes on existing streets, and separate bike lanes (Figure 4). Phoenix had the highest number of bicycle facility (524 kilometers) followed by Scottsdale (152 kilometers) and Tempe (134 kilometers). Scottsdale and Phoenix had shared use facilities in the form of multi-purpose paths for bike riders, in line skating, and pedestrians along Indian Bend Wash. This flash-flood corridor is dedicated to water retention and recreational land uses.
Facilities for other modes are clearly limited. Large cities (Phoenix, Scottsdale, Tempe) have the most bus route service per person, while outer Peoria has the lowest level. This finding confirms that the regional bus system connects outlying residential areas with central employment. Moreover, the bicycle is viewed as a recreational mode of travel in this area where air conditioned vehicles are the norm. The highest per capita bicycle facilities were in the residential suburb of Gilbert with 1.66 meters per person. No other city has an average of even one meter per person in bicycle route facilities.
The third indicator accounts for variations in transportation route length and population within each study area. First, measuring automobile dependence by combined route length shows that both inner city locations (Encanto Village) and outer suburbs (Peoria, Scottsdale) have high levels of transportation capacity based on their mix of transportation modes. By way of contrast, Camelback East has the lowest route capacity and is a densely settled area of high employment in the City of Phoenix. Second, when total route length is compared to area, the density of multi-modal transportation capacity emerges. The inner area of Central City emerges as the best served portion of metropolitan Phoenix with the density of 17.93 kilometers per square kilometer. The lowest route density for a city occurred in North Gateway with 1.02 kilometers per square kilometer. Outer suburbs (Chandler, Gilbert, Glendale, Peoria, Camelback East, Deer Valley, Desert View, Estrella, and South Mountain) have low total route densities below 8.02 kilometers per square kilometer.
|
|
|
|
|
| Chandler
Gilbert Glendale Mesa Peoria Phoenix--Ahwatukee Foothills Phoenix--Alhambra Phoenix--Camelback East Phoenix--Central City Phoenix--Deer Valley Phoenix--Desert View Phoenix--Encanto Phoenix--Estrella Phoenix--Maryvale Phoenix--North Gateway Phoenix--North Mountain Phoenix--Paradise Valley Phoenix--South Mountain Scottsdale Tempe |
1479.52
1122.06 1691.97 3705.07 1068.55 518.37 805.94 1114.08 998.11 1178.41 365.47 444.58 439.84 982.41 116.98 1153.93 1359.62 950.90 2649.06 1485.96 |
8.02
5.94 7.03 8.29 2.07 5.55 15.97 11.82 17.93 7.89 2.07 16.18 4.06 11.53 1.02 12.69 12.17 5.17 5.25 14.13 |
1.98
3.39 2.21 4.38 6.49 0.78 0.34 0.80 0.93 1.52 3.07 0.22 1.26 0.55 2.81 0.66 1.01 2.00 8.14 1.01 |
Third, the relationshi of total transportation route length to population in the same area shows where transportation capacity is in place in advance of built-up development (Table 3). Developing areas at the metropolitan edge has similar conditions of extensive land areas, concentrated populations, and limited transportation capacity and included Scottsdale, Peoria, and the Desert View village. Scottsdale has the highest multi-modal capacity of 8.14 kilometers per person, while the settled Encanto village has the lowest multi-modal transportation capacity of 0.22 kilometers per person.
This study also demonstrates three measures of automobile dependence that can be applied in other cities beyond the benchmark of road length per person. Geographic information systems provided a valuable technical tool to inventory, measure, and analyze transportation facilities. Cities where computerized spatial databases and detailed route classifications are not available can still conduct similar local studies by manual calculation. Even in metropolitan Phoenix, regional data sets had to be assembled from separate agencies and integrated.
Finally, it is note that each of the measures used provides a benchmark that identifies local areas that are below or above regional averages or another desired transportation capacity level. This method offers methods to analyze the amount of transportation infrastructure supplied by each mode. Indices of transportation supply provide measurable standards for local comparisons and recommendations for improvements in present capacity. The expanding regional freeway system offers one example. Present construction aims to bring metropolitan Phoenix toward the average number of freeway kilometers for other United States areas of its size, but variations in freeway provision will still exist in local areas.
As this method researched transportation capacity in metropolitan Phoenix, future refinements here and in other cities can include calculations of road network length weighted by the number of lanes or the number of people served. This refinement will research transportation demand versus capacity. Evaluation of the expansion of the regional freeway system compared to expansion in other modes is another refinement. The current research approach could provide interesting variations in the multi-modal indices for cities less dependent on a surface road network than metropolitan Phoenix.
2. Newman, P. W. G. and J. R. Kenworthy. Sustainability and Cities: Overcoming Automobile Dependence. Washington, D.C., USA: Island Press. 1999.
3. Federal Highway Administration, Office of Highway Policy Information. Selected Characteristics - 1995 by Urbanized Area. Highway Statistics 1995. Retrieved on May 30, 2000 from the World Wide Web: http://www.fhwa.dot.gov/ohim/1995/hm72.
4. Maricopa Association of Governments. Urban Atlas: Phoenix Metropolitan Area. Phoenix, Arizona, USA: Maricopa Association of Governments. 1998.
5. Newman, P. W. G. and J. R. Kenworthy. The Costs of Automobile Dependence: A Global Survey of Cities. Paper preprint, Annual Meeting of the Transportation Research Board. Washington, D.C., USA. 1998.
Prepared for Publication and Presentation at the
Twenty-First Annual Esri International
User Conference
July 9-13, 2001
San Diego, California