The Huntington Breast Cancer Action Coalition (HBCAC) recently completed a survey of town residents regarding breast cancer. This paper reports on recent efforts to map those surveys using ArcView GIS. Breast cancer cases will be overlayed onto various environmental maps, such as local toxic sites, to look for general patterns among these variables. Basic statistical analyses will also be summarized.
Breast cancer now accounts for almost one out of every three cancer diagnoses among women. It is the most common form of cancer for women, excluding non-melanoma skin cancers. Breast cancer is also the leading cause of death for women between the ages of 35 and 54 (1). While many cancer rates have fallen in recent years, breast cancer rates continue to climb (2). Huntington Breast Cancer Action Coalition (HBCAC) was formed in 1993 to educate the residents of Huntington, New York about their breast health . A similar coalition on Long Island, in neighboring West Islip, had formed in 1992, and two years later had developed a "'first of its kind' door-to-door demographic mapping survey (3). Similarly, HBCAC decided to launch a more detailed and comprehensive survey of Huntington women over the age of 25. Following from West Islip's experiences, HBCAC knew from the outset that they wanted to map their survey. Maps were proving to be powerful tools for raising public awareness about the prevalence of breast cancer on Long Island. The Long Island Breast Cancer Maps are powerful examples of community mapping.
Community mapping projects have become an important tool for informing and empowering local citizens. As the Common Ground Community Mapping Project has stated, "Through the process of creating and revising maps, communities are better equipped to proactively address their interests and concerns" (4). Community maps can touch upon a wide range of spatial attributes associated with community life. Through maps, community groups can address environmental, health, economic development, social welfare, historic preservation, land use, demographics, natural hazards and a host of other issues. Using GIS overlays, community mapping projects can be an effective tool for looking at the linkages among different sets of issues. For example, we can use GIS to look at the way breast cancer patterns correlate with demographic or environmental factors. Many of these land features have traditionally been mapped by local planners, academics, or private corporations. If that is true, then what makes community mapping innovative?
First, community maps raise community participation rates by engaging a broad cross-section of the community in mapping projects, most of whom have little or no prior background in mapping. In Huntington, HBCAC had no internal mapping resources. HBCAC knew, however, that they wanted to map breast cancer, and they sought out volunteers and paid interns who could help make that goal a reality.
Second, community maps are important educational tools. Maps allow many residents to better understand local issues in a more concrete fashion. Although the residents of Huntington knew breast cancer was an important issue, the maps helped the community to understand the widespread prevalence of this disease.
Third, community maps are a valuable tool for critical thinking. They are not simply learning about their communities by reading maps; they are also asking questions of the maps and manipulating the maps to provide those answers. Through that process, citizens begin to see their community in a new light. Through its maps and other campaigns, HBCAC wants local residents to question whether pest-free lawns are worth the risks of potentially higher breast cancer rates, or if residents really should ignore the broad-based usage of toxic substances in their community.
Fourth, community mapping projects are distinctive because local citizens, often working through non-profit organizations, control the mapping process. They control what is to be mapped, how maps are to be distributed, and how they are going to be publicized. This shift can lead to mapping innovations, like breast cancer maps. Citizens often bring new perspectives to mapping, highlighting previously ignored issues and helping to change local public agendas. Maps can strongly influence community perceptions. In Huntington, HBCAC knew they wanted to use maps to explore the relationship between environmental contamination and breast cancer. They wanted to use their maps to heighten public awareness of the usage of toxic substances in Huntington and to explore whether those substances were affecting local breast cancer rates.
Local control of the mapping process is particularly important because many community mapping projects focus on politically sensitive issues. For that and other reasons, relying upon government agencies for these maps can often lead to frustration. Despite that tension, much of the information that community mapping projects draw upon come from governmental data sources and often require the cooperation of government officials.
Breast cancer maps provide a good illustration of these tensions. Debates about privacy and data confidentiality have been a frequent source of conflict between government officials and grassroots breast cancer organizations. From the perspective of government, releasing detailed data about breast cancer (or any cancers) can be an invasion of privacy. People's lives can be seriously disrupted by the public release of data describing their health histories. There's a fear that local citizens will be stigmatized or that individuals may lose their jobs. From the perspective of community health advocates it is essential that the public understand the extent of disease within their community. Detailed community maps provide a powerful visual tool for exposing the ubiquity of breast cancer on Long Island.
Fifth, community mapping projects can reveal in powerful ways how much the community's goals differ from their government's goals. Community mapping efforts often begin in a fairly naive way with local citizens believing that by creating maps and mixing new and old sources of data in compelling ways they can open a space in public discourse for considering new alternatives. What community groups frequently learn is that the pace of change in government is often much slower than they anticipated or that key elements of their government are hostile to their plans. Today, a wide chasm has opened up in the environmental health field. On the one side are government officials and academics, who feel that mapping exercises should continue to focus on research. These individuals argue that we do not understand the causes of breast cancer, but improved research, particularly genetic research, and to a much lesser extent mapping research, should proceed and hopefully begin providing the answers we seek.
On the other side are the environmental health advocates and some environmental scientists. They believe cancers, like breast cancer, are a direct product of industrial era chemicals. In particular, much attention is now focusing upon groups of chemicals that affect the body's hormonal system. In Our Stolen Future, Dr. Theo Colburn and others argue that synthetic chemicals mimic natural hormones and trigger hormone-related cancers, like breast cancer (5).
Therefore in the area of breast cancer, maps have become deeply politicized. At one level community-based breast cancer maps are about raising public education and awareness. But, at another level, these maps are about changing our understanding of environmental health. In her path breaking book, Silent Spring, Rachel Carson begins by noting how intimately we live with modern chemicals - how we eat, drink, and breathe pesticides into our bodies without pausing to consider the devastation that these chemicals cause. Dr. Sandra Steingrabber, author of Living Downstream, also emphasized these issues of intimacy. For example, she discussed how mothers pass along PCBs and other chemicals to their newborn children through their breast milk (6).
While community-based maps do not create a two dimensional portrait of these intimate health relationships, they do paint a powerful picture of communities suffering silently, block after block, through devastating illness. Breast cancer maps are a powerful tool for breaking that silence and forcing the public to confront its secrets.
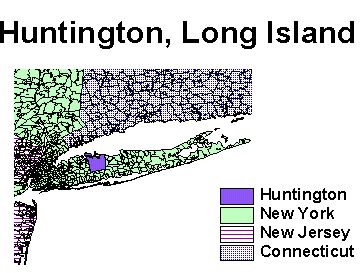
In the early 1990's the Town of Huntington had a population of 200,000 (90% white). HBCAC decided to survey the entire town with the goal of mapping and studying breast cancer and reaching a 50% response rate. The survey was written by Roger Grimson, PhD, biostatistian at the Department of Preventive Medicine at the University Medical Center at Stony Brook, along with physicians at Huntington Hospital and local breast health activists. The survey was mailed out to over 68,000 households in September 1993, all known households in the town. The survey was sponsored by Huntington Hospital and supported by Huntington Town officials and community volunteers. The survey was written in both English and Spanish and publicized in community newspapers, radio and television stations, local Parent Teacher Associations (PTAs), and through other civic and religious groups. In response, over 15,500 surveys were filled out and returned.
In June 1994, the Junior League of Long Island and Suffolk County Health Partnership sponsored a second mailing, targeting non-respondent households. HBCAC collected another 9,000 surveys.
HBCAC volunteers entered the surveys into a computer. Each survey was reviewed, assigned a record number, and supplied with a 9-digit zip code if not provided (Nine-digit zip code was obtained manually from US Postal Zip Code books). The surveys were batched in groups of 25. It took 1 to 1� hours to enter a batch into the computer database. The initial data entry program was written in 1993 by volunteers in DOS and later revised for Windows.
A Town Hall Meeting was held on the evening of March 25, 1995, where HBCAC presented preliminary statistics for the 18,955 Breast Health Surveys they had tabulated. Greenman-Pedersen Inc. geocoded and mapped the survey data. Of the respondents, 5,421 indicated that someone in their family had breast cancer (29%); 939 respondents indicated they themselves had breast cancer at some time (5%).
In July 1996 HBCAC completed a third mailing, bringing in another 5,000 surveys. Also, HBCAC utilized the Huntington Hospital, Town Hall, local libraries, doctor offices, and beauty parlors to distribute and collect additional surveys. Lastly, volunteers visited specific addresses to urge non-responders to fill out the survey in a "Neighbor-to-Neighbor Campaign." As a result, another 1,300 surveys were collected, bringing the gross total number of surveys up to 30,800.
Errors did occur in the data entry process. Upgrading the data from DOS to Windows proved particularly problematic. The date-of-birth field was lost on thousands of surveys and had to be re-entered. Again, volunteers spent countless hours making the necessary corrections.
The database was also checked for duplicates, which were removed. A more careful verification of the survey was initiated by epidemiologist Erin O'Leary, PhD, and initially consisted of a random selection of 10% of the records, which were compared to the original hard copy of the surveys. When these analyses were complete, 23,777 surveys were deemed acceptable for analysis. The difference between the gross and final count was primarily due to duplicate surveys. In the fall of 2000, after seven years of work, the survey was completed.
In the Spring of 1999, HBCAC, with assistance from Long Island University, was awarded a Conservation Technology Support Grant (CTSP), which provided the organization with sufficient resources to do its own breast cancer mapping. Again with the assistance of Greenman-Pedersen, Inc. the final surveys were geocoded with data provided by Geographic Data Technology (GDT), Inc. In January, 2001, HBCAC presented their preliminary findings from the completed survey.
HBCAC asked Dr. Erin O'Leary to analyze the completed survey. Below are some highlights from her findings (8):
| Total number of Respondents | 23,777 |
| Number of women in Huntington, over age 25 | 63,665 |
| Response Rate | 37% |
| Number of women diagnosed with breast cancer, over age 25 | 1,218 |
| Breast Cancer Prevalence Rate | 5.1% |
| Average age of respondents | 51 years |
| Average age of women ever diagnosed with breast cancer | 61 years |
| Average years in residence | 17 years |
| Average years in residence of women over 25 with breast cancer | 23 years |
| Average age at breast cancer diagnosis | 53 years |
Breast cancer mapping in Huntington is still in an early phase of development. The mapping process is envisioned as a three stage process. The first stage is now complete. Cancer cases have been geocoded and mapped using Esri's ArcView software. The zip+4 geocoded centroids provided by GDT enabled HBCAC to successfully geocode over 99% of the survey. Greenman Pedersen, Inc. printed these maps on a large format printer. The maps are now on display in local libraries.
The second stage of the analysis is to examine the data for possible cancer clusters. This analysis will begin this summer and will hopefully be completed by the end of the year. HBCAC has been working with two software packages: Dr. Martin Kulldorff's Satscan Software and Dr. Gerry Rushton's spatial filtering software.
The third phase of the research is to correlate breast cancer patterns with known environmental hazards in the region. HBCAC has been collecting environmental data sets and done some very preliminary analysis with those datasets.
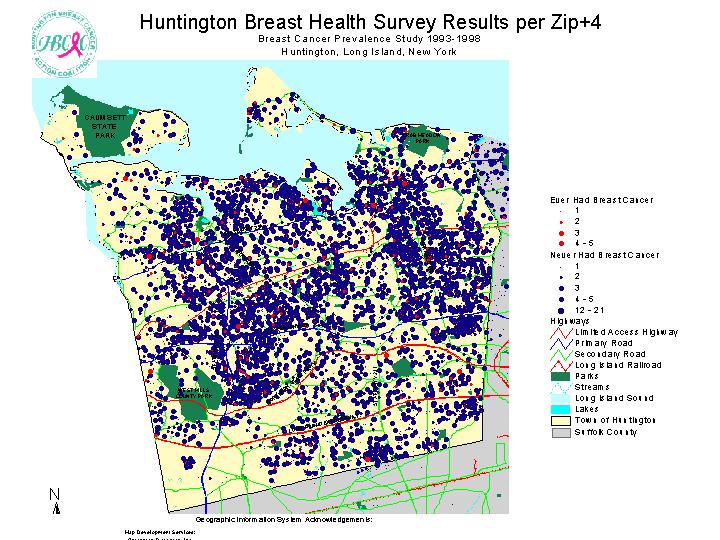
Huntington is located in Suffolk County, New York. Breast cancer cases were mapped in two ways.
First, we overlayed respondents who ever had breast cancer onto respondents who never had breast cancer. Of the 23,777 respondents, 5% had breast cancer in their life. Second, we mapped the percent of respondents who ever had breast cancer at each zip+4. Many of these percentages were 100%, reflecting the fact that the only respondent from that zip+4 had been diagnosed with breast cancer. Those zip+4 with no breast cancer cases (0%) were not mapped, to focus upon positive cases.

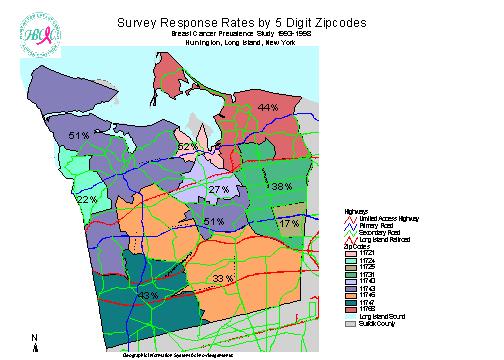
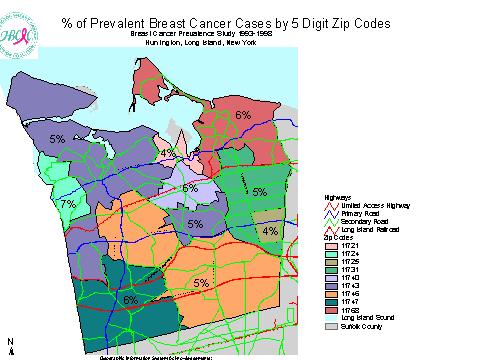
Response rates (Number of respondents/female population over 25) and prevalence rates (have breast cancer/total respondents) were mapped by zip code to provide some basic statistics about the distribution of cases. Response rates were high in Huntington (11743) at 51% and Centerport (11721) at 52%, exceeding the 50% response goal original set by HBCAC. These were the only two zip codes to meet the original goal. Response rates were surprisingly low in Commack (11725) at 17%, Cold Spring Harbor (11724) at 22%, and Greenlawn (11740) at 27%. Prevalence rates were highest in Cold Spring Harbor at 7%, but this may simply be a product of the low response rate in that community.
These maps are descriptive and not analytical, nevertheless they are a powerful tool for raising breast cancer awareness. These maps were first showcased at a community forum in January 2001. The maps will continue to be displayed at local libraries throughout the year. So far, the public's response to these exhibits has been very strong. Local residents are able to carefully examine the maps and reflect upon the information they convey. Many residents find the maps to be shocking, the maps starkly illustrate the prevalence of this disease within their community.
Partially in response to the grassroots breast cancer mapping efforts on Long Island, New York State released cancer maps for the state. In 1999, they released county level breast cancer maps. Local breast cancer organizations complained that those maps were hardly sufficient for their needs. In response, zip code level maps were released in 2000. Local organizations were also disappointed with these maps. In both cases the maps lacked sufficient detail to identify specific cancer clusters. State officials countered that they could not provide more detailed mapping information without compromising patients' confidentiality. Yet the averaging and smoothing techniques that these maps utilize mutes the appearance of problems. The choropleth shading techniques used by the state dull the sense of crisis felt by grassroots health advocates. On the state's maps there are a few areas where rates are significantly higher than "expected," but most communities on Long Island are not significantly above the "expected" rates. Yet how does the state calculate these expected rates? They are not based on national or international standards, but rather they are calculated against state-wide averages. Yet, New York State has among the highest rates of breast cancer in the country. It is precisely these slights of hand that upset local health advocates.
The dot density maps used by HBCAC present a very different picture of breast health in Hungtington. Breast cancer rates in most of Huntington's communities are within 15% of the expected rates, according to the state's maps (9). But HBCAC's dot density maps provide a vivid picture that a serious problem exists, a problem that did not exist 40 or 50 years ago. Again, community maps allow us to look at problems from perspectives that government agencies (and private corporations) are reluctant or unable to share.
In recent years much attention and controversy has emerged around the issue of cancer clusters. Scientific experts are reluctant to label neighborhoods with high incidence of disease a "cluster," when they don't understand the causes of these high rates. Lacking a well-established disease agent, many clusters do not meet standard statistical thresholds for being significantly different from background cancer rates. Cancers are never going to be uniformly distributed across a geographic region. Some clustering is inevitable and can be explained away as due purely to chance. Like marbles dropped from a bag, some cancers "land" closer to other cases. Local residents generally do not like these explanations because many communities live near potentially hazardous land uses. Many residents feel that such explanations are too dismissive of their health fears.
HBCAC, therefore, found itself in a unique position. HBCAC wanted to work with the same tools that scientists were using to investigate their datasets. By undertaking their own analyses, HBCAC did not have to depend upon government agencies for this research and did not need to worry that results were not being honestly provided back to the community. But, HBCAC also learned it had a responsibility to understand and to utilize scientific methodologies if they wanted others to take their results seriously.
Of the 1,250 cases of breast cancer in HBCAC's database (this total includes some cases outside of Huntington), about half had lived in their current homes for fifteen or more years prior to their breast cancer diagnosis. If the residency is reduced to ten years, then the total number of cases rises by 153 to 784 cases. Either way, a significant number of the known breast cancer cases in the dataset cannot be used for cluster analysis because of the need to account for a minimum of 10 years of residency to relate environmental contaminants to spatial patterns of breast cancer. Even this is inadequate, because household exposure may not be the most relevant pathway for understanding these spatial distributions. Nevertheless, this is the best that we can do with the existing survey data.
The cluster research will also try to account for the fact that cancer cases in the town were diagnosed in very different time periods. Therefore, it may be useful to control for the timing of diagnosis in looking for cancer clusters in the community.
HBCAC, like many other breast health coalitions, have focused a lot of their resources on trying to reduce the public's exposure to hazardous chemicals. For example, HBCAC distributes "I am fed naturally" signs for local lawns to encourage home owners to not use potentially harmful pesticides on their lawns. One of the major goals of this aspect of the mapping project is to raise public awareness about the widespread usage of chemicals in the Huntington community and to help reduce the public's exposure to harmful chemicals.
A major part of HBCAC's mapping project is to identify toxic sites in Huntington and to map those sites in relation to the breast cancer survey data. HBCAC has been collecting data on a wide range of land uses and toxic emitters for its GIS project. HBCAC now has GIS coverages for: dry cleaning establishments, gas stations, landfills and dumps, golf courses, land use in 1980, land use in 1994, toxic release inventory sites, current and archived U.S. E.P.A. Superfund sites. HBCAC would also like to map the region's water supply distribution system and continues to work with local water supply providers to gain that information.
One major issue that health organizations are just beginning to confront is that industrial sources of contamination, while significant, may not explain the widespread distribution of cancers, like breast cancer. Lifestyle factors may also play a large role. These lifestyle factors probably stem from multiple sources and could include low levels of contaminants in drinking and bathing water, dairy and meat products, pesticides, health care products, medical radiation, plastics, fossil fuel combustion, etc. While the research is still unclear on exactly which of these products is causing breast cancer, researchers have begun focusing on man-made chemicals that mimic bodily hormones like estrogen to explain rising breast cancer rates. Many of the above substances have these properties.
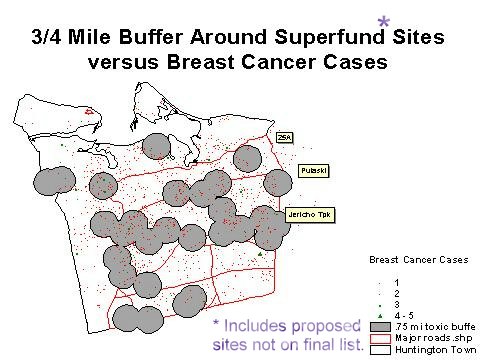
While HBCAC does not have survey data to understand these subtle lifestyle effects for individuals, we can begin to look at the more concentrated industrial pollution sites. As part of HBCAC's public presentation last January, we examined sites listed on EPA's superfund list, which includes both current superfund sites and sites that were removed from further consideration for Superfund status. Most of the sites on this list in Huntington are not superfund sites but nevertheless, given that EPA was investigating these sites they may have had pollution violations or other problems in the past. We examined how breast cancer cases varied for women who lived close to one of these sites as compared to women who lived further away from these sites. We found that women who lived closer to these sites did not have a higher risk of getting breast cancer. We intend to do additional environmental analyses on this data in the future.
When I first began working with HBCAC on its survey, it wasn't clear to me where this project would go. I was skeptical that a grassroots mapping project could succeed where so many scientists had failed. How could HBCAC help to define the causes of breast cancer or identify new cancer clusters? But HBCAC's mapping project is much broader in focus than these goals.
HBCAC's map were recently center stage at a Congressional hearing held in Garden City, Long Island. Senators Clinton (NY), Reid (NV), and Chafee (RI), and the Long Island legislative delegation asked a selected panel scientists and health advocates to discuss "Environmental Contamination and Chronic Diseases. (10)" HBCAC's President, Karen Miller, was one of those panelists, and three of HBCAC's maps were placed on the stage alongside the elected officials. The maps were filmed by a variety of news outlets covering the event. At that event, Karen Miller asked the elected officials to look at the maps and to understand that each survey respondent, whether they had breast cancer or not, represented a woman who wants better answers and is confident that detailed maps, like HBCAC's, can be developed without compromising her privacy.
The mapping project has already influenced the government's view on health maps. Pressure on New York State from organizations like HBCAC played a role in pushing the state to develop cancer maps for the state and contributed to the state's decision to release zip code level maps. But New York State must do more. While the government should continue to protect patients' privacy, its also true that GIS tools can be used with greater spatial detail without compromising that privacy. HBCAC's maps are a powerful reminder of how much momentum exists at the grassroots level for stronger governmental responses to this issue.
While we are just beginning the process of understanding the analytical value of mapping breast cancer in Huntington, the maps have had a powerful effect on local awareness of breast cancer. Hopefully more women and government officials will pay closer attention to breast health issues. But hopefully, by mapping cancer and mapping local sources of contamination, the maps can also play a role in reducing the toxic burden on our bodies.
In conclusion, community mapping efforts offer communities a powerful tool for thinking about localities. Maps do indeed influence public perceptions about place and GIS tools give community organizations greater control over influencing those perceptions of place. Taking control of breast cancer mapping in Huntington has freed the community to ask questions about their community that government officials frequently ignore. The process has also empowered HBCAC to demand more of government. To reluctant officials, HBCAC members have frequently said, "If we can create these maps, then so can you." Specific policy changes have also been made. For example, New York State passed a neighbor notification law for pesticide spraying, which breast cancer groups actively supported. Many more changes, however, still need to be made.
The Common Ground Community Mapping Project believes that "community mapping is a way for local citizens to reinhabit their home place. (11)" This is precisely the message that HBCAC is trying to create through its maps. For HBCAC, GIS is an important tool for making communities healthier places to inhabit.
(1) Breast Cancer Action, "The Facts and Nothing But the Facts," http://www.bcaction.org/Pages/GetInformed/Facts.html
(2) Associated Press, "Report: Cancer Rates on Decline," Newsday 6/6/01:A23
(3) West Islip Breast Cancer Coalition, "Mission/History," http://www.wibcc.org/mission.htm
(4) Common Ground Community Mapping Project, "Why Mapping," http://www3.telus.net/cground/mapping.html
(5) Colborn, Theo, Dianne Dumanoski, and John Peterson Myers, 1997. Our Stolen Future. NY: Plume Books.
(6) Carson, Rachel, 1962. Silent Spring. NY: Fawcett Crest; Steingraber, Sandra, 1997. Living Downstream: An Ecologist Looks at Cancer and the Environment. MA: Addison Wesley
(7) The survey summary is based upon the work of Mimi Galgano, HBCAC's survey director and author of "Huntington Activists Conduct Large Community Breast Health Survey."
(8) Huntington Breast Cancer Action Coalition, "Breast Cancer Prevalence Study, 1993-1998: Synopsis of Results," http://www.hbcac.org
(9) New York State Cancer Surveillance Improvement Initiative (CSII). http://www.health.state.ny.us/nysdoh/cancer/csii/nyscsii.htm
(10) Statements from Hearings, 107th Congress, First Session. "Environmental Contamination and Chronic Diseases," June 11, 2001. http://www.senate.gov/~epw/stm1_107.htm#06-11-01
(11) Common Ground Community Mapping Project, "What is Community Mapping" http://www3.telus.net/cground/aboutus.html