Abstract
This research uses GIS to examine risk-taking and system hazard associated
with maritime commercial passenger ship casualties (1950-1998). Complicating
the analysis of these rare events (n=532) is their wide geographic distribution.
To account for important regional factors affecting maritime transportation,
the water surface was divided into ten regions-Southeast Asia, Northern Europe,
Southern Europe, the Caribbean, the Middle East, Asia, Eastern Africa, Northern
Pacific, Northeastern United States and other-which serves to limit spatial
analysis. This paper demonstrates that it is possible to resolve this issue
by incorporating GIS-based spatial analysis with traditional analytic techniques.
Introduction
Heretofore, shipping disasters were commonly attributed to limited technology;
"(n)avigational systems and fire protection were relatively primitive,
combustion engines were prone to problems, and ship hulls were not compartmentalized"
(Mueller and Adler, 1991:102). As revolutionary advances in ship design, navigation,
and shipping standards occurred, unfaltering casualty rates lead to a new accident
paradigm. Accident investigators and researchers alike attributed most maritime
casualties to human error; formal inquiries consistently found that about 80
percent of events investigated were caused by human error on the part of shipboard
operators (Lloyd's List, 1994; Taska, 1990; Millar, 1980:9; Gardenier, 1981;
and Benkert 1978). Commercial passenger ship casualties are no exception.
Recently, critics have begun to assemble evidence that suggests the accident
investigation process may be somewhat biased (Taska, 1990). Presumptions on
behalf of the investigators lead them to focus on the shipboard operations immediately
preceding the event. Focusing exclusively on shipboard operations inevitably
leads investigators to overlook, and even neglect, the role played by shore-based
management that sets the conditions onboard the vessel (Tasca, 1990; Peterson,
1980).
Those criticizing the "operator error" explanation argue that it is
important to take into account the context within which the master and crew
maneuver, in particular, the decisions made by corporate executives (Wagenaar,
1992; Tasca, 1990; Maritime Transportation Research Board, 1976). "Unrealistic
sailing schedules, staffing deficiencies, and inadequate equipment maintenance
are all executive, profit-driven decisions that directly affect the operating
conditions of the vessel" (Bichler-Robertson, 2001:8). Corporations that
choose to maximize profit at the expense of safety, knowingly put the lives
of passengers and crew in danger; as such, these calculated decisions-corporate
risk-taking-constitute corporate negligence thereby rendering the corporation
criminally culpable for the casualty. (For a more detailed explanation of legal
arguments about corporate negligence within a maritime transportation context
please see Bichler-Robertson, 2000:25-41.)
A second plausible explanation for maritime casualties is system hazard (Perrow, 1984; Bichler-Robertson, 2000). Accidents occur within a transportation system that is affected by: the management practices of other vessel owners; procedures, practices and enforcement capacity of various maritime regulatory agencies, Port Authorities and Protection and Indemnity Clubs; international relationships and economic conditions; and, local political/economic factors (Bichler-Robertson, 2000). Added to this mix are weather conditions, hydrological features, tidal patterns, and traffic volumes that interact with the above mentioned system components to generate hazards that impact differentially on each vessel (Perrow, 1984; Bichler-Robertson, 2000).
Methodological Issues
Examining the influence of corporate risk-taking and system hazard on maritime
passenger ship casualties is a formidable task in terms of sample generation,
data analysis, and variable construction. Issues of sample generation affect
the construction of variables and limit analytic strategies.
Sample Generation and Data Analysis
Foremost among methodological issues is that casualties are relatively rare
events. According to Lloyd's Register of Shipping, less than one percent
of world's merchant passenger fleet (vessels over 1,000 gross tons) is lost
each year (US Bureau of the Census, 1978-1997). This amounts to a handful of
annual casualties: to demonstrate the rarity of events, there were no total
constructive losses of passenger vessels over 500 gross tons worldwide in 1985
and 1990, and only one for each year in 1992 and 1993. While accurate figures
are unlikely, given the disjointed nature of recording practices, it is clear
that serious passenger ship casualties are rare. Conducting a standard density,
proximity or traditional statistical analysis, on a handful of events, will
fail to provide any useful or credible conclusions. This necessitates a lengthy
study period over a wide geographic area to capture a body of events with sufficient
diversity and volume to warrant reasonable confidence in the study conclusions;
however, using an extended study period raises complications for variable construction.
Variable Construction
Information required to examine the decision-making of shore-based management
and system hazard over an extended period of time, does not exist in any available
database. Complicating the reliability of information pertaining to risk-taking
is that corporations are unlikely to make incriminating information readily
available; therefore, information about risk-taking must be drawn from publicly
available sources.
In addition, cruise vessels and long range ferries travel through multiple regions, each with differing levels of system hazard. Information about all of the factors associated with system hazard is not consistently available for all regions throughout a lengthy study period. For example, research on casualties occurring in Southeast Asia must account for the creation of Bangladesh, the split of Korea, and political changes in Vietnam. These challenges required the use of proxy measures or restricting the study to a single region in order to account for major events that alter necessary data. This kind of research is most easily conducted in regions consisting predominantly of first world nations with consistent data generating agencies and stable economies. Given the importance of the maritime commercial passenger trade to other nations, in particular, developing maritime nations, restricting events to a single region would hamper the utility of research conclusions.
A narrow geographic focus would also contribute to right hand spatial censoring (Bichler-Robertson, 2000:115-116). Formulations of hazard typically involve some sort of risk measure. Usually it involves an accident rate from an earlier period of time, i.e. three-year rolling average of the proportion of vessels involved in a casualty for a defined geographic area. The denominator in this calculation requires information about the total number of vessels, in the designated area, that could be involved in a casualty. Vessels originating within the study area may flounder outside of the region and this event would not be captured in the analysis. Conversely, events involving vessels that originated outside the area of study many occur within the region in question. This interrelated nature of maritime transportation requires either a global perspective or narrow selection criteria-only using local ferries or cruise vessels. However, given the rarity of events, research must use a global sample generation process and construct measures that are somewhat reliable over space and time.
Overcoming Methodological Issues
To address these methodological limitations, this research involved constructing
a database of casualties by piecing together bits of information from many publicly
available sources: newspapers, wire services, and Lloyd's List were examined
to find the initial event information-name and ownership of the vessel, location
of the casualty, eyewitness testimony regarding the vessel's condition, number
of people involved, and estimates of the seriousness of the event in terms of
material damage and lives lost. Using the vessel's name, owner and accident
location, it was possible to search Maritime Court proceedings and national
accident investigation commission reports for information about factors leading
up to the event, including some relevant information about the vessel's management.
Next, cross-referencing the vessel's name with the listings of registries provided
information about the vessel's legal capacity, major renovations, age and other
pertinent details. Data were then examined against chronicles-like Norman Hooke's
Maritime Casualties 1963-1996 (1997)-for completeness and consistency.
Indicators of Corporate Negligence
For the purposes of this research, risk-taking was synonymous with corporate
negligence. Within the maritime context, corporate negligence involves acts
of omission or commission resulting from deliberate decision-making by those
occupying structural positions within the business organization-corporate executives
or managers-that renders the vessel unseaworthy, meaning it is unfit for its
intended use.
As stated above, obtaining information about profit maximizing decisions is a difficult enterprise because crucial evidence is under the direct control of the organization; however, risk-taking can be ascertained through indirect measures. A number of factors are commonly accepted as being indicative of corporate attempts to maximize profit at the expense of safety including, but not limited to: registration with a flag of convenience (FOC), vessel age (over 20 years old), poor vessel maintenance, inoperable auxiliary equipment, loading beyond legal capacity, and failure to keep an accurate manifest. Indicators of each factor listed above were created (dichotomous coding where a value of one indicates presence of the feature and zero reflects absence) and summed to construct an index of risk-taking. Events with more than three points on this index are associated with high levels of potential risk-taking. (For more information about variable construction please see Appendix A).
Indicators of System Hazard
System hazard was defined as a general overarching threat posed by external
or systemic elements-classification societies, Protection & Indemnity Clubs,
port authorities, registries, Coast Guard, weather, traffic volume, actions
of other captains, and treacherous channels-associated with the maritime passenger
transportation industry, within a particular area. Given the complexity of the
system, duration of the study period, and global nature of this research, it
was not possible to create direct measures of each system component listed.
Six variables were combined in an additive fashion to create an index of system hazard: low enforcement capacity (GDP in constant 1993 US dollars assigned values by quartiles); exposure to hazard (voyage length in nautical miles assigned values by quartiles); the event occurred in a high traffic area (within 1.5 nm of a harbor or in a major shipping lane); the event involved a collision with another vessel (reflects density of traffic and behavior of other vessels); and, inclement weather (major storms). Similar to the index discussed above, events with three or more points on this measure are likely to be associated with high levels of system hazard. (Additional information about the construction of this variable can be found in Appendix A.)
Study Casualties
Selection criteria were kept to a minimum; all casualties between 1950 - 1998
involving cruise ships and ferries that were sailing with fare paying passengers
at the time of the event were included. Vessels had to be legally certified
to carry at least 10 people. Chartered fishing ships and those vessels involved
in transporting refugees were not included. Events were coded by the location
of the casualty, not the origin or destination. Ten regions, somewhat loosely
based on United Nations classifications and volume of maritime traffic, were
used: NE United States, North Pacific, Eastern Africa, Middle East, Asia, Southern
Europe, Caribbean, Northwestern Europe, and Southeast Asia.
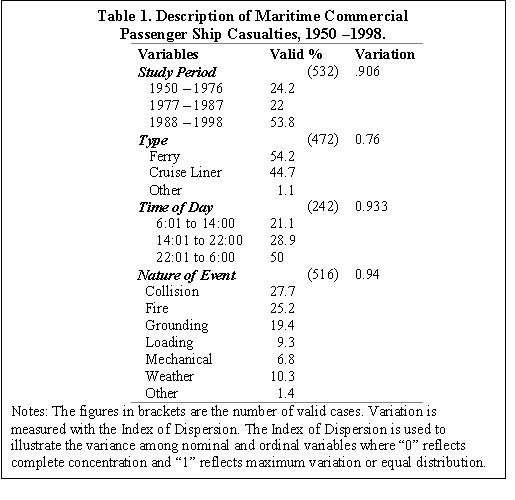
The data collection process generated 532 usable events that involved in excess
of 24,000 deaths and about 6,840 serious injuries. Despite the breadth of the
study period, about 54 percent of the casualties occurred from 1988-1998 (see
Table 1). Casualties were fairly evenly split between ferries and cruise ships
(54.2 and 44.7 percent respectively). Events were more likely to occur in the
evening or late at night. Most of the events involved collisions, fires or groundings
(28, 25 and 19 percent respectfully).
Comparing casualty rates with those reported in official statistics demonstrates that this database development strategy generates loss estimates that are seven to 12 times higher than those reported in statistical abstracts (Bichler-Robertson, 2000:228). According to official statistics, less than one percent of the merchant passenger fleet was lost each year (1976-1993); however, this database estimates that during this time period an average of 3.2 percent of the world's merchant passenger fleet was lost each year (Bichler-Robertson, 2000).
Geographical Analysis
Two types of analysis were conducted on this set of casualties: traditional
statistical analysis including Ordinary Least Squares Multiple Regression, and
a Kernel Density analysis of key areas within high frequency regions.
Traditional Statistical Analysis
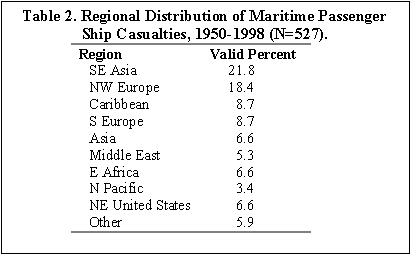
Casualties were not evenly distributed across the 10 regions; Southeast Asia
and Northwestern Europe had substantially more events than other areas (Table
2). This is not surprising given the heavy reliance on maritime passenger ship
travel in these regions.
i. Characteristics of Casualties by Region
Looking at the distribution of corporate risk-taking factors within each of
the four areas of casualty concentration reveals interesting patterns (Table
3). Southeast Asian casualties are about twice as likely to involve antiquated
vessels (over 20 years old) that were demonstrably deficient in terms of adhering
to internationally accepted safety standards. Compared to Northwestern Europe,
Southeast Asian casualties are also more likely to be characterized with manifest
issues; in six times as many events, the owners were unable to accurately identify
the number of passengers that were on the vessel. While Southeast Asian casualties
were less likely to involve vessels flagged with convenience registries, they
were about 28 times more likely to involve overloading.
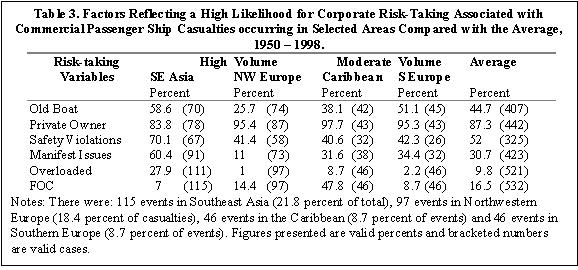
Comparing moderate volume casualty areas, the most striking differences relate
to the age of the vessels, overloading, and national registration. Caribbean
casualties tended to involve newer vessels-most likely a reflection of the rapidly
expanding US based cruise industry. The strikingly high level of FOC registered
vessels also reflects the impact of the Caribbean cruise industry in this region.
It is important to note that all of the loading-related events involved ferries
servicing the area and not the cruise industry.
System hazard is also distributed unevenly across the regions (Table 4). Comparing
the two high volume areas, events are different in terms of proximity to high
traffic, enforcement capacity (GDP) and voyage length (exposure to system hazard).
Casualties occurring in Southeast Asia are less likely to occur in busy shipping
lanes or within 1.5 nm from a major port. Examining the distribution of events
in terms of associated GDP of closest nation illustrates that most events in
Southeast Asia occur near nations with poor enforcement capacities. In addition,
Southeast Asian events involve vessels traveling shorter distances.
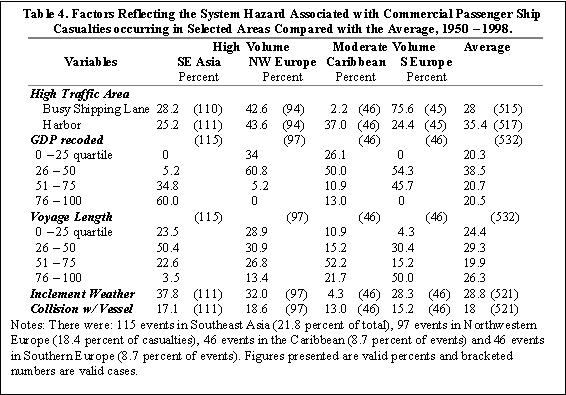
Comparing Caribbean casualties to Southern European casualties shows dramatic differences. While voyage length and collision features are relatively similar, other features are opposite. Southern European casualties occur in busy shipping lanes (75.6 percent); whereas, Caribbean events occur with greater frequency near major ports. In addition, Southern European events occur near nations with moderate enforcement capacity whereas Caribbean vessels overwhelmingly occur near nations with moderate to high enforcement capacity.
Turning to the magnitude of the casualties, Southeastern Asia is plagued with
more horrific events while Northwestern Europe casualties are minor (Table 5).
Contributing to this discrepancy is the polar difference in GDP. Although used
here to measure enforcement capacity, GDP is also indirectly tied to search
and rescue capacity. Casualties occurring on Northwestern European waterways
may have the capacity to be as catastrophic but proximity to Coast Guard rescue
services reduce the fatality rates, just as murder rates are linked to proximity
to hospital services.
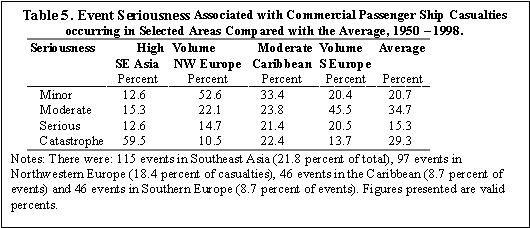
Within the moderate volume category, Caribbean events are somewhat evenly split among all four categories; on the other hand, Southern European casualties are predominantly minor to moderate. (For a detailed description of the seriousness ranking see Appendix B.)
ii. Ordinary Least Squares
Ordinary Least Squares estimates illustrate the importance of examining casualties
on a regional basis. All models were significant in accounting for variation;
though, the percent accounted for varies.
Corporate risk-taking factors account for a significant amount of the variation
in seriousness of casualties occurring in Southeast Asia (Table 6). Together
the independent variables explain 64 percent of the variation in magnitude of
casualties. With a standardized beta coefficient of .195, the variable measuring
risk-taking is 19 times more important than the measure of system hazard. This
pattern is not replicated in Northwestern Europe. While the model was significant
and accounted for about 37% of the variation, neither of the independent variables-risk-taking
or system hazard-were significant.
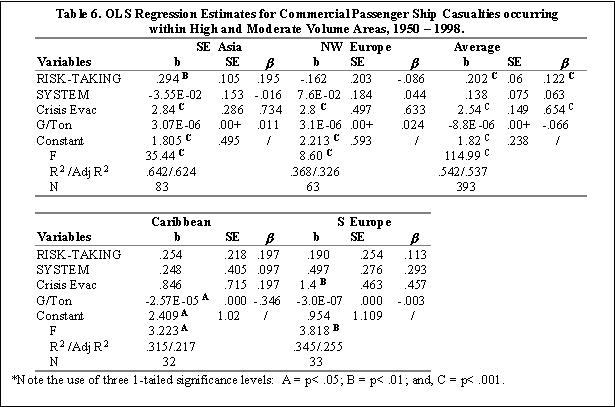
Turning to the moderate volume areas, the model remained significant and consistently accounts for over 30% of the variation; however, neither of the explanatory variables have significant effects in the Caribbean or Southern Europe (Table 6). Among Caribbean casualties, the measure of corporate risk-taking had a standardized beta coefficient that had twice the effect as system hazard; though, neither were significant. In Southern Europe this pattern was reversed and equally as insignificant.
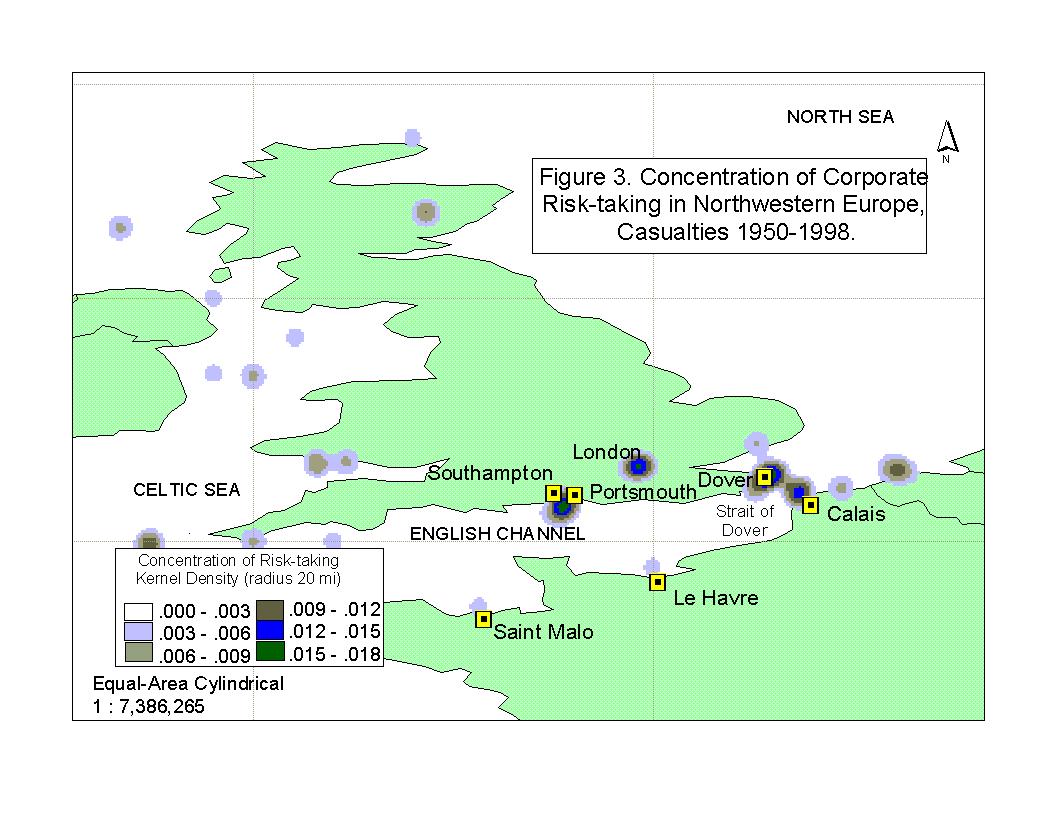
Spatial Analysis with GIS
Two analytic procedures were applied to the areas of highest casualty concentration
within each high volume region: the Philippines and the English Channel (12
and 9.6 percent of the casualties respectively). Kernel density analyses were
conducted at varying scales-in miles and nautical miles-to determine where high
levels of corporate risk-taking and system hazard concentrate: 50, 20 and 10-mile
radius; and, 10 and five-nautical mile radius (only a couple of maps are included
here). Equal interval and standard deviation were used to define categories.
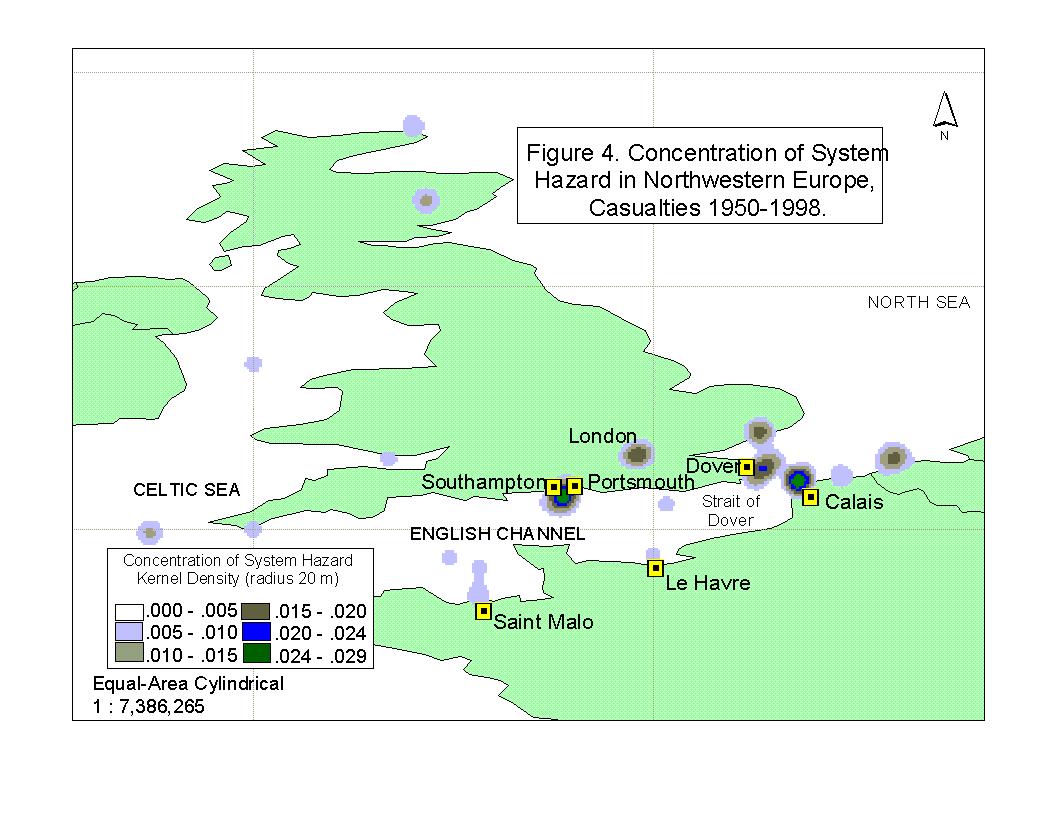
Examining the geographic distribution of corporate risk-taking and system hazard
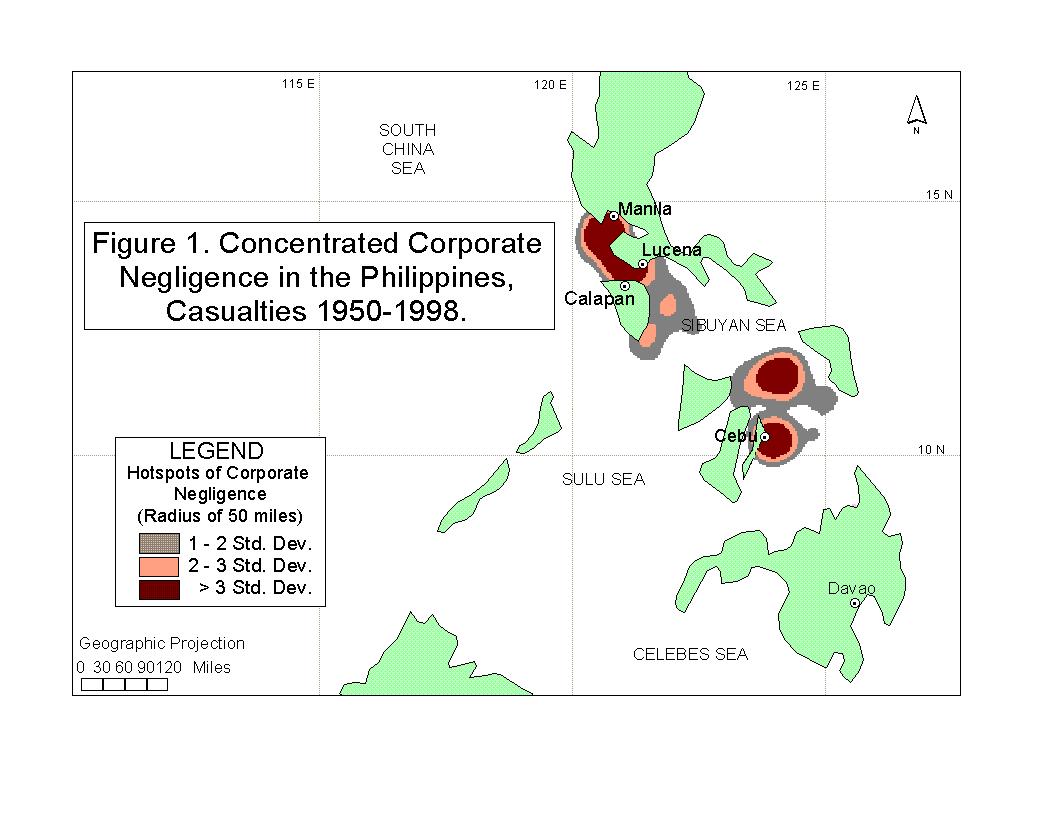
within the two high volume areas shows interesting patterns (Figures 1-4). Figure
1 shows a kernel density of corporate risk-taking with a 50-mile radius. Casualties
associated with high levels of corporate risk-taking are not evenly spread throughout
the area; instead, events with high scores, on the index variable reflecting
corporate risk-taking, concentrate near major harbors. Events highly associated
with corporate negligence tend to occur along the main shipping route between
Calapan and Manila. Additional concentrations of negligence, beyond three standard
deviations, exist near to Cebu City and Masbate Island-though the crudeness
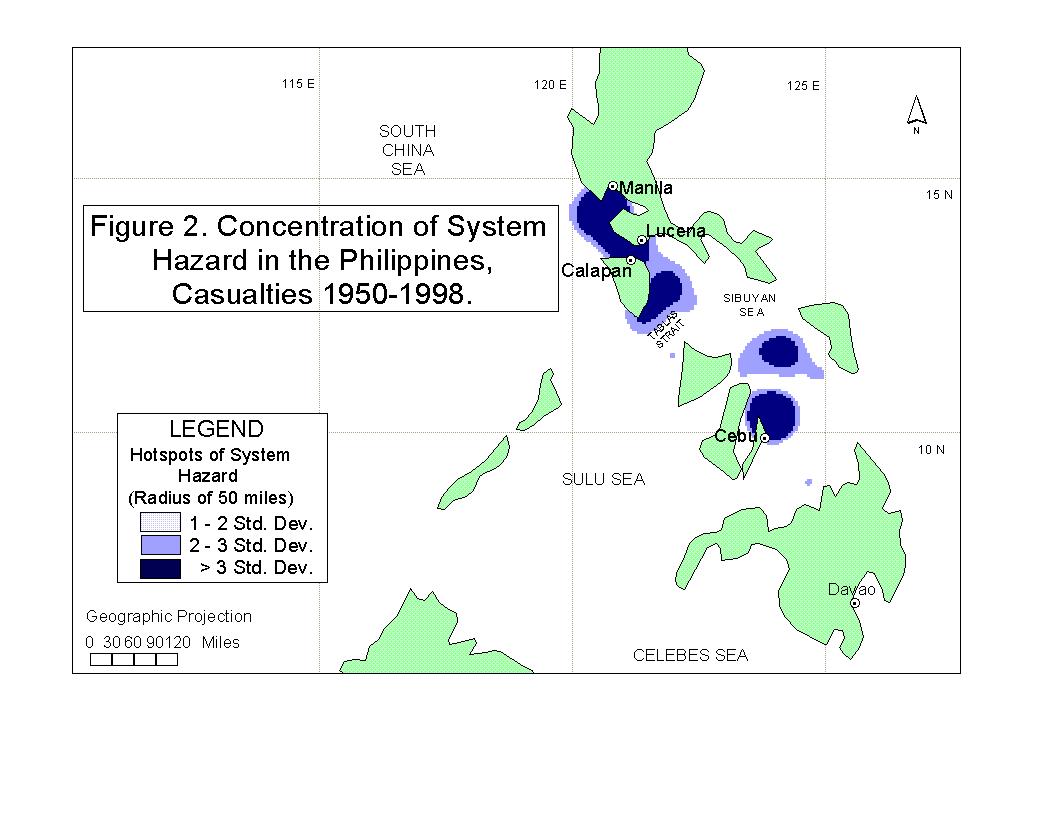
of the map make it difficult to identify the exact location. System hazard concentrates
in the same areas with one exception, there is another key area along the side
of Midoro Island in the Tablas Strait (Figure 2). Changing the map units, radius
and scale did not alter these patterns.
While the index term of risk-taking failed to be significant in the other regions, there were unexpectedly high levels of safety violations. This is cause for concern.
The high level of deficiencies in the Caribbean-more than 40 percent of casualties-is interesting given the recent focus of US efforts to crack down on foreign flags and inspect all cruise vessels on a regular basis. This study confirms a report that summarized inspections of 193 cruise vessels sailing from US ports (137 of which were flying foreign flags): the report found a high level of safety deficiencies/violations among all vessels inspected (GAO, 1993).
European casualties showed similar rates of safety violations despite multinational efforts to improve shipping. Under the Paris MOU, vessels calling on European ports since 1982 are subject to a multinational inspection effort. Collectively, the 18 members of the Paris MOU inspect between 85 - 95 percent of foreign merchant ships (Paris MOU, 1997). Together, these nations found that about 52.8 percent of inspections of passenger ships and ferries turned up deficiencies (Paris MOU, 1997). This is consistent with these findings.
Even within areas where corporate risk-taking was not a dominant feature, the concentration of casualties associated with high levels of risk-taking increased with proximity to major ports. System hazard also concentrated near major ports. This suggests an important interaction affect that intensifies as the distance to port decreases. More research is needed to examine this phenomenon in greater detail.
Given the importance of these findings, additional analysis were preformed to examine the level of safety violations associated with casualties occurring between pre- and post signing of the Paris MOU and the US Coast Guard report (GAO, 1993). This analysis showed no significant differences. Comparing casualties occurring between 1950 and 1981 with those occurring following the creation of the Paris MOU, there was a five percent decrease (45.5 to 40.4 percent among Northwestern European casualties and 45.5 and 40.0 percent in Southern Europe) in the number of casualties involving vessels with existing safety problems. Among Caribbean casualties, there was a ten percent increase in the number of casualties involving vessels with safety deficiencies (36.8 to 46.2 percent) when comparing pre- and post-release of the Coast Guard study; however, this change was not significant. Repeating the analysis with a four-year time lag does not improve the results. From this preliminary analysis it appears that international efforts to increase enforcement of shipping conventions, created by the International Maritime Organization and ratified by member states, have been unable to rectify the situation (Paris MOU, 1997). Additional research is needed to more carefully study the impact of these multi-national efforts.
Conclusion
Research examining corporate decision-making provides extensive evidence of
corporate wrong doing in the name of profit (Punch, 1996; Keane, 1993; Mokhiber,
1988). Subversion of safety laws through cost-cutting measures equates to conscious
decisions to sacrifice the safety of passengers and crew. Data challenges associated
with studying rare events involving corporations can be overcome with publicly
available data sources. Further, combining traditional statistical analyses
with GIS-based analyses provides additional insights with important policy implications.
Even within regions where corporate risk-taking was not found to be a significant
explanatory factor, areas of high risk-taking concentration exist. Surprisingly,
these areas of concern overlap with areas of high system hazard, suggesting
an important interaction effect that intensifies with increasing proximity to
major ports. This pattern was only visible through GIS and would have been overlooked
if one simply relied on traditional statistics. This research demonstrates the
utility of using GIS to examine rare events.
Appendix A
Below are excerpts from Bichler-Robertson (2000:106-112) that detail how variables
were constructed.
| i. Operationalizing the Concept of Negligent Corporate
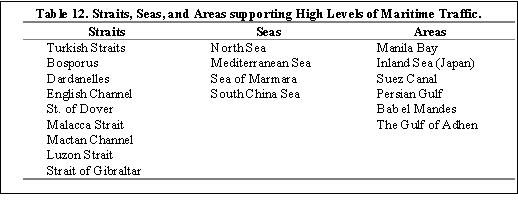
Risk-taking Seven independent variables represent the concept of negligent corporate risk-taking these are; vessels over 20 years old (old boats), private ownership (PRIVATE), flag of convenience (FOC), flag of detention (FOD), presence of deficiencies (safety violations), failure to record the actual number of passengers and crew on board the vessel (poor manifests) and loading beyond capacity (overloaded). Each variable was recoded into a dichotomous variable where "1" indicates presence of the factor. Then, the variables were combined in an additive index item to represent negligent corporate risk-taking (RISKY). (…) National registries considered flags of convenience in this study include those listed as convenience flags by the International Transport Workers' Federation where confirmation is available from other sources. These include: Antigua, Bahamas, Barbados, Belize, Bermuda, Burma, Cape Verde Islands, Costa Rica, Cyprus, Canary Islands, Cayman Islands, Cook Islands, Gibraltar, Honduras, Lebanon, Liberia, Luxembourg, Malta, Marshal Islands, Mauritius, Netherlands Antilles, Panama, St. Vincent, Sri Lanka, Tuvalu, and Vanuatu. If either vessel involved in the event was registered with one of these nations then this case was coded one for FOC. (…) Safety violation indicates that there was evidence of deficiencies serious enough to have grounded the vessel, had the ship been inspected prior to departure by the United States Coast Guard, under its Port State Inspection Program. Reviewing all of the deficiencies found by the USCG inspection program (1998 - 1999 data) produced a list of violations that occur with the greatest prevalence. Primarily, the list includes factors that are considered serious enough to warrant a detention: inadequate or inoperable safety equipment on board the vessel, invalid licenses, lack of crew proficiency with fire-fighting and ship abandonment drills, poor ship maintenance as evidenced by excess oil in the engine room, and et cetera. Each event was carefully researched to see if the primary vessel was described as showing any of these deficiencies. Two variables were created to reflect the presence of substandard conditions. The first simply tallied all of the deficiencies and the second, was a dichotomous variable coded one if there was evidence to suggest that the vessel could have been detained. Because there was much variability among the quantity and quality of information about each case, the ratio level variable (total number of deficiencies) was not used in this analysis. ii. Defining System Hazard (…) six variables were combined in an additive fashion to create an index of system hazard: enforcement capacity (GDP), exposure to hazard (voyage length), high traffic areas (proximity to harbors and busy shipping lanes), collision with another vessel (COLB), and finally, inclement weather (weather). An additive function was used because prior research failed to identify the mathematical function that produces component interaction. In the absence of precedence, the additive model that weighs each factor equally was the most logical starting point. Below, the discussion details the construction for a few key elements of this term. Regional enforcement capacity was not directly measured. Instead, the gross domestic product per capita in 1995 US dollars (GDP) presented an indirect economic measure of the nearest nation's ability to regulate and respond to maritime concerns. Figures were taken from the International Monetary Fund's World Economic Outlook (WEO) Database of April 1999. The gross domestic product in billions of US dollars was adjusted for each nation so that the figures were in constant 1995 dollars. Data were not available prior to 1970. Measuring exposure to hazards involved the voyage length (nmi). Voyage length approximates the duration spent within the hazard for that trip. To create voyage distances both the origins and destinations were plotted on a digital map of the world. Then, by referencing shipping lanes, intermediary stops and general voyage descriptions, the most probable route taken by each vessel was plotted. The ArcView© function called "find distances" was used to estimate the route length in nautical miles. For round trips and cruises, this distance figure was doubled. The average voyage length per region was used to estimate missing values. In order to combine this factor into the index, quartiles were used to distinguish, minimum (0-25th quartiles), minor (26-50th quartiles), moderate (51-75th quartiles) and major exposure (76-100th quartiles). The minimum category was assigned a value of ".25"; minor exposure was valued at ".50"; moderate exposure was valued at ".75"; and finally, major exposure received a value of "1". Evidence suggests that system hazard should be most extreme and vessels most vulnerable, when in proximity to high traffic areas. Vulnerability was measured by two factors: whether the event occurred within 1.5 nmi from a port, and whether the event occurred in a high volume shipping lane. Major shipping lanes with a high volume of traffic are listed in Table 12. |
|
|
| Selection of high traffic water bodies used graphic and statistical
information provided in a map of ocean transportation routes located in
the New International Atlas (Rand McNally, 1994). To be considered high
volume, at least 200 million metric tons of cargo must be carried over the
route annually. Additionally, the list included the North Sea because of
the high volume of passenger vessel traffic that it supports. Both of these
indicators of high traffic areas were manually coded in a dichotomous fashion. COLB indicates whether the event involved a collision between two or more vessels. This variable was included because research shows that collisions between vessels are generally the product of failure to adhere or understand the rules of the road (Gardiner, 1981). Here the event receives a code of zero if the collision does not involve another vessel. Finally, events wherein weather was a contributing factor were coded in a dichotomous fashion as well. This factor represents the natural hazard presented by the interaction between climate and sea conditions. It is also an indirect measure of production pressure (…). As stated previously, the above variables were added together to form an index that represents system hazard. |
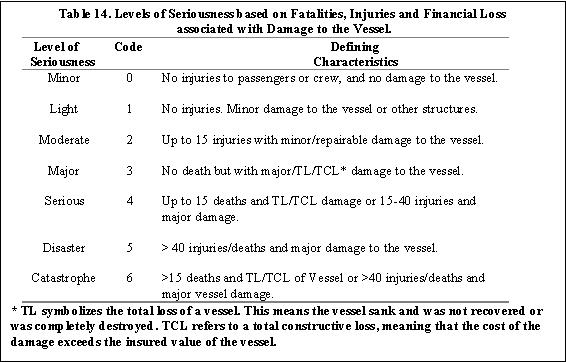
| Classification of maritime losses is often computed by tonnage and number of deaths. (…) Following the precedent of Hooke (1997) and other maritime research, event seriousness employed seven levels or categories (See Table 14). Categories were developed from variation in three factors namely, fatalities of passengers or crew, injuries among those on board, and the extent of damage to the vessel. |
|
|
| In some situations no injuries were reported; this does not mean that the casualty did not cause human injuries, but that conclusive information was not available. An estimation procedure was developed in order to reduce the number of missing values for this variable. When accurate fatality and vessel fate information were available and the number of injuries missing, one of three adjustment figures were multiplied by the manifest to conservatively estimate the number of likely injuries. For events were 75 to 100 percent of the passengers and crew survived and there was serious damage to the vessel (either TL or TCL), five percent of the manifest was estimated to have sustained injuries. In situations where 50 to 74 percent of the manifest survived and the vessel lost, ten percent of those on board were expected to have suffered injuries. Finally, where zero to 25 percent of the manifest survived and the vessel declared a total loss or total constructive loss, missing values for injuries were replaced with 15 percent of the people involved in the event. |
Endnotes
i. There were a total of 653 events discovered that met the selection criteria,
of which 121 were excluded due to insufficient evidence. A detailed bias analysis
revealed that the excluded events were to be very serious events occurring in
Southeast Asia (for more information see Bichler-Robertson, 2000).
ii. The large number of recent events reflects improvements in availability
of data and the development of global information networks. Analysis of the
characteristics of events over time does not reveal significant differences
in the nature, seriousness or circumstances of casualties.
iii. The US based cruise industry has been expanding since the early 1980s:
the number of cruise ship passengers embarking form American ports has grown
between eight and 15 percent each year (GAO, 1993; McDowell, 1991) . To meet
the demand, new, megaships are being constructed: twenty-one new cruise vessels
were scheduled for launch in 1998 alone (Borcover, 1996).
iv. For more information about Port State Inspection programs please refer to
Bichler-Robertson, 2000.
References
Benkert, W.M. (1978). Reasons for Collisions and Groundings. Paper No.1. Safe
Navigation Symposium, Proceedings of a Conference of the Oil Companies International
Marine Forum. 17-18, Jan. 1978. London.
Bichler-Robertson, G. (2001). Using GIS to Examine Maritime Corporate Crime: A Study of Philippine Passenger Ship Accidents." Crime Mapping News. 3(1): 8-11.
------- (2000). Maritime Commercial Passenger Ship Casualties, 1950-1998: An Analysis of Negligent Corporate Risk-taking and System Hazard. Ann Arbor, MI: Bell and Howell Information and Learning Company.
Boczek, B.A. (1962). Flags of Convenience: An international Legal Study. Cambridge, MA: Harvard University Press.
Borcover, A. (1996). "Shipshape on Safety; Cruise Task Force Looks at Minimizing Mishaps." Chicago Tribune. Section, Travel; Page 2, Zone C.
Cahill, R.A. (1990). Disasters at Sea. San Antonio, TX: Nautical Books.
Clinard, M. (1990). Corporate Corruption: the abuse of power. Westport, CT: Praeger Publishing.
Gardenier, J.S. (1981). "Ship Navigational Failure Detection and Diagnosis." In: Jens Rasmussen and William Rouse (eds.) Human Detection and Diagnosis of System Failures. Plenum, Publishing.
General Accounting Office, U.S. (1993). Additional Actions Needed to Improve Cruise Ship Safety. Washington, DC: United States General Accounting Office.RCED-93-103
Gray, W.O. (1978). "Human Factors." Paper No. 3 Safe Navigational Symposium, Proceedings of a Conference on Safe Navigation by the Oil Companies International Marine Forum, London, 17-18 Jan, 1978) pages 3-12.
Hagenzieker, M and W.A. Wagenaar (1987). Beslissen en risico-acceptatie aan boord van schepen: Riskant gedrag op zee? (Report 87-15) Leiden: Leiden University, Centre for Safety Research.
Hooke, N. (1997). Maritime Casualties 1963-1996. 2nd edition. London, UK: LLP Limited.
Keane, C. (1993). "The Impact of Financial Performance on Frequency of Corporate Crime: A latent variable test of strain theory." Canadian Journal of Criminology. 35(3):293-308.
Lloyd's List (1994). "It's official- crews of convenience are accident prone." Lloyd's List. p.14: Feb.21.
Maritime Transportation Research Board, (June 1976). Human Error in Merchant Marine Safety. Washington, DC: National Academy of Sciences, National Technical Information Service. AD/A - 028371.
McDowell, E. (1991). "Many Call, but Few Cancel after Cruise Ship's Sinking." The New York Times. Section D. Page 1, Column 1.
Millar, I.C. (1980). "The Need for Structured Policy Towards Reducing Human-Factor Errors in Marine Accidents." Maritime Policy Management. 7(1):9-15.
Mokhiber, R. (1988). Corporate Crime and Violence: Big Business Power and the Abuse of Public Trust. San Francisco, CA: Sierra Club Books.
Mueller, G.O.W. and F. Adler (1991). "When passenger rates go down- so do passenger liners: an inquiry into the opportunity of sinking wisely." Security Journal 2(2):102-110.
Paris MOU (1997). The Paris Memorandum of Understanding on Port State Control, Annual Report 1997. http://www.parismou.org/Atwork/cover/html accessed 5/14/99 at 5:34 pm.
Pearce, F. (1995). "Accountability for Corporate Crime." In P.C. Stenning ed. Accountability for Criminal Justice. Toronto, ON: University of Toronto Press. 213-238.
Peterson, R.A. (1980). Maritime Oil Tanker Casualties (1964-1977): An analysis of safety and policy issues. Dissertation, University of Tennessee. UMI.
Perrow, C. (1984) Normal Accidents: Living with High-Risk Technologies. US: Basic Books.
Punch, M. (1996). Dirty Business. Thousand Oaks, CA: Sage Publications.
Tasca, L.L. (1990). The Social Construction of Human Error. Dissertation, State University of New York at Stony Brook. UMI.
Wagenaar, Willem A. (1992). "Risk taking and accident causation."
In: Risk-taking Behavior, J.F. Yates (editor). John Wiley and Sons Ltd.
| Author Information: |
Name: Gisela Bichler-Robertson, Ph.D. Title & Organization: Director, Crime Prevention Analysis Lab-CSUSB Address: Department of Criminal Justice, Telephone: (909) 880-5510 |
| Conference: | Esri International User Conference 2001 July 9-13, San Diego San Diego Convention Center |
| Paper Information: | Paper Number 521 Session Title: Crash and Safety Analysis Date: Wednesday, July 11, 2001 Time: 8:30 - 10:00 am Room: 16-B (SDCC) |