ABSTRACT
In the last two years "urban scale" imagery has become widely available. As well, data prices have fallen to a few hundred dollars per scene. During the first months of availability of a new census, this paper argues, there are opportunities to enhance the scientific potential of both remote and terrestrial data in studies of urban demography and issues of urban intrusion on the environment.
It is common for academic disciplines to go through extended periods of focus on a dominant issue. For the last few years urban planning has concentrated much of its attention on the issue of sprawl (Mitchell,2000). Sprawl largely means income-homogeneous, auto-friendly residential neighborhoods flanked by strip malls reached by a hierarchical network of culs-de-sac, meandering feeder roads, aterials, and motorways. In a recent (June, 2001) call for papers on this topic Geographer Xiaojun Yang observed:
"[A]ccelerating urban sprawl has often been viewed as a sign of the vitality of regional economy. However, such scattered growth driven largely by population growth and technological advancement has rarely been well planned, thus provoking concerns over the degradation of our environmental and ecological health."
Yang has proposed a five-point agenda for RS/GIS integration:
1) Remotely sensed data requirements for studying urban land use/cover changes;
(2) Digital image processing procedures for detecting urban landscape changes;
(3) Urban sprawl monitoring and mapping case studies;
(4) Study of the impacts of urban sprawl on ecological and social environment; and
(5) Urban growth simulation and predictive modeling based on remotely sensed data.
While this paper's origins predate Yang's call for papers, the convergence of ideas and concerns is not coincidental. It reflects not only a national, but also global, interest in the pace of urbanization and suitable monitoring technologies. The present paper deals with the first three of Yang's issues, in that it discusses data requiremements and processing procedures within the context of an exercise in comparative quantitative urbanology in USA. The US research context appears to differ markedly from that in Europe.
Our basic research question is this: to what extent can we rely on inexpensive data and off-the-shelf RS/GIS methods to confront the empirical and theoretical questions raised by urban sprawl? Briefly, this paper suggests that in the USA the wide availability of free, or nearly free, vector data sets reduces dependence on fine resolution (< 5m) imagery, that off-the-shelf image analysis techniques are up to the task of detecting neighborhood-scale changes in urbanization, that fine resolution imagery is especially useful in the detection of street-scale changes, and that drastic differences in political structure have limited impacts on certain aspects of urban morphology.
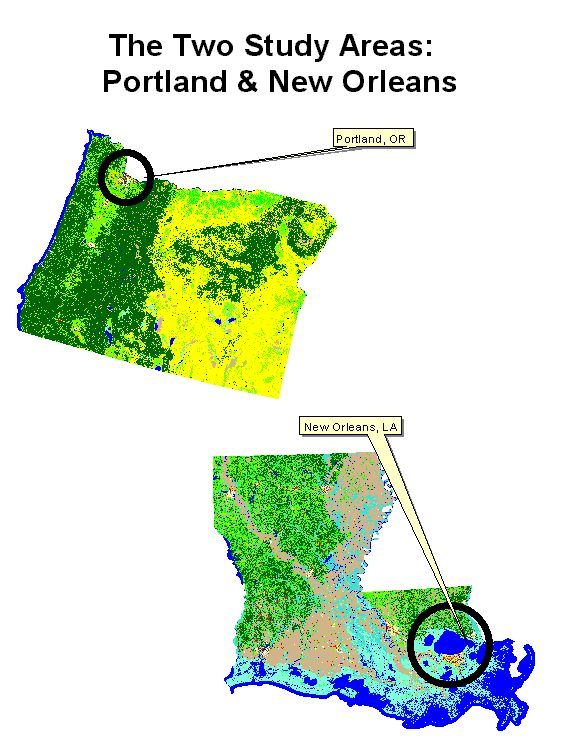
The research questions posed here are premised on the issue of sprawl and regional approaches to planning that are designed to mitigate sprawl's array of externalities (Duany, Plater-Zyberk, and Jeff Speck. 2000; Orfeld. 1997; Zimmerman, 2001). There is an extensive literature in this field, and among planners Portland, OR is a widely praised model.
Perhaps the major reason Portland has become a widely recognized model for planners is the dominant political culture of the region. Political culture is a complex notion (Almond and Verba, 1963) but one key ingredient is the level of public trust in government, and the political process in general. Compared to residents from certain other states, Oregonians can be thought of as "allegiants." At a very minimum, the public regardingness of Portlanders has attracted favorable attention from planning scholars and environmentalists. Portland spawns "A Vision of Green" (Stephenson, 1999).
Louisiana is at the other end of scale. Few states can match Louisiana's record of political alienation and parochialism. More than half a century ago the political scientist V.O. Key (1949) subtitled his chapter on Louisiana "The Seamy Side of Democracy." Fifty years after Key, urbanologist David Rusk (1999) argued that "Race and sprawl shape greater New Orleans." Rusk added, "No region needs a sensible, long-term comprehensive plan more than Greater New Orleans."
In comparing Portland and New Orleans we are not dealing with any kind of straw man. Stephenson was serious in calling Portland a "vision of green" It thrives under the tutelage of carefully crafted regional legislation. By contrast, New Orleans is a counter-utopia, racked by racism and sprawl, aggravated by inattention to an active and competent planning community. It is only natural to expect our spatial analytical tools to detect the more obvious morphological differences stemming from the cultural, economic, and political contrasts between New Orleans and Portland.
The comparison procedure does not stretch any technological envelope. Instead, the strategy employed here is to keep both data and technique within the financial and technological reach of any US county facing a sprawl issue. That is, the strategy tries to use cheap data and off-the-shelf methodology.As a matter of gross generalization, Europeans are working very hard on exploiting data from third-generation (< 5m.) sensors (Atkinson and Tate, 1999; Donnay, Barnsley, and Longley, 2001). They are also experimenting with highly refined classification tools designed to clearly delineate urban boundaries. The central technical issue raised in this paper is the extent to which the free availablity of vector data reduces dependence on fine resolution remote-sensed data, and exotic classification schemes, in detecting change and in monitoring sprawl.
At least for the time being, many non-US spatial scientists operate under the constraints of government policies premised on cost-recovery models that limit access to government acquired data. In some cases RS data are an alternative path to freely downloadable vector data. In the US these data are provided by the USGS, the Census, or the EPA among others. The expedients used outside the US are sometimes stunning in their ingenuity. Barnsley, Moller-Jensen, and Barr (2001) have, for example, demonstrated the feasibility of linking imagery with the artificial intelligence language PROLOG. While the method still requires tweaking, it is an impressive demonstration of the potential of automated feature extraction that extends the well established approach of classification by signatures, and creates topology from raster data. This is extremely useful in identifying features as small as local roads or even driveways. But for US planning practitioners, this may be overkill with respect to their responsibilities, which, arguably, begin at the scale of the census block group.
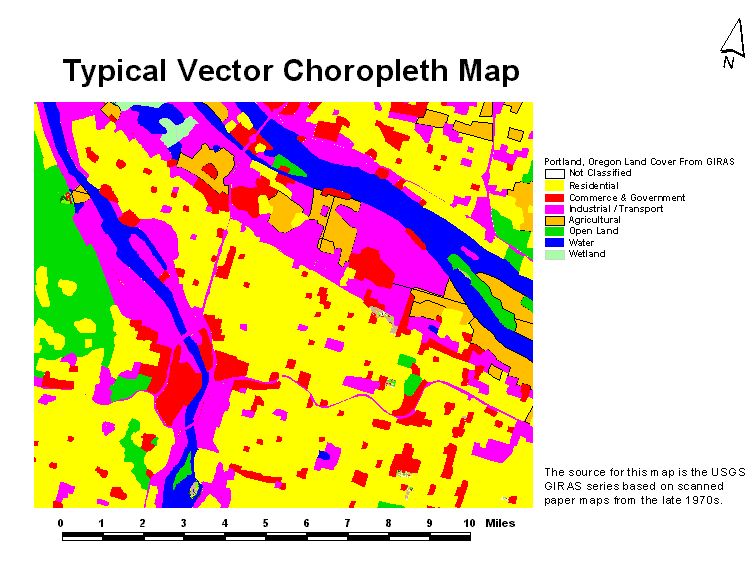
There are some distinct advantages to planners that come from older US vector systems. While it is true that fine resolution RS data are roughly equivalent to maps at 1:25000 or even 1:10000, The USGS provided GIRAS (Geographical Information Retrieval Analysis System) map below, nominally a 1:250000 product, is a powerful analytical tool for the detection of urban change, even though it has not been as widely used as perhaps it should be. GIRAS data can be downloaded in several layers from the USGS's USGEODATA site,
( http://edcwww.cr.usgs.gov/bin/maptest/coords=55+-130+20+-65/scale=250/type=lulc )
GIRAS data need blocking to 80 byte lines. One way to do this in UNIX is with
fold -80 [giras_file_name] > landuse_80
 This is a somewhat steeper ramp-up than most planners not specialized in GIS are used to. There is, too, an additional complication. GIRAS is based on NAD27, as a perusal of the metadata indicates, but this does not show up transparently in .prj files. So, this is just one more complication. But relief ought to be in sight. Data from this period, despite some of the limitations of GIRAS, are quite useful in change detection and sprawl analysis.
The reason GIRAS is so useful for change analysis lies in the fact that it features a two-digit land cover classification system that distinguishes urban land cover types from, for example, agriculture, open lands, wetlands, waterways, and forests. In the GIRAS-derived choropleth map immediately above we see a portion of Portland in the late 1970s. Maps of this genre are easy to overlay with other thematic material (DEMs for example) or similar themes from subsequent years.
The original impetus for building a temporal database of urban extent can be traced to five simple ideas.
o Urbanization is an important component of global change research which is not being addressed by any of the national research agendas.
o Historical data on urban extent can be used to calibrate a cellular model in order to predict regional patterns of urbanization.
o USGS topographic maps can be used to derive the extent of urban and built-up areas for the last 100 years.
o Landsat data can be used to map development from 1972 to the present.
o A time-series animation can be used to better convey the dramatic land use changes resulting from urbanization.
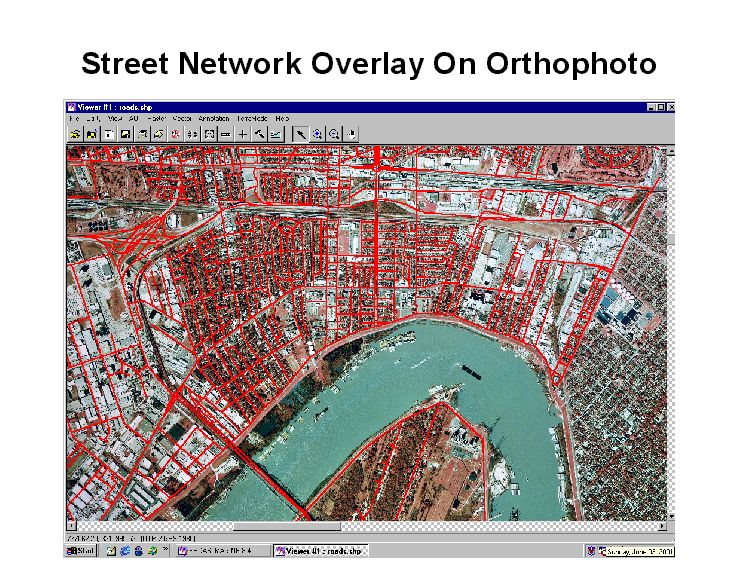
The power and appeal of the USGS temporal database is apparent. Also apparent is the fact that the sources of data in national research agenda are rather different from those of a typical urban planning office or firm. Most notable in the data-gap between big government and local assemblages is the latter's reliance on the Census as both a historical and geographical tool; most notable in methodological terms is the relative unfamiliarity many planners have with "cellular models" , commonly found in raster GIS and Remote Sensing (RS) software. Planners who use automated cartography have generally been schooled in vector GIS, and may use nothing more "cellular" than an aerial photograph as a backdrop, once Census mapping data have been projected from latitude and longitude into the image's planar coordinates as in the following illustration.(Maling, 1992, Snyder, 1987). This kind of technique, map overlay, is an important tool when comparing maps over time or across sources, so we will see a lot of this approach below (Chrisman, 1997).
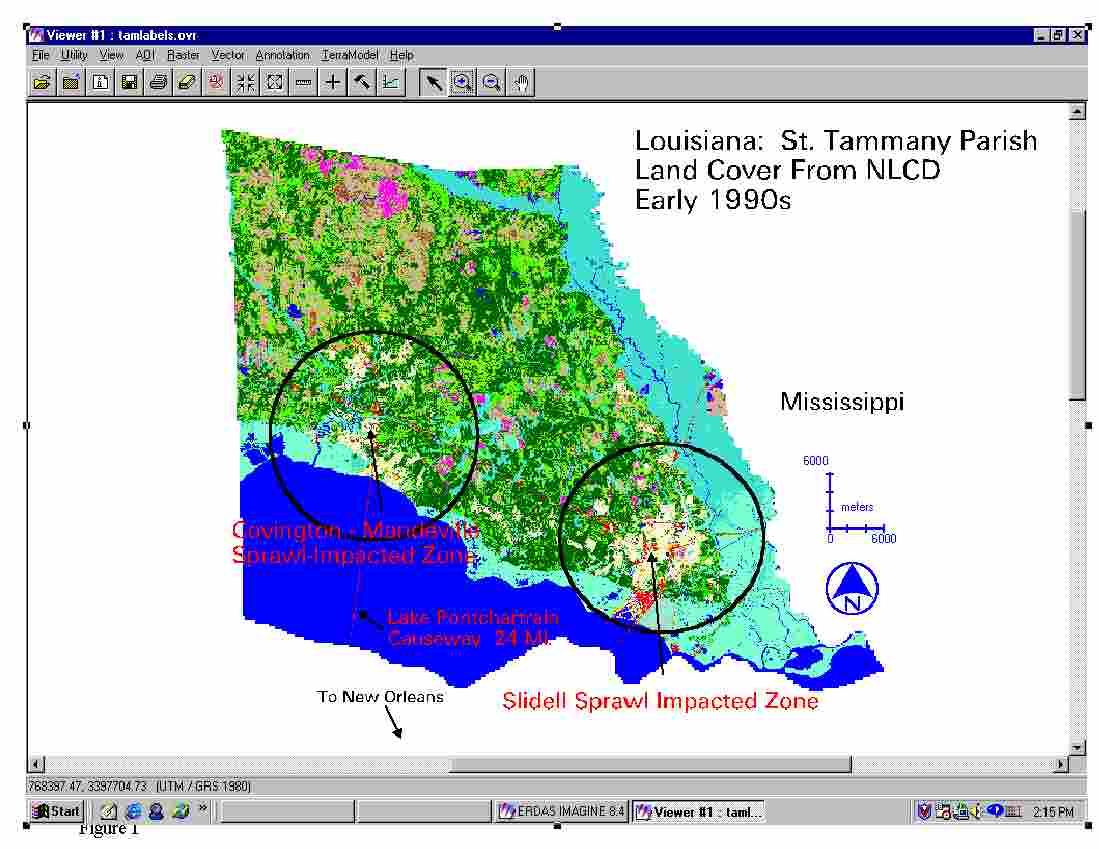
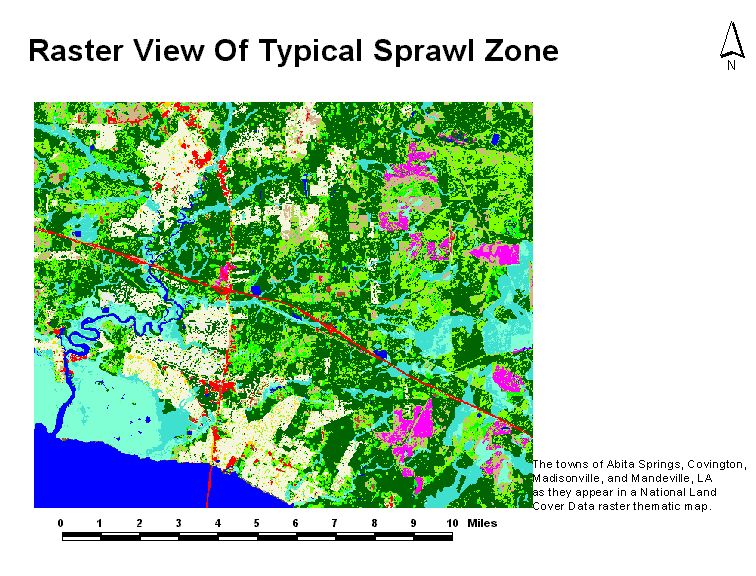
The following map, taken from the USGS National Land Cover Data 1992 (NLCD 92)( http://edcwww.cr.usgs.gov/programs/lccp/nationallandcover.html ) shows land cover in suburban New Orleans, specifically the towns of Mandeville and Covington in the early 1990s. The feature of the urbanization pattern most germane to this paper is the dendridic, as contrasted with concentric, appearance of the map. Twenty miles to the east, St. Tammany Parish's largest community, Slidell, shows similar tendrils. St. Tammany Parish, especially this part of it, is the target of much of David Rusk's criticism. It is filled with members of New Orlean's ex-middle class. Thus, the Covington-Mandeville axis is an attractive revenue target, but hard to integrate into a framework that would pass both Louisiana and US constitutional muster. It is just not possible to tax these people, under either constitutional framework, without enfranchising them. That, however, would complicate the region's racial balance of power (Monmonier, 2001).
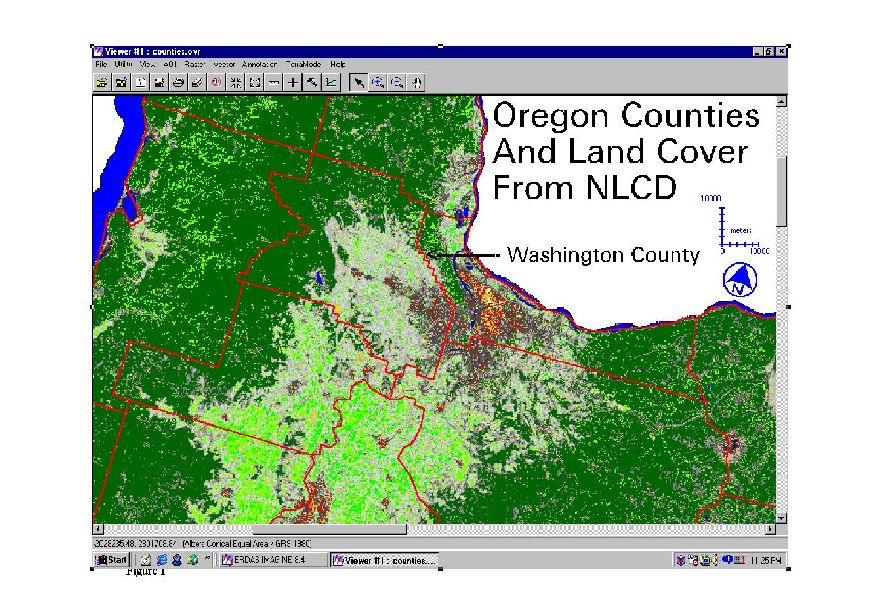
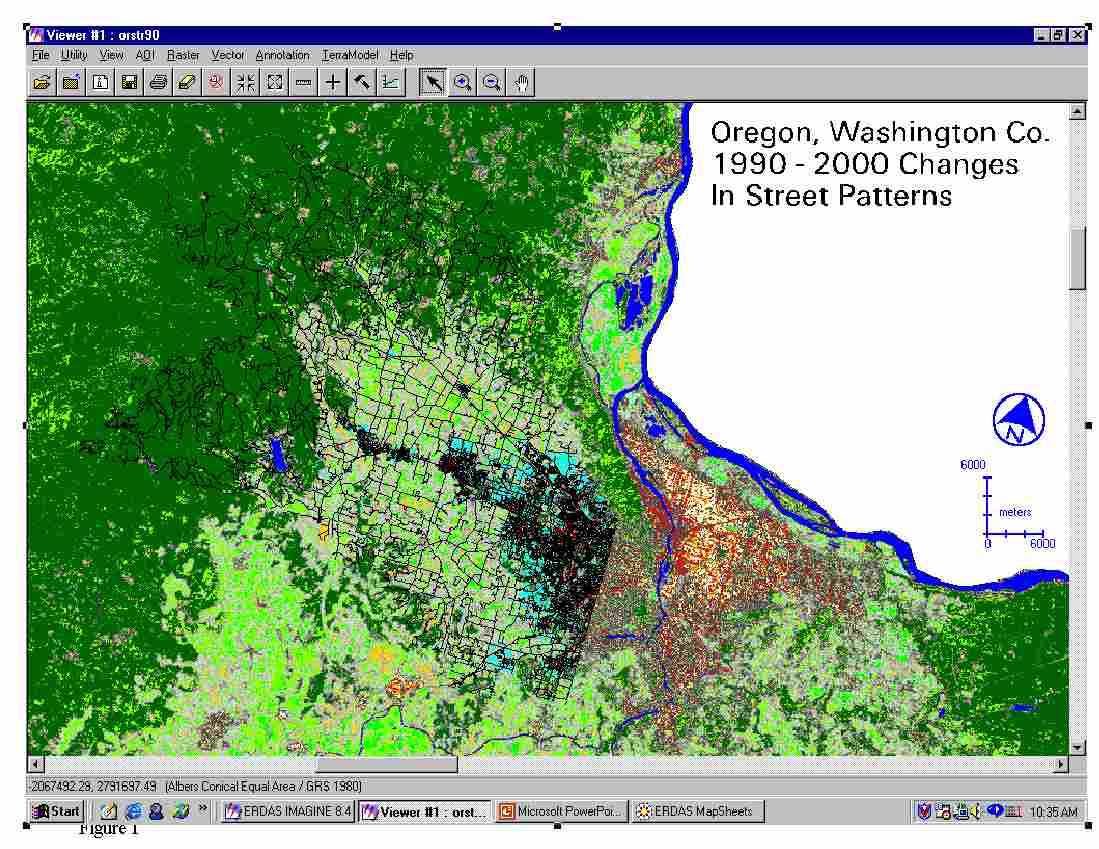
In suburban Portland, the dendridic, linear nature of urban development is even more apparent. In the next regional map we see Portland and its western suburb, Washington County. The latter is overlaid with TIGER 1995 (in black) and TIGER 2000 (blue) streets. Study of the map reveals that street growth does not leapfrog, but either infills or appends itself to adjacent networks.
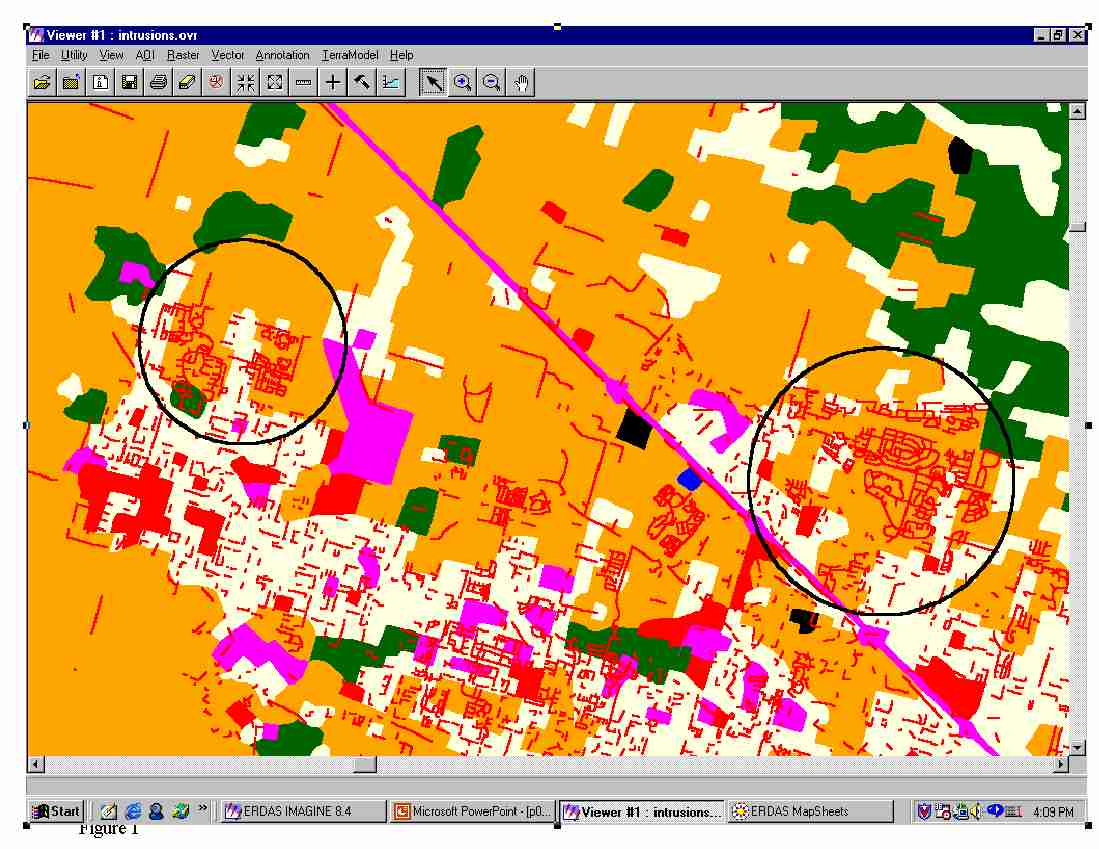
If we magnify our view of how urban expansion takes place in Washington County, by overlaying changes in street patterns between the early 1990s and 2000, a consistent pattern emerges. In existing residential areas (light light yellow) one sees short segments of streets scattered throughout neighborhoods. The circled areas, by contrast, intrude on agricultural land adjacent to existing residences. Many land use planners regard agricultural land as threatened. It is a serious argument, but in this instance it seems that Washington County will expand into nominally agricultural land rather than into forest or other green space.
The deployment of Space Imaging's IKONOS instrument has doubtless been recent history's most spectacular advance in RS data gathering. But in close second place is the deployment of the Enhanced Thematic Mapper, or LANDSAT-7. The two instruments have widely different capabilities and, it is important to note, marketing approaches. Briefly, IKONOS is a very fine resolution device, with a 1 meter panchomatic band, and three 4 meter resolution multispectral bands. Moreover, the platform can generate enough overlap to create stereo imagery. L-7 is an incremental improvement of the classic Thematic Mapper instruments dating from LANDSAT 4 and 5. For planners, at least, there are threee crucial improvements in in L-7. First, it features a 15 meter panchromatic band which appreciably increases spatial resolution. Second, the data are cheap -- $600 per scene -- and turnaround is quick. This is major consideration in comparison with IKONOS, which is comparatively pricey.
These considerations raise the issue of how to develop some sort of cost-benefit criteria. The most obvious variables useful for establishng benchamarks include visualization, classification capability, and change detection. All three overlap, but are distinguishable. At the outset there is a clear advantage to LANDSAT in classification capability simply because of its six most usable (for urban planning) bands. On the other hand, fine-resolution instruments have the edge in visualization, at least in the sense of detecting and validating ground features of interest to planners.
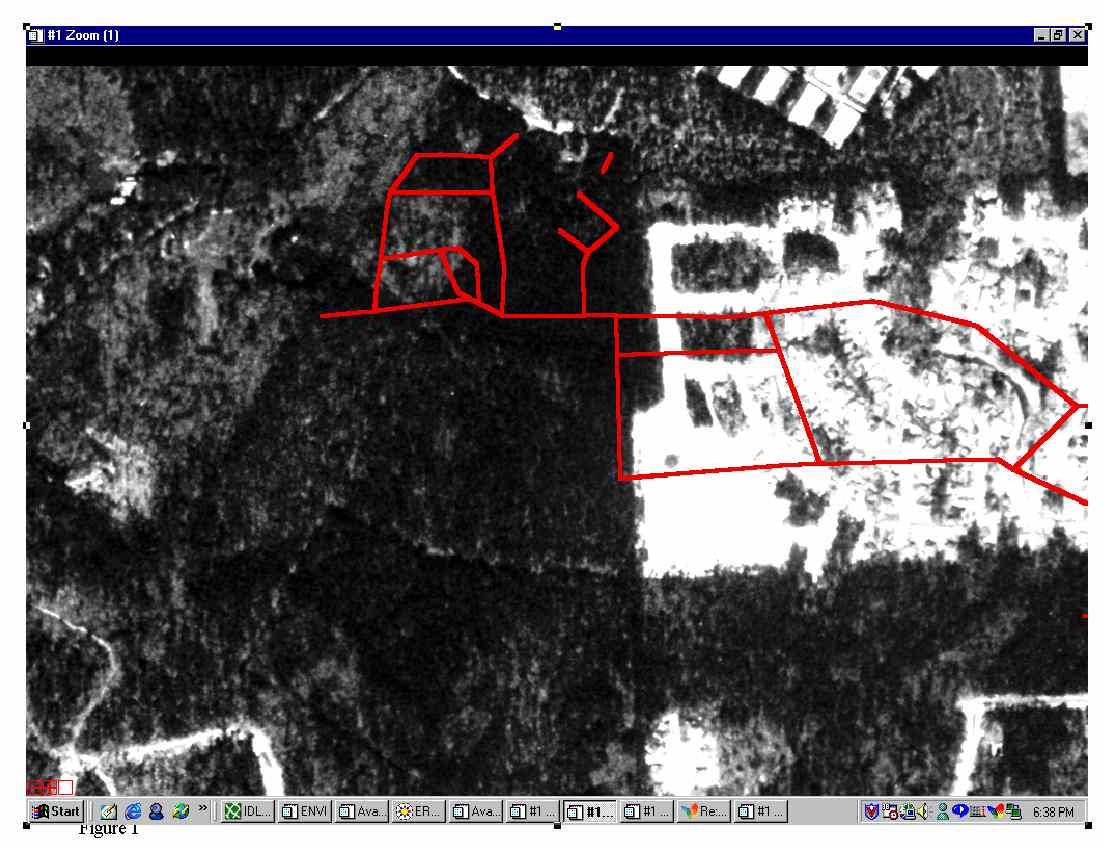
The image above is taken from a SPIN-2 scene acquired in March of 1998. It clearly shows a subdivision. Overlaid on it is TIGER 1995's version of the street network. The TIGER rendition suffers from a combination of horizontal displacement and incompleteness. The next version of TIGER showed great improvement (Franz, 2001), as we can surmise from the following LANDSAT-7 image of the wider neighborhood.

One lesson from this pair of images is that finer resolution imagery, such as SPIN-2 which has a nominal 2 meter pixel, can easily detect roads in new developments. Of course, detecting new development is a collateral benefit of the SPIN series. This instrument has the advantage of being very easy to handle, in that for a given area it requires only 25% of the volume of a 1 meter pixel set. This is useful for planners, who hardly need to penetrate to the sub-driveway level. On the other hand, SPIN missions are short-lived and selective in their coverage. Not every community falls under SPIN's footprint.
The image above, though it is magnified beyond reasonable exploitation levels, helps us get back to the question of how two widely separated suburban communities compare. One thing that emerges from a blend of vector (TIGER) analysis and raster analysis (NLCD and LANDSAT) is that on quantitative and morphological bases, the two counties (a parish is a county for planning purposes) do not clearly display great differences in planning outcomes.
Our basic research question was this: to what extent can we rely on inexpensive data and off-the-shelf RS/GIS methods to confront the empirical and theoretical questions raised by urban sprawl? The outcome of the technical questions seem clear cut. Inexpensive LANDSAT data, when supplemented with available US vector data put the borders of urban exapnsion and sprawl well within our grasp at the neighborhood level. In effect, it is not difficult to separate the urban from the non-urban. The theoretical issue gives one pause. Portland and New Orleans are posterchildren for good and bad planning, but their suburbs display virtually indistinguishable morphological behavior. In effect, New Orleans fails to live down to its reputation.
Both of the counties we used as test platforms had appreciable population growth between 1990 and 2000. In the case of Washington County population growth was 40%, in St. Tammany Parish it was 30%. Both had 8%-9% increases in street mileage, some attributable to construction, some probably to better data capture by the Census. In both cases urban growth follows linear or dendriditic patterns. Given the stark differences in planning regimes and regional government patterns, the morphological similarities are striking.
From a technical point of view, LANDSAT seems quite up to the task of detecting urbanization at the neighborhood level. In the case studies employed here we have to note that Oregon and Louisiana are heavily vegetated. The western part of Oregon, and the southern part of Louisiana, do not have distinct leaf-off seasons. Old residential areas might hide under an established canopy, but new areas of development can't hide from LANDSAT. New streets, as well, cannot hide from fine resolution imagery.
The inherently complex topic of change detection has not been directly addressed here. But the indirect evidence with respect to newly urbanized land is evident in the LANDSAT images in this paper. Sprawl is basically about new urbanization, and LANDSAT can detect it at neighborhood scales. What LANDSAT cannot do is keep us informed about street networks or parcel-level changes.
Adeniyi, P.O., 1983. "An Aerial Photographic Method for Estimating Urban Population." Photogrammetric Engineering and Remote Sensing. 20,2: 545-560.
Chrisman, Nicholas. 1997. Exploring GIS. New York: Wiley.
Barnsley, Michael, Lasse Moller-Jensen, and Stuart L. Barr. 2001. "Inferring Urban Land Use by Spatial and Structural Pattern Recognition" in Donnay, Jean-Paul, Michael J. Barnsley, Paul A. Longley, eds. 2001. Remote Sensing and Urban Analysis. London: Taylor and Francis.
Davenport, Joan, John Elsden, and Tom Sellsted, 1993, "Growth management planning: setting urban growth area boundaries utilizing GIS." Proceedings of the Thirteenth Annual Esri User Conference.
Donnay, Jean-Paul, Mike J. Barnsley, Paul A. Longley. 2001. Remote Sensing and Urban Analysis. London: Taylor and Francis.
Duany, Andres, Elizabeth Plater-Zyberk, and Jeff Speck. 2000. Suburban Nation: The Rise of Sprawl and the Decline of the American Dream. New York: Northpoint Press Ebdon, David. 1985. Statistics in Geography 2nd Ed. Oxford, UK: Blackwell.
Franz, Linda. 2001. Census 2000 and Beyond. Remarks delivered at the 2001 meeting of the APA. New Orleans, March 10, 2001.
Hall, Peter. 1996. Cities of Tomorrow. Oxford: Blackwell.
Key, V.O. 1949. Reprinted 1984. Southern Poltics in State and Nation. Knoxville, TN: University of Tennessee Press.
Kraak, Jan-Menno and Allan Brown. 2001. Web Cartography. London: Taylor and Francis.
Kwaku Kyem, Peter A. 2000. "Embedding GIS Applications inot Resource Management and Planning Activities of Local and Indeigenous Communities: A Desirable Innovation or a Destabilizing Enterprise?" Journal of Planning Education and Research. 20,2: 176-186.
Larsen, Richard J., and Morris L. Marx. 1981. An Introduction to Mathematical Statistics and Its Applications. Englewood Cliffs, N.J.: Prentice Hall.
Maling, D.H. 1992. Coordinate Systems and Map Projections 2nd Ed. New York: Pergamon Press.
Mather, Paul M. 1999. Computer Processing of Remotely-Sensed Images 2nd Ed. Chichester, UK: Wiley.
Mitchell, Stewart. 2000. GIS Model Comparing the Cost of Sprawl verses New Urbanism. Proceedings of the 12th Annual Esri User Conference
Monmonier, Mark. 2001. Bushmanders and Bullwinkles. Chicago: University of Chicago Press.
Mumford, Lewis. 1961. The City In History. New York: Harcourt Brace.
Orfeld, Myron. 1997. Metro Politics: A Regional Agenda for Community and Stability. Washington: Brookings.
Rusk, David. 1999. "The New Regionalism: Planning Together to Reshape New Orleans' Future." New Orleans Times-Picayune, September 8, 1999.
Shaw, Gareth and Dennis Wheeler. 1996. Statistical Techniques in Geographical Analysis 2nd Ed. London: David Fulton.
Snyder, John. P. 1987. Map Projections: A Working Manual. Geological Survey Professional Paper 1532. Washington: GPO.
Stephenson, R. Bruce. 1999. "A Vision of Green: Lewis Mumford’s Legacy in Portland, Oregon" Journal of the American Planning Association. 65,3:
Almond, Sidney and Gabriel Almond. The Civic Culture. Boston: Little Brown.
Weitz, Jerry and Terry Moore. 1998. "Development Inside Urban Growth Boundaries: Oregon's Empirical Evidence of Contiguous Urban Form. Journal of the American Planning Association. 64,4: 424-440.
Zimmerman, Martin. 2001. "Is New Urbanism Growing Old?" Planning 67,6: 10-13.