This paper aims to develop a topological data model, the Node-Relation Structure (NRS). It represents topological relationships, adjacency and connectivity relationships, between 3D spatial objects in built environments by Poincare Duality to simplify the complex spatial relationships between 3D entities. The dual graph representing the topological relationships between 3D objects consists of 0-cells and 1-cells utilized by graph theory. In order to implement 3D spatial queries in the NRS, the combinatorial network model (logical network) representing the connectivity relationships between 3D spatial objects needs to be transformed into the geometric network model. This paper uses an O(n^2) algorithm for computing a Straight Medial Axis Transformation (MAT), a technique used to describe a simple polygon. In terms of the reconstructed geometric network model generated after the transformation, this paper demonstrates to implement a spatial access based upon the complex topologic relations among 3D spatial objects using the modified Dijkstra's algorithms. The developed 3D NRS System is fully integrated into existing 2D GISs to implement the GIS functions.
For the last fifteen years, topological models for multi-dimensional objects have been developed by a number of researchers (Pigot, 1992). In these models, topological relationships are usually represented by a geometric representation of the cells in a cell-complex and their neighborhoods defined in terms of their boundary and co-boundary cells. These 3-D data models, however, are inefficient for resolving complex geometric computational problems - because the neighborhood data for a 3-cell complex consists of a face and edge pair while only half of the edge data is used for 2-cell complexes. The geometric representation of the local neighborhood topology and ordering for 2-cell complexes can be considered a special case of 3-cell complexes. This paper, therefore, proposes a topological model for 3-D objects to resolve the problems in a different way, using a dual data structure.
A GIS represents the spatial relationship as topological relationships between the geometric entities in Cartesian coordinate system. There are several types of topological relationships, which are connectivity, adjacency, and inclusion. (Oosterom, 1993). In a 3-D GIS, the spatial relationships considered will be as the same as in 2-D GIS. In other words, the spatial relationships in a 3-D GIS are the topological relationships between the 3-D geometric entities. The geometric entities in a 3-D GIS include not only the primitive spatial two-dimensional objects such as point, line, and polygon, but also the primitive spatial three-dimensional objects such as a cube, sphere and cylinder. In current GISs, while the topological relations are represented between the same spatial units (layer-based GIS), the spatial relationships between different spatial units such as point-polygon relations are implemented by operations that may require specific tools in an information system. For instance, the point-polygon relations are required for inclusion queries. The spatial relationships represented in a 3-D GIS are the topological relationships between the spatial three-dimensional objects. Therefore, the 3-D GIS should represent the adjacency and connectivity relationships between 3-D objects because the inclusion relations can be derived from the geometric information by using spatial query operations such as a point/solid classification (Hoffmann, 1989).
This paper intends to represent the 3-D spatial objects in GISs by developing a 3-D topological data model. In order to simplify the complex spatial relationships between 3-D entities, this paper utilizes Poincar( Duality to interpret the topological terms by drawing a dual graph. The duality has been used in constructing the DIME (Dual Incidence Matrix Encoding) data structure or a Voronoi diagram from spatial triangulations (Lee, D.T., 1982), as well as in defining social spatial organization and transformation rules of architectural space (Plimpton, et al., 1987). In all of them, segments of a linear feature are recorded as a single record containing information about the immediate neighborhood of the feature in a symmetrical fashion. Duality depends upon the dimensionality of the space; duality in 2-D differs from duality in 3-D, but the general idea is the same. In 2-D, 0-cells (points) are dual with 2-cells (polygons): each polygon in the primal is replaced by a single point in the dual and vice versa. Because of this symmetry, a number of procedures apply equally to 0-cells and 2-cells in 2-D space even though they seem quite different (White, 1984).
The new topological data model, proposed for implementing 3-D spatial queries, is the Node-Relation Structure (NRS) constructed by the duality of 3-D graphs. The conceptual topological 3-D data model represents the topological relationships such as adjacency and connectivity between 3-D spatial objects with graph theory because the proposed data model consists of a set of nodes and a set of edges. Using graph methods, the sub-graph of the NRS is consolidated to a high-level node, called a Master_node in order to represent multi-level topological relations of 3D objects. A number of spatial indexing methods have been proposed and implemented in 2-D space. Therefore, the proposed 3-D GIS system will be integrated with the existing functions to retrieve the spatial data in 2-D space, and the proposed new spatial indexing methods for implementing 3-D spatial queries. This paper is organized as follows. Section 2 explains the properties of the Node-Relation Structure, including Poincare Duality, a graph theory and a hierarchical network model. The following sections describe the combinatorial data model and geometrical data model to represent the spatial relationships between 3-D features, and the implementation of 3D Node-Relation Structure System. Conclusions follow in the last section.
The proposed data model to represent the topological relationship between 3-D urban features is the Node-Relation Structure constructed by the duality of 3-complexes graphs (Lee and Kwan, 2000). The Node-Relation Structure represents the topological relationships between 3-D spatial objects in built environments (such as room units within a building) by a combinatorial data model based upon three basic elements: (a) Poincar( Duality; (b) graph theory; and (c) multi-scale data representations.
To simplify the complex spatial relationships between 3-D entities, this paper utilizes Poincare Duality to interpret the topological terms, where wherein a graph in primal space is transformed into a dual graph in dual space based upon certain processes. In 2-D, 2-cells, 1-cells and 0-cells in primal space are transformed into 0-cells, 1-cells, and 2-cells, respectively in dual space.
In 3D space, complementary cells are 3-cells - 0-cells, 2-cells - 1-cells, 1-cells - 2-cells and 0-cells - 3-cells. The spatial relations between 3-cells will be represented by the duality transforms of 3-cells - 0-cells and 2-cells - 1-cells. In other words, solid objects (3D objects such as a cube) in a primal model will be transformed into vertices in a dual model. The common face shared by two solid objects will be transformed into an edge (associated with the common boundary 2-cells in primal space) linking two vertices in the dual model. Figure 1 shows this duality transformation in 3D space. The solids s1 and s2 in the primal are replaced by vertices s1' and s2' in the dual, while the polygon f1 shared by solids s1 and s2 is transformed with the edge f1', which links two vertices s1' and s2' in the dual model and represents the topological relations between the 3D objects s1 and s2.
The key advantage of topological duality is that all topological properties are preserved under the duality transformation. The topological relationships between 3-D objects can be represented in dual space with sets of nodes and edges. The representation, called the Node-Relation structure, is based upon the combinatorial map, which has important characteristics such as topological transformations or homeomorphism.
Graph theory, a branch of combinatorial mathematics, has been gaining increasing popularity among researchers, scientists and engineers since earth 1970. This is due to the fact that it is a powerful tool in the understanding and solution of problems arising in the study of many large complex systems. The graph theory has been applied to a wide variety of subjects, ranging from Communications Networks, Chemistry and Operations Research to Geography, Social Sciencs and Architecture (Wilson & Beineke, 1979). The graphs, which are composed of only nodes and edges, have been used in defining social spatial organization and transformation rules of architectural space (Plimpton, et al., 1987) and applied to operations research to solve the linear problems such as flows, shortest paths, or invulnerable network design. The graph theory has also been utilized in constructing the DIME (Dual Incidence Matrix Encoding) data structure, and transport network data structures (i.e., transport, water, telecommunication). The DLC-3 (Digital Line Graph) structure and the TIGER file structure provide a fully topological data file designed for integration into Geographic Information Systems (GIS) based upon three components of nodes, lines and polygons, which are analogous to the 0-cells, 1-cells, and 2-cells in the TIGER file. In these structures also, the line is the basic element, which is modeled with the graph theory entities (Mark, 1990).
A graph G = (V, E) consists of two sets: a finite set V of elements called vertices and a finite set E of elements called edges (Weiss, 1994). Each edge is identified with a pair of vertices (v, w), where v, w in V. If the edges of a graph G are identified with ordered pairs of vertices, then the graph is directed, sometimes referred to as a digraph. Otherwise, G is called an undirected graph. The edge e = {v, w} is said to join the vertices v and w. The edge e = {v, w} is an edge of a graph G, if and only if v and w are adjacent vertices. In an undirected graph with edge e, w is adjacent to v and v is adjacent to w. The vertex v and edge e is incident, as is vertex w and edge e.
V = {v1, ......, vn}There are two ways to represent a graph using two-dimensional arrays. A graph G with vertex set V = {v1, v2, ..., vn} and edge set E = {e1, e2, ... , em} can be described by means of matrices. One such matrix is the n * n adjacency matrix A = [aij], where aij = 1 if (vi, vj) in E, and aij = 0 if (vi, vj) not-in E. Thus, the adjacency matrix of a graph G is a symmetric (0, 1) matrix having zero entries along the main diagonal. Another matrix is the n ( m incidence matrix B = [bij], where bij = 1 if vi and ej are incident, and bij = 0 otherwise (Chartrand & Lesniak, 1996).
An adjacency matrix is an appropriate representation if the graph is dense. If the graph is not dense - in other words, if the graph is sparse - more compact representation is an adjacency list representation (Weiss, 1994). For each vertex, we keep a linked list of all adjacent vertices. Because each edge appears in a list node, the number of list nodes is exactly equal to the number of edges. Adjacency lists are the standard way to represent digraphs. Undirected graphs can be similarly represented; each edge (v, w) appears in two lists, so the space usage essentially doubles. A common requirement in graph algorithms is to find all vertices adjacent to some given vertex v, and this can be done, in a time proportional to the number of such vertices which in tern are found by a simple scan down the appropriate adjacency list. It takes O(n) to find the right adjacency list.
In the adjacency list to represent a graph, each node of a graph has a list of its incident edges attached to it. Therefore, the Node-Relation structure constructed by the duality of 3-complexes graphs is modeled by graph theoretical concepts.
Since human abstraction of geographic space is characterized by a hierarchical multiple-level organization (Car and Frank 1994), hierarchical data structures and algorithms not only correspond closely to the hierarchical spatial reasoning of humans, but also provide effective means for representing the structure of geographic space and entities. Since geographic space in 3D can be organized in terms of more complex and hierarchical multi-level conceptual structures than in 2D space, specialized 3D GIS data models are required to represent how the levels are composed and related.
Transport networks have been modeled with graph theory concepts (Car & Frank, 1995; Mainguenaud, 1995). In order to model the road/highway network in route planning, hierarchical network structures have been used. A road network consists of places, road-segments, and levels (street classes). A place is a distinctive location, and a road-segment is a connection between two places. Higher-level connectors describe the major highway routes connected between cities, and lower-level connectors describe the local network to and from major route access points (Mainguenaud, 1995). In a graph as a mathematical representation of the road network, places are called nodes, road-segments are called edges, and levels are called sets of connected edges in the graph. The proposed Node-Relation structure is modeled using a hierarchical network structure for multi-scale representations. The connectivity relationships between 3-cells within a building is represented as sub-networks and the relationships between different levels of sub-networks.
The combinatorial data model of the Node-Relation Structure defined as a set of nodes with a set of edges (unordered pairs of distinct nodes) to represent the topological relations of the example object, shown in Figure 2(b).
From the Figure 2(a), one node set and two edge sets are defined, which construct a graph G = (V(G), E(G)) where V(G) = N and E(G) = EA, and a graph H = (V(H), E(H)) where V(H) = N and E(H) = EC. The graph G represents the adjacency relationships between 3-D objects of the building, and the graph H represents the connectivity relationships between 3-D units. One node set, N = {n1, n2, n3, ......, n12}, is an abstraction of the 3-D object units within the building. One edge set represents the adjacency relationships, EA = {ea1, ea2, ......, ean}, between the 3-D units, and the other set represents the connectivity relations, EC = {ec1, ec2, ....., ecm}. In the node set, the node n1 in the node-relation structure corresponds to the 3-D unit s1 of the building; node n2 to s2, node n3 to s3, and so on.
In the adjacency relation edge set (EA), the adjacency relations of 3-D object unit s1 are ea1 = (n1, n2), ea2 = (n1, n6) and ea3 = (n1, n7), and the relations of object s2 are ea1 = (n1, n2), ea4 = (n2, n3) and ea5 = (n2, n8). Because the node-relation structure is defined as an undirected graph, n1 is adjacent to n2 and n2 is adjacent to n1, which is the edge ea1 = (n1, n2) = (n2, n1). From this process, the set of edges can be defined (n = 22). The Node-Relation Structure with node set N = {n1, n2, n3, ...., n12} and adjacency relation edge set EA = {ea1, ea2, ea3, ....., ea22} can be described by means of matrices, which are an adjacency matrix and an incidence matrix.
In the connectivity edge set, the connectivity relation of s1 unit is ec1 = (n1, n6) and ec2 = (n1, n7), and the relations of 3-D object s6 are ec1 = (n1, n6), ec3 = (n2, n6), ec4 = (n3, n6), ec5 = (n4, n6), and ec6 = (n5, n6) because of the property of an undirected graph. The set of edges can be defined (m = 11), and are described with dark solid lines in Figure 2(b). In the same way, the Node-Relation Structure with node set N = {n1, n2, n3, ...., n12} and the connectivity relation edge set EC = {ec1, ec2, ec3, ....., ecm} can be described by means of matrices, which are an adjacency matrix and an incidence matrix.
From the two graphs defined above, it is known that the graph H = (V(H), E(H)) is a subgraph of the graph G = (V(G), E(G)) because V(H) is a subset of V(G) and E(H) is a subset of E(G). In other words, the graph G representing adjacency relationships is a supergraph of the graph H representing connectivity relationships. In this case, because of V(G) = V(H) = N, graph H is called a spanning subgraph of graph G.
The proposed 3D GIS data model can be integrated with current GIS functions for retrieving spatial data in 2D, and for implementing 3D spatial queries using new spatial indexing methods in Urban Information Systems.
In order to implement 3D spatial queries in the NRS based upon shortest path operations, the combinatorial network model (logical network) representing the connectivity relationships between 3D spatial objects needs to be transformed into the geometric network model as seen inFigure 1. In order to transform the topological model (NRS) of a building (Fig. 3(b)) to the geometric network model (Fig. 3(c)) including feature coordinates, the nodes n6 and n12 representing a hallway within the building are converted into linear features (edge e1 and e2). Then by connecting the nodes representing rooms into the edges the NRS is reconstructed as a collection of network features that comprise a connected system of edges and nodes. In other words, the nodes n6 and n12 in Fig. 3(b) are considered as consolidated Master_Nodes, which represent a sub-graph of the new constructed NRS (Fig. 3(c)). One key step in the process is to identify line segments from a simple polygon (a hallway in this case) instead of an abstraction to a node in the combinatorial network model. The same problem in pattern recognition has been addressed as skeletonization or medial axis transformation (MAT), a technique used to describe a simple polygon proposed by Blum (Blum, 1967). Using the reconstructed geometric network model generated after the transformation, therefore the complex topologic relations among 3D spatial objects can be analyzed through path searching algorithms.
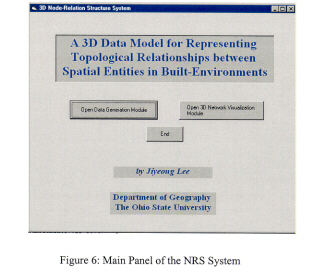
This section focuses on the implementation of 3D Node-Relation Structure System whose algorithms are developed in the previous chapter. The system is not designed as a stand-alone system but as a module to be a major component of 3D GISs. The system works with the existing GISs, as well accesses to the existing system to utilize the specific functionality of the external systems within the application. In other words, the proposed system is designed by combining new developed internal functions of 3D GIS with the external existing GIS functions (especially, 2D GIS functions such as spatial query) or with other systems such as a database system. The components of the system built in the Visual Basic development environment are a 3D GIS Modular at the center of the system, a Relational Database System to be accessed by Open Database Connectivity (ODBC) / ActiveX Data Object (ADO), an existing GIS software to be accessed by Object Linking and Embedding (OLE) / ActiveX controls (such as ArcInfo Open Development Environment (ODE)), and other program routines stored in Dynamic Link Libraries (DLLs). The 3D GIS Modular is developed to represent the spatial compound objects, to build a combinatorial and geometric network model representing the spatial relations of the objects in a three dimensional space, and to analyze the complex connectivity relationships among 3D objects through path searching algorithms.
The NRS system consists of two major modules, the Data Generation Module (DGM) and 3D NRS Implementation Module (3D-NRSIM) as seen in Fig. 5. The DGM reads an input data, a graph (G = (V(G), E(G)) representing 2D geometric features of spatial entities in urban environments, and generates 3D geometric network model representing spatial relationships between 3D spatial entities based upon the Node-Relation Structure (NRS). The 3D-NRSIM displays the 3D geometric network model and analyze the connectivity relationships among 3D entities through the modified Dijkstra's Algorithm.
The DGM system consists of four components: 1) ArcInfo ODE Applications, 2) Straight-Medial Axis Transformation Module, 3) 2D Node-Relation Structure Generation Module, and 4) 3D Node-Relation Structure Generation Module. The four modules can be accessed through the DGM interface. Each module can be directly accessible horizontally except the 2D NRS Module. Prior to accessing the module, the S-MAT module should be implemented because the 2D NRS can be generated based upon the S-MAT representing a hallway polygon. The principle functions of the four modules are summarized briefly as follows;
* ArcInfo ODE Applications: To define adjacency relationships between 3D objects using polygon topologies and polygon overlay functions, to abstract 3D objects (3-cells) to nodes (0-cells), and to define a graph G representing a hallway polygon.
* Straight-Medial Axis Transformation Module: To define a linear feature explaining a simple polygon (a hallway).
* 2D Node-Relation Structure Generation Module: To project and connect nodes defined in ArcInfo ODE Applications into the S-MAT defined in the previous module.
* 3D Node-Relation Structure Generation Module: To combine the set of graphs, 2D NRSs, with a graph representing vertical relationships between 3D objects and a graph representing road networks.
As previously mentioned, there are two major modules and four sub-modules in the system. Even though most modules can be implemented independently because they use input ASCII data files and generate output files, the whole process is executed in sequence.
The purpose of the DGM is to define the topological relationships, adjacency and connectivity relationships, between 3D spatial entities in built-environments, for representing the relationships in 3D Node-Relation Structure. The 3D NRS is generated by Poincar� Duality to simplify the complex spatial relationships between 3D entities such as room units within a building. As mentioned in the previous chapter, because the NRS is utilized by graph theory the input data used in the module and the output data are represented as graphs G = (V(G), E(G)), which are sets of nodes and sets of edges. The graphs are saved in two ASCII text files: one is for a set of nodes (node_id and x,y,z-coordinates), and the other is for a set of edges (edge_id, from_node and to_node).
As seen in Figure 7, the Data Generation Module has an interface to access four sub-modules, which are ArcInfo ODE Applications, Straight-Medial Axis Transformation Module, 2D Node-Relation Structure Generation Module, and 3D Node-Relation Structure Generation Module. Also, the module has a function to read and display input files (node coordinate data and edge data) and to transfer them into ASCII data files to generate GIS coverage in ArcInfo. The Figure 7 shows the result after executing the function. By using GENERATE command in ArcInfo, the GIS coverage is generated. The polygon coverage has topological data by executing CLEAN commend and each polygon has a label, which is a node abstracted from the polygon in the NRS, by using CREATELABELS and CETROIDLABELS commends in ArcInfo.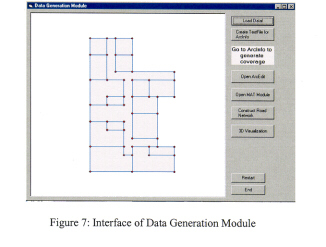
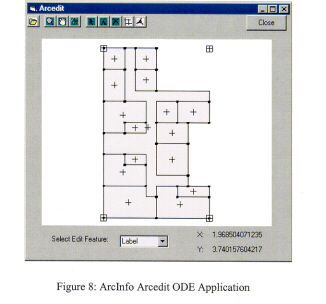
The ArcEdit module seen in Figure 8 is an ArcInfo program for editing as a collection of custom Activex controls, providing an application programming interface (API) to all the functionality available at the ARCEDIT command lines (Esri, 1997). After editing the polygon coverage in the module, two ASCII data files are generated by performing UNGENERATE command in ArcInfo. One data file contains a list of nodes (G = V(G)) abstracted from polygons (rooms) in the coverage, and the other data file contains a list of edges representing a hallway polygon.
The Medial Axis Transformation form seen in Figure 9 is one of the key components of the NRS system. From the interface of the form, three major modules are implemented, which are Straight MAT Module, 2D NRS Generation Module and 3D NRS Generation Module. From the Straight MAT Module, the key step is implemented in constructing a geometric network data model, which is to identify the medial axis by using a one-dimensional structure that represents a two-dimensional shape. Figure 9 shows the straight medial axis for the hallway polygon defined in the previous process.
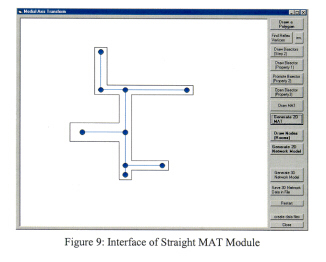
In order to construct the straight medial axis for a simple polygon, seven steps are performed in sequence as explained in the previous chapter. The first step defines the type of vertex in the polygon, reflex or convex vertex by calculating edge-vector cross product in a counterclockwise order. After defining reflex vertices in the polygon, the 2D MAT is generated either by clicking the 'Generate 2D MAT' button, or by clicking several buttons in sequence to look over the results of each step.
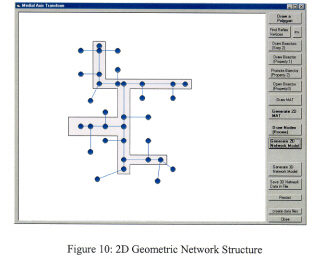
With the 2D MAT, the 2D geometric network is constructed by performing 2D NRS Generation Module. Each node representing 3D spatial units generated in ArcInfo ODE Application Module is projected and connected into the 2D MAT if there is a connectivity relation, as the output is seen in Figure 10. The 2D NRS is a network representing connectivity relationships between 3D objects (rooms) on a floor within a building. The 3D NRS, therefore, is constructed by combining floor 2D NRSs and a vertical NRS representing connectivity relationships in vertical direction. The 3D NRS is a network representing connectivity relationships between 3D object within one building.
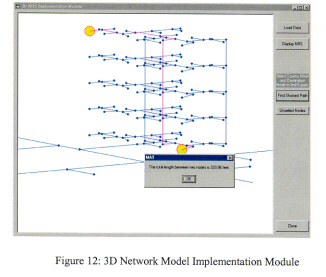
The 3D NRS Implementation Module has two sub-modules, which are 3D NRS Visualization Module and Spatial Access Implementation Module. In the 3D NRS Visualization module, the input data files are loaded as seen in Figure 11.
The 3D geometric network defined in the previous module is described as a graph N = (V(N), E(N)). Given this representation, the modified Dijkstra's algorithm for finding shortest paths in graphs is applied to the tasks of spatial accesses in the 3D NRS. Figure 12 shows the optimal shortest path and the total length between a source node and a destination node, which are selected by clicking nodes in the display.
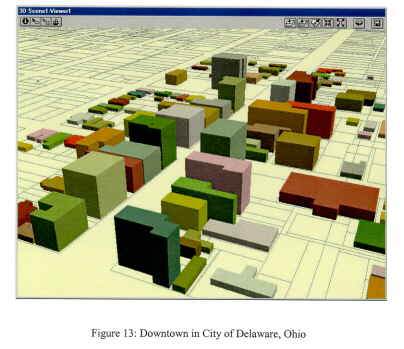
The study area for this experimental case is a downtown area in the City of Delaware, Ohio, approximately 20 miles north of Columbus. The City of Delaware is the county seat of Delaware County and is situated close to the center of the county. The county has a population of about 110,000 and has experienced a 64 percent growth rate during the past decade. In 1994, the county auditor initiated the Delaware Appraisal Land Information System (DALIS) project to create a comprehensive cadastral database to achieve more equitable appraisals. The database is comprised of several layers such as political boundaries, parcels, road center lines, hydrology and topography. Because the given data sets are macro-level data managed in 2D GIS systems comparing to the required data in this study, several data should be created such as building footprint data and building floor layout data. The building footprint data are digitized on the screen based upon aerial photography, whose cell size is one foot by one foot on the ground, and the Z values of the buildings are corresponded to the number of floors in the buildings. Figure 13 shows a portion of the downtown displayed in 3D Viewer of ArcView 3D Analyst.
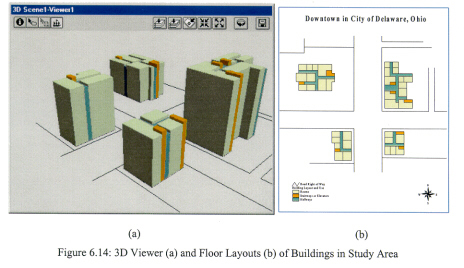
The building floor layout data are collected by field survey because floor plan hardcopy maps were not available. For the purpose of this study, four buildings including the County Courthouse and surrounding office buildings are used. The 3D view and building floor layouts of the buildings in the study area are shown in Figure 14. In the floor layout, the space use is classified into three types: room units, hallways and stairways.
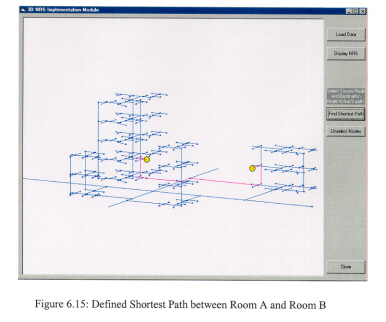
With the given data, the 3D geometric network model (Gi = (E(Gi), E(Gi))) representing connectivity relations of 3D entities for a building i is generated by implementing Data Generation Module in this system. In the DGM module there is a function to construct a road network NRS (R = (V(R), E(R))), which is a combined network with a road network and connectivity relations between roads and 3D NRS networks for buildings. To construct a 3D NRS network model for a study area, the 3D geometric network model (Gi = (E(Gi), E(Gi))) and the road network NRS (R = (V(R), E(R))) are combined using a UNION operation because each network graphs are equivalence classes. The combined network describes the connectivity relationships not only between 3D objects within a building but also between buildings within the study urban area. Figure 15 shows the 3D NRS displayed in the 3D NRS Implementation Module, and the shortest path between a source node in Building A and a destination node in Building B analyzed by the path searching algorithm.
This paper implemented the NRS by designing the NRS system as a module to be a major component of 3D GISs in the Visual Basic development environment. The NRS system consists of two major modules, which are Data Generation Module (DGM) and 3D NRS Implementation Module (3D-NRSIM). The DGM reads an input data, a graph (G = (V(G), E(G)) representing 2D geometric features of spatial entities in urban environments, and generates 3D geometric network model representing spatial relationships between 3D spatial entities based upon the Node-Relation Structure (NRS). The 3D-NRSIM displays the 3D geometric network model and analyzes the connectivity relationships among 3D entities through the modified Dijkstra's Algorithm. The DGM consists of four sub-modules, which are 1) ArcInfo ODE Applications, 2) Straight-Medial Axis Transformation Module, 3) 2D Node-Relation Structure Generation Module, and 4) 3D Node-Relation Structure Generation Module. The 3D NRS Implementation Module has two sub-modules, which are 3D NRS Visualization Module and Spatial Access Implementation Module. Finally, the chapter demonstrates the use of the Node-Relation Structure system for analyzing the complex connectivity relationships among 3D objects in built-environments through the modified Dijkstra's algorithm.
Blum, H., 1967, A Transformation for Extracting New Description of Shape. Symp. Models for Perception of Speech and Visual Forms, pp. 362-380. (Cambridge, MA: MIT Press).
Car, A. and Frank A., 1994, General Principles of Hierarchical Spatial Reasoning - the Case of Wayfinding. In Proceedings of the 6th International Symposium on Spatial Data Handling (UK: Scotland), pp. 646-663.
Car, A. and Frank, A., 1995, Formalization of Conceptual Models for GIS Using GOFER, Computer Environment and Urabn Systems, 19 (2), pp.89-98.
Chartrand, G. and Lesniak, L., 1996, Graphs & Digraphs, (New York: Chapman & Hall).
Hoffmann, C. M., 1989, Geometric and Solid Modeling: An Introduction (San Mateo, CA: Morgan Kaufmann Publishers, Inc.)
Lee, D.T., 1982, Medial Axis Transformation of a Planar Shape, IEEE Transactions on Pattern Analysis and Machine Intelligence, PAMI-4 (4), pp.363-369.
Lee, Jiyeong and Kwan, M-P, 2000, A 3-D Object-Oriented Data Model for Representing Geographic Entities in Built-Environments, presented in 96th AAG at Pitts., PA, USA.
Mark, R. W., 1990, The TIGER system: automating the geographic structure of the United States Census, in Introductory readings in Geographic Information Systems, edited by Peuquet, D. and Marble, F., (New York: Taylor & Francis).
Mainguenaud, M., 1995, Modeling the network component of geographical information systems. International Journal of Geographical Information Systems, 9, pp.575-593.
Oosterom, Peter van, 1993, Reactive Data Structures for Geographic Information Systems, Spatial Information Systems, (UK: Oxford University Press).
Pigot, Simon, 1992, A Topological Model for a 3D Spatial Information System, Proceedings of the 5th International Symposium on Spatial Data Handling, Charleston, South Carolina, pp. 344-359.
Plimpton, C. and Hassan, F., 1987, Social space: a determinant of house architecture, Environment and Planning B: Planning and Design, 14, pp. 437-449.
Weiss, M. A., 1994, Data Structures and Algorithm Analysis in C++, (New York: Benjamin/Cummings).
White, Marvin, 1984, Tribulations of Automated Cartography and How Mathematics Helps, Cartographica, 21, pp. 148-159.
Wilson, R. and Beineke, L., 1979, Applications of Graph Theory, (New York: Academic Press).