Thomas M. Falke and Tara L. Peterson
Geographic Resources Center
University of Missouri-Columbia
An Analysis of Census Geography
Abstract
This presentation examines the census geographies between the 1980, 1990, and 2000 censuses in order to assess the accuracy and validity of past census procedures and to evaluate present redistricting practices. The 1980 census enumeration district boundaries of the counties in Missouri were digitized into ArcEdit off a mylar analog map series called, "Missouri 1980 Map Series." This spatial coverage of the 1980 census was then compared in ArcInfo to digital coverages of the 1990 census and the 2000 census files. The results of this study will show the spatial differentiation of the past 3 decennial census counts using ArcEdit and ArcInfo. Utilizing this GIS technology prompted a comparison of census enumeration districts that can contribute to techniques for improving the spatial analysis of such areas.
Introduction
The State of Missouri was one of the few states during the 1980 census that did not make the transition to the tract and block group system of classifying census data. Instead, Missouri decided to continue using enumeration districts to organize their census data. Enumeration district areas are much larger and the data contained within them more general than the tract and block group areas and data used by other states in 1980 and in the later 1990 and 2000 Missouri censuses. Therefore, the use of enumeration districts in the 1980 Missouri census makes analysis of the data for that census alone difficult. Multi-census analyses become even more complicated when trying to compare the Missouri 1980 census to 1990 and 2000 censuses. One of the greatest hindrances to performing these types of analyses is the way in which the data for the 1980 Missouri census is stored. Census data for the 1990 and 2000 censuses are available in digital formats and are readily available to the public via the world wide web, while the 1980 Missouri census data is stored on two different paper media, making analysis physically difficult to perform and hard for the general public to understand.
Currently, the Missouri 1980 census data can be found in the Missouri 1980 Census Map Series and the Missouri Master Area Reference File. The map series shows the census tracts and enumeration districts within each Missouri county. These maps are made of large mylar sheets and must be pieced together in order to form complete counties. Also, boundary markings on the maps have no legend. Someone unfamiliar with census enumeration district maps would have a hard time telling if a line on the map represented a township, tract, city, or enumeration district boundary. Another problem with the maps is that there is little or no distinction between identification labels for enumeration districts and tracts within these different boundary lines. The nature of the storage media and the symbolization used hinder understanding of the maps.
The Missouri Master Area Reference File accompanies the Missouri 1980 Census Map Series. This book classifies each polygon shown on the maps through a hierarchy of attributes that ranks from the minor civil division number, to the place number, to the township name, to the tract number and finally to the enumeration district number. Along with these identifying attributes, the population and housing totals for each polygon are listed. In order for any kind of analysis to be done the maps and reference file data must be used together. Their current form as separate paper media makes this task tedious and difficult. This can especially be seen when trying to look at trends between the 1980 and following censuses.
With these problems in mind, it has been the goal of this project to combine the map series and reference file data and to make the Missouri 1980 census data available digitally. By creating a digital format, the maps and data for each Missouri county and the state as a whole can be viewed in their entirety with the corresponding data. By not having to piece together areas with the mylar maps and then looking up the data in the reference file, analysis of the Missouri 1980 census by itself will be more efficient. This new format will also be more compatible to the digital formats of the 1990 and 2000 censuses, allowing for easier comparison and analysis.
Background
A digital database of county coverages containing the enumeration district and tract data from the Missouri 1980 census was created using Esri’s ArcInfo 8.0. ArcInfo’s capabilities provide means for digitizing and creating geographic topology. Digitized polygons represent enumeration districts or tracts from the Missouri 1980 census. Once these areas were digitized, enumeration districts and tracts were coded with specific attributes during editing.
Data sources for the project included: the Missouri 1980 Census Map Series, the Missouri Master Area Reference File, and the U.S. Census TIGER98 file. The Missouri 1980 Census Map Series is organized by county and shows boundaries, census areas, and their labels. The Missouri Master Area Reference File of Missouri expresses population and housing totals for 1980 census enumeration district and tract levels. The U.S. Census TIGER98 file is a line coverage created by the U.S. Census Bureau containing features such as roads, streams and city boundaries.
Methods
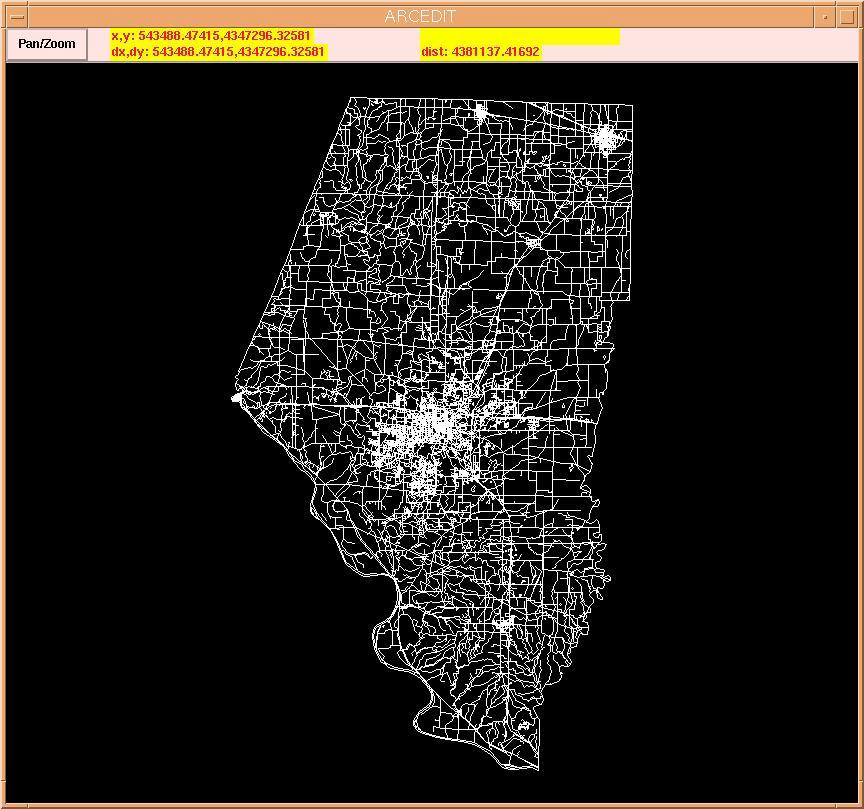
Working county by county, the 1980 mylar map series of Missouri enumeration districts and tracts was digitized into a digital database. The first step in this process for each county was to create the arc coverage for the 1980 enumeration districts. TIGER98 files were used as the base maps for the coverages. They included many of the same lines found on the mylar maps, but in digital format so lines could be digitized more efficiently. ArcEdit was used to digitize and edit the coverage of enumeration districts and tracts. The Boone County, Missouri coverages are used to demonstrate this process since it includes both densely populated urban areas and less densely populated rural areas. As such, the county contains both tract and enumeration district areas. Below is the TIGER98 file of this county.
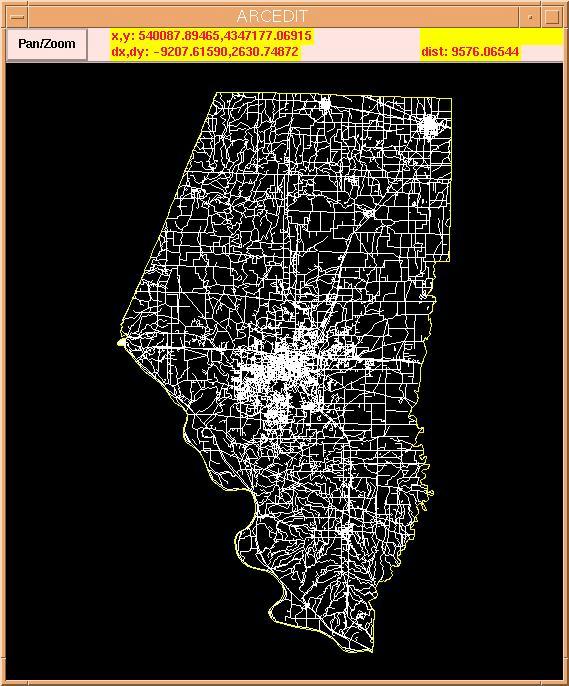
TIGER98 files were used to create the outline of each new county coverage, which was named "enumdist80." The lines constituting the outline of the county were selected from the TIGER98 file to create the 1980 enumeration district coverage. These lines are highlighted (yellow) below. Once selected, the lines were copied into the new "enumdist80" coverage. This outline provides the framework for the enumeration district coverage and is the first step in the digitizing process.
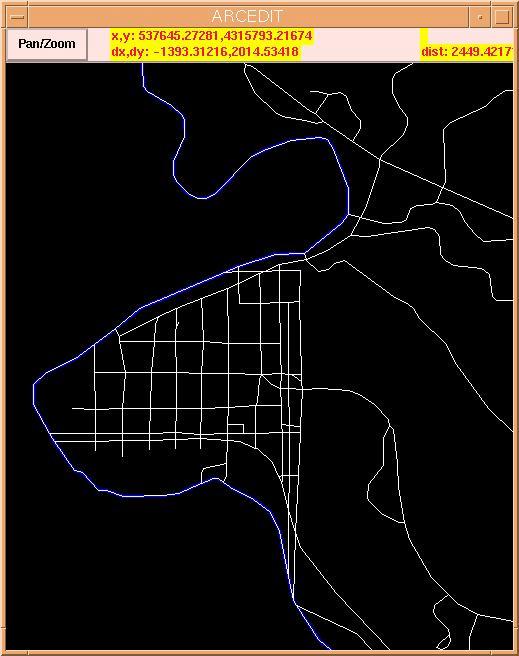
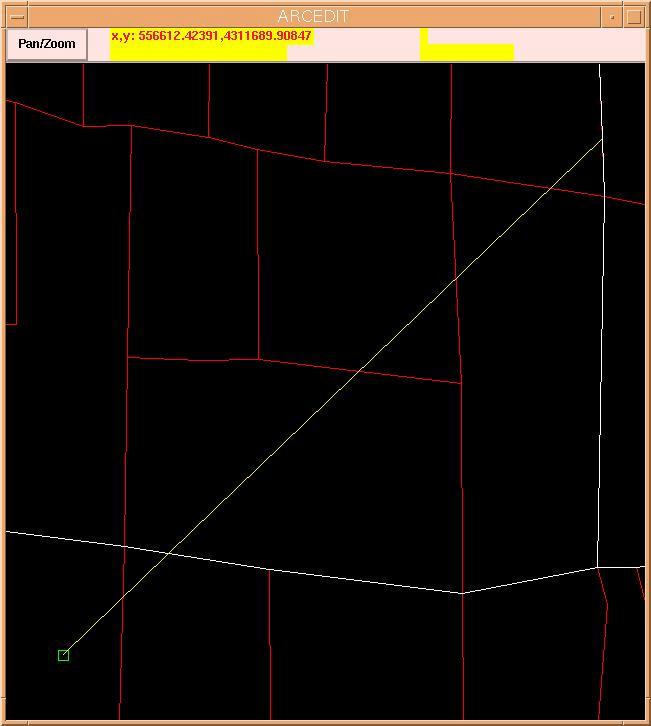
After creating the county outline of the "enumdist80"coverage, the next step was to add the remaining enumeration district and tract lines. Rocheport, a city in Boone County, is used to show this step of the process. Here the "enumdist80" coverage is shown in blue and is overlaid by the TIGER98 file shown in white.
Lines from the TIGER98 coverage that corresponded directly to those on the mylar maps were selected (yellow)
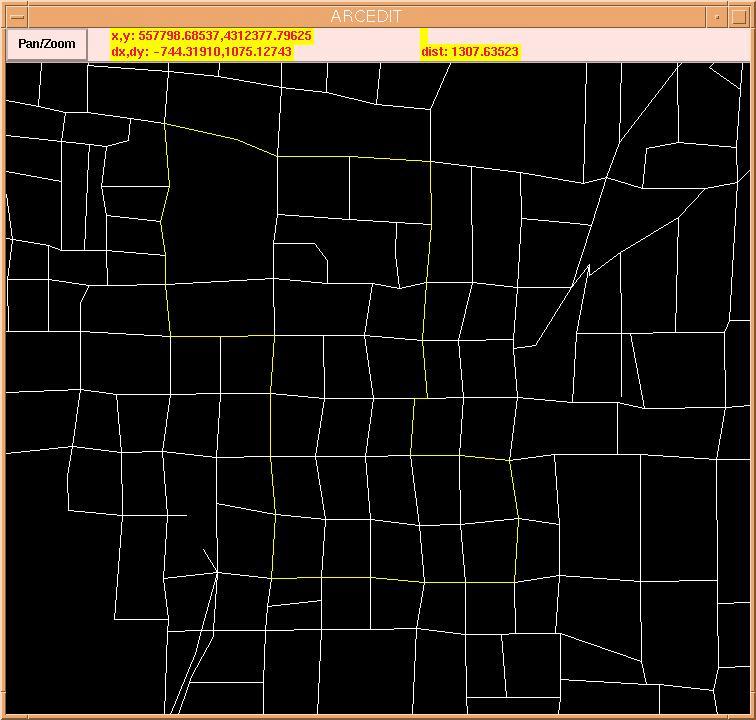
and transferred into the newly created "enumdist80" coverage (white).
Lines that existed on the mylar maps but not on the TIGER98 files were digitized into the "enumdist80" coverage. The TIGER98 files were used as a reference to approximate where lines should be placed, keeping the coverage as close to the original mylar maps as possible.
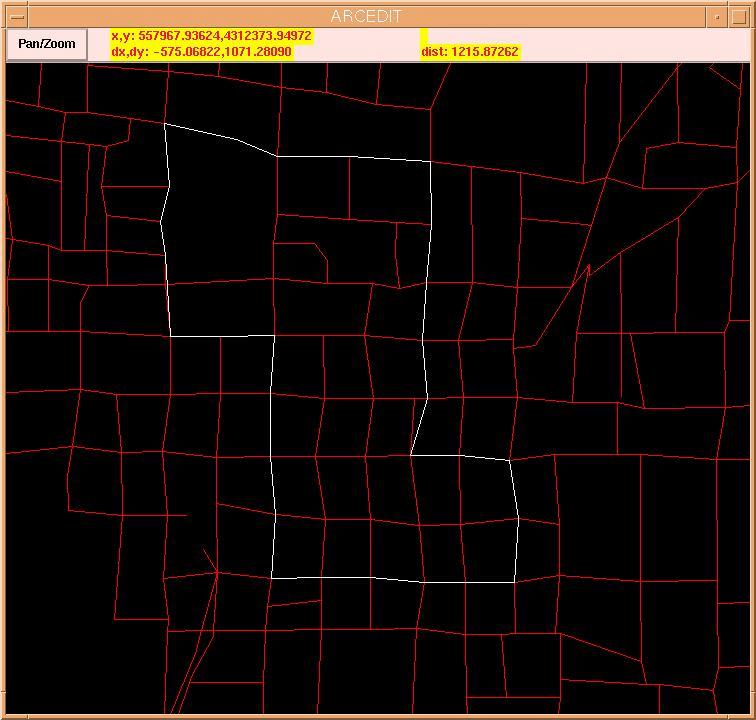
Here, the completed "enumdist80" (white) coverage can be seen over the TIGER98 coverage (red) for Boone County.
Finally, the TIGER98 file can be taken away and the completed "enumdist80" coverage for Boone County can be seen alone. Note the smaller tracts around the city of Columbia in the central portion of the county and the larger enumeration districts surrounding the city in the more rural areas.
Through this county by county process, the 1980 mylar map series was transferred to a digital format.
After transferring the 1980 mylar map series to the digital format, each enumeration district and tract was assigned it’s specific census attributes. These attributes are recorded in the Missouri 1980 Master Area Reference File. The ordering of these attributes in the attribute table remained uniform so that the separate county coverages can be merged to create a statewide coverage.
Each polygon contained this table which included the following attributes in this order:
-state #
-county #
-enumeration district #
-minor civil division #
-place #
-township name
-place name (names of cities)
-tract #
-houses per tract
-tract population
-houses per enumeration district
-enumeration district population
The only attributes that are not distinguished by a number are the township name and the place name.
Limitations
Polygons within the coverage do not always possess every attribute. Counties in the 1980 Missouri census could be organized three different ways. They could use only enumeration districts, only tracts, or a combination of the two. St. Louis City and Jackson County only used tracts, while other Missouri urban counties used tract and enumeration districts and many rural counties used only enumeration districts.
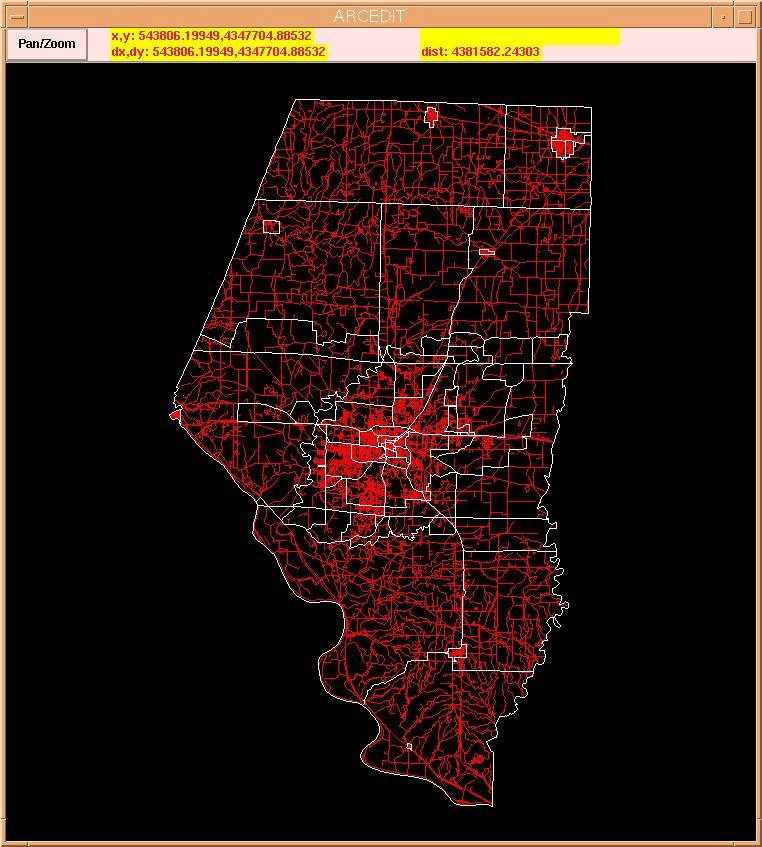
Problems arise in the data attributing process when non-contiguous polygons share identical attributes, which means that many separated polygons make up the total remainder area listed in the reference file. This often happens in remainder areas around cities. Enumeration districts and tracts are divided as cities grow and areas gain in population, resulting in convolution. St. Louis County demonstrates this phenomena. The enumeration district coverage is shown in white and the TIGER98 coverage is shown in red.
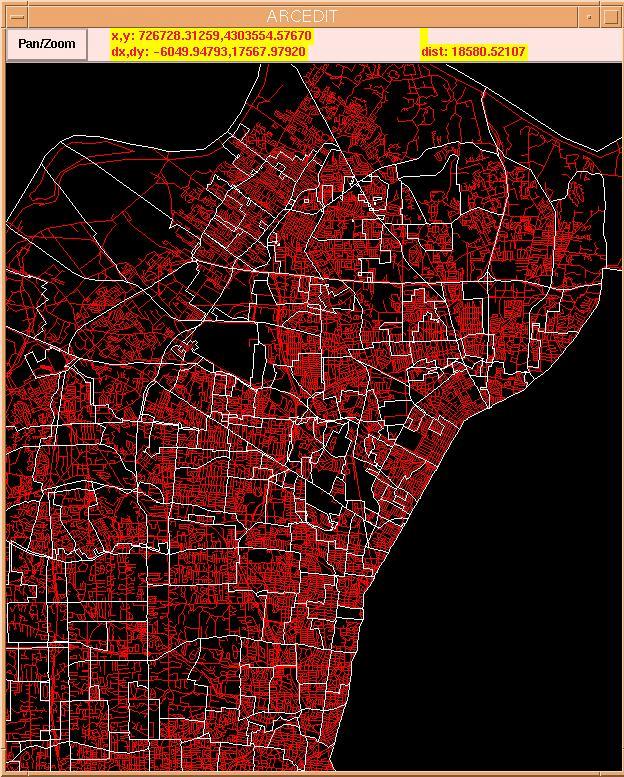
Not only are these enumeration districts hard to understand visually, but the corresponding data can not be well represented. Such non-adjacent polygons of each enumeration district must be given the exact same attribute information. So, five separate polygons in remainder areas of a city will all state that 505 houses and 1100 people are located in each polygon. However, the 505 houses and 1100 people are actually the total for the five remainder areas combined. Thus, this sharing of the attribute set throws off housing and population totals for the "enumdist80."
Currently, the 1980 "enumdist80" coverages are being edited and those polygons sharing attribute sets pinpointed. Once these areas are identified, the data will be aggregated so that the coverages will match the housing and population totals found in the reference file. The county coverages will then be merged to form a statewide coverage.
Conclusion
The creation of a digital database of the 1980 census coverages for Missouri counties allows for easier use of the Missouri 1980 census and in multi-census analyses with 1990 and 2000 censuses. With the Missouri 1980 census in digital format, users will be able to select specific locations in Missouri and easily obtain the attribute totals, just as they now can when using coverages of the 1990 and 2000 censuses.
This diagram showing the digital 1980, 1990, and 2000 census coverages for Boone County shows the great differences in how data was organized during Missouri’s 1980 census.
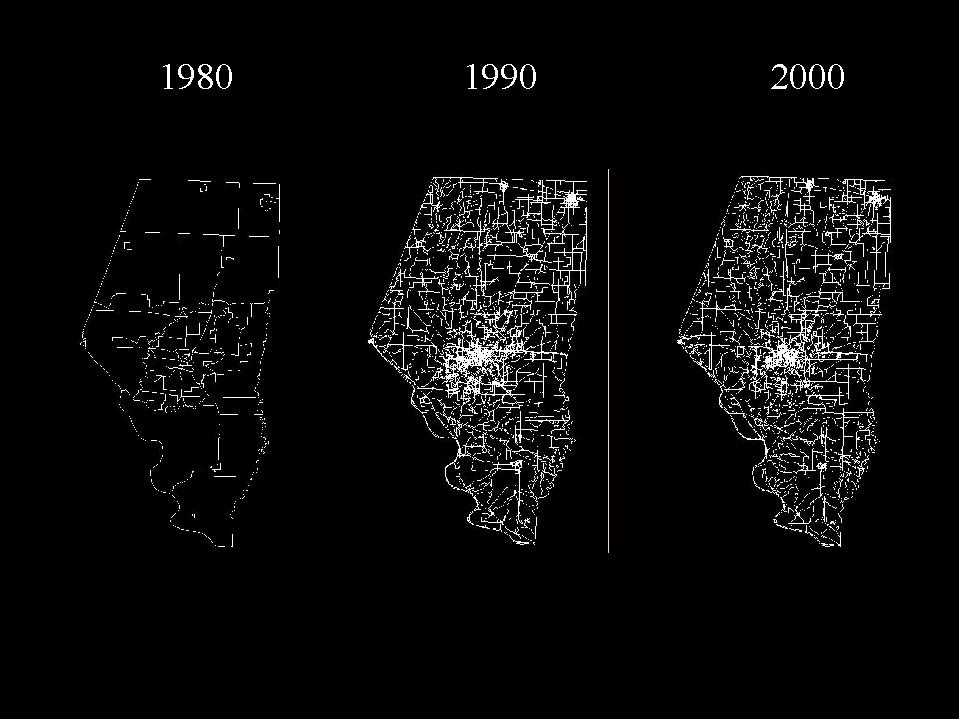
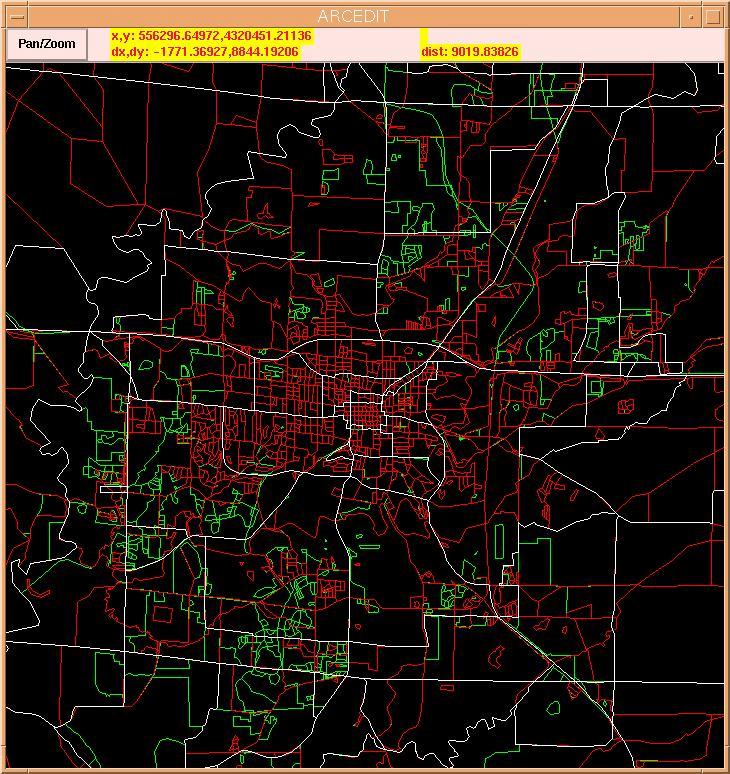
Now, with the Missouri 1980 census in a digital format these differences can be looked at even closer. One way of doing this closer analysis is to stack the 1980 (white), 1990 (red), and 2000 (green) census coverages on top of each other.
Along with the digital statewide coverages from 1990 and 2000, the 1980 statewide coverage will allow for the analysis of population flows in Missouri for the last twenty years. These are just some potential uses of these new 1980 census coverages. Once completed, the coverages will be publicly available on the Missouri Spatial Digital Information Service website (msdis.missouri.edu).