This paper describes using GIS to pilot test the proposed definition of unusually sensitive areas (USAs) in preparation for final rulemakings that affect the pipeline industry. The Department of Transportation’s Office of Pipeline Safety (OPS) and the American Petroleum Institute (API) jointly sponsored the pilot study that tested the process of identifying drinking water and ecological resources that are potentially more susceptible to long-term, irreversible, or irretrievable damage from a pipeline accident. This paper discusses the GIS data management techniques employed during the pilot test, the major problems encountered, and the solutions applied by the approach.
This paper describes the methodology used to pilot test the definition of unusually sensitive areas (i.e. areas unusually sensitive to environmental damage from a hazardous liquid pipeline release). The Office of Pipeline Safety (OPS) and the American Petroleum Institute (API) jointly sponsored the pilot test. Results from the 13-month effort were presented at a Technical / Peer Review Workshop in Washington, D.C. on April 27-28, 2000.
The Technical / Peer Review Workshop was the culmination of a significant effort in both scope and duration. The USA identification model is a tribute to the perseverance and teamwork of dedicated OPS staff, the members and supporters of the API USA Working Group, various federal and state agencies, environmental associations, academia, and the technical contractors, MFG, Inc, and Research Planning, Inc.
In December 2000, two rulemakings were promulgated regarding USAs: "Areas Unusually Sensitive to Environmental Damage" and "Pipeline Integrity Management in High Consequence Areas (Hazardous Liquid Operators with 500 or More Miles of Pipeline)" (49 CFR Parts 195). Several more pipeline safety rulemakings pertaining to the protection of USAs are expected to become final later in 2001 and early 2002.
Some modifications and additions to the USA identification model have been made as a result of the peer review process, but the preponderance of the pilot-tested model as described in this paper was adopted and is currently being implemented to identify USAs nationwide. USAs for many states have already been identified and are available for viewing and download on the National Pipeline Mapping System (NPMS) website at http://www.npms.rspa.dot.gov/.
This paper describes a standardized model that can be utilized for the definition of unusually sensitive environmental areas (USAs), as mandated by the Accountable Pipeline Safety and Partnership Act of 1996 (49 U.S.C. 60109) (APSPA). A proposed data acquisition process is also discussed. The model is based upon best available human health and environmental conservation methods, given the limitations of currently available environmental data. The model is the result of an extensive process of scientific investigation, peer review, and public review jointly conducted by the Office of Pipeline Safety (Department of Transportation / Research and Special Programs Administration) and the USA Working Group of the Committee on Environment, Health, and Safety of the American Petroleum Institute (API). As such, it represents a robust and defensible methodology that can be utilized in compliance with APSPA and other related regulations for the design and operation of hazardous liquid pipelines.
This methodology was designed to meet the intent of Congress in providing a definition of USAs and, further, in providing a viable process by which the Office of Pipeline Safety (OPS) may identify these areas.
In the Pipeline Safety Act of 1992 (Public Law 102-508), Congress established various regulatory requirements for the hazardous liquid pipeline industry. One of those requirements outlined in 49 U.S.C. Section 60109 entitled "High-density population areas and environmentally sensitive areas" established criteria for identifying each hazardous liquid pipeline facility and gathering line located in an area that the Department of Transportation (DOT) Secretary, in consultation with the Environmental Protection Agency (EPA), describes as unusually sensitive to environmental damage if there is a hazardous liquid pipeline accident. Congress then instructed DOT to consider including such areas as earthquake zones, freshwater lakes, rivers and waterways, areas of likely groundwater contamination, river deltas, and other areas subject to soil erosion or subsidence from flooding or other water action.
The recently enacted APSPA further clarified Congressional intent by specifying "the Secretary shall consider areas where a pipeline rupture would likely cause permanent and long-term environmental damage…"Congress then specifically instructed the DOT to consider including locations near pipeline rights-of-way that are critical to drinking water or identified as critical wetlands, riverine or estuarine systems, national parks, wilderness areas, wildlife preservation areas or refuges, wild and scenic rivers or critical habitat areas for threatened and endangered species.
The following approach was used to comply with APSPA:
- Establishes a definition of USAs that is based upon Congressional intent to focus upon environmentally significant areas in the United States;
- Identifies a viable source of uniform data available to all pipeline operators; and
- Provides a standard process to identify, locate, and map USAs and report the location of the USAs to the user community (e.g. pipeline operators, government agencies, public, etc.).
It was determined that the mapped USAs would be added to the National Pipeline Mapping System (NPMS, see Section 2.3). This would allow the user community to view USAs and their relationship to pipelines.
Tasked with the responsibility for describing USAs, DOT initiated a consultative process with federal and state regulatory agencies, the regulated community, and the public. These consultations provided an applicable USA definition, guiding principles for the identification of USAs, and a focus for the resource categories most suitable for consideration as USAs.
For the purposes of compliance with the APSPA, USAs are characterized as:
Those definable geographic areas that contain drinking water or ecological resources that by their character are irreplaceable and may be subject to irreparable and irreversible injury or irretrievable loss, if they are exposed to the effects of an accidental hazardous liquids release.
There are an abundance of natural resources afforded varying levels of protection under a variety of state and federal laws. These laws protect such diverse geographies as federally owned lands (e.g. parks, forests, and reserves), ecological regions (e.g. wetlands, estuaries, and river systems), water bodies (e.g. lakes, rivers, drainage basins, and groundwater aquifers), cultural resources, and locations of individual species occurrences (e.g. threatened and endangered species). USAs do not incorporate in their entirety all federally protected natural resource areas. Rather, the term "unusually sensitive areas" represents a subset of these resources that may be subject to "permanent and long-term environmental damage" and, therefore, is consistent with the language of the APSPA.
The USA definition focuses upon those environmental resources that are potentially at risk of such damage and are essential to the protection of human health and the continued viability of ecological resources. Thus, application of the USA definition, as it is described in this paper, specifically identifies drinking water resources that are critical to the uninterrupted delivery of consumable water to public water systems (PWS) and areas critical to the survival and viability of threatened, endangered, and imperiled biological species.
A Geographic Information System (GIS) is software that combines the query and statistical analysis tools of a relational database with the spatial analysis capabilities and visual advantages offered by digital maps. A GIS enables simultaneous manipulation of all types of information that have a common link through geography. The information is stored in thematic layers that can be easily overlaid and analyzed through their relative location on the earth’s surface. ArcInfo (version 7.2.1) was selected to pilot test the definition of USAs. The GIS software package is a product of the Environmental Systems Research Institute, Inc. (Esri), Redlands, CA.
The goal of the pilot project was to test the definition of drinking water and ecological USAs using GIS to ensure that a standardized process is employed that effectively identifies these sensitive resources on a nationwide scale. The pilot test focused on three states: California, Louisiana, and Texas. These study areas were chosen because of the biodiversity of their natural resources and the sizeable number of hazardous liquid pipelines located within each state.
Adequate Alternative Drinking Water Source: A source of water that currently exists, can be used almost immediately with a minimal amount of effort and cost, will meet the consumptive and hygiene requirements of the existing population of impacted consumers, involves no perceptible change in water quality, and is temporary (until a long-term alternative can be put in place, if necessary).
The intent is that, in the event of a spill which threatens to shut down a water intake, there would be a surface water intake(s) in another location(s) that would not be in the threat zone, or there would be groundwater sources that could be utilized during the threat period, or there would be other drinking water systems that could temporarily provide drinking water in place of the impacted system.
Aquatic or Aquatic Dependent Species: Species that spend a significant portion of their lives, a life stage, or important life-history activity within, upon, or regularly in contact with aquatic, marine, or wetland habitats. Such species are unable to utilize terrestrial environments or to move significantly away from aquatic environments during a portion of their life cycle. The category also includes species that may live in terrestrial environments but which derive an obligatory portion of their resource needs from aquatic environments.
Aquatic / Terrestrial Species: Species that utilize both aquatic and terrestrial habitats for discretely different resource requirements for some portion of their life cycle. Examples of such species include those that have nests in areas that are distinctly terrestrial but which feed in aquatic or marine environments (e.g. marbled murrelet and peregrine falcon). As the activities performed in these different habitats are distinct from one another and as the areas may be geographically distinct from one another and different in size and configuration, separate occurrences of the same species may be considered either terrestrial or aquatic. For example, old growth forest areas that support nesting of marbled murrelets are considered terrestrial habitat, thus occurrences of marbled murrelets noted to be in this habitat are classified as terrestrial species. However, the marine feeding areas of marbled murrelets are considered aquatic habitat; therefore, occurrences of marbled murrelets sited in this habitat are classified as aquatic species.
Community Water System (CWS): A public water system (PWS) that provides at least 15 service connections used by year-round residents of the area or regularly serves at least 25 year-round residents.
Critically Imperiled and Imperiled Species and Subtaxa: Plant and animal species that are at risk of extinction due to their extremely restricted distribution or limited numbers. These resources are identified, ranked, and inventoried by Natural Heritage Programs and Conservation Data Centers in conjunction with The Nature Conservancy (TNC). Under the TNC approach, each species is assigned a Global (or range-wide) Conservation Status Rank. This rank is based on several specific factors, including the number of known occurrences or populations, number of individuals, health of the population, its extinction potential, whether it is experiencing an increasing or decreasing trend, and if there are known threats to the species (Master 1991). Critically imperiled taxa demonstrate extreme rarity (5 or fewer occurrences or fewer than 1,000 individuals or less than 2,000 acres) or extreme vulnerability to extinction due to some natural or man-made factor. There are approximately 1,300 species in the United States that are ranked as critically imperiled globally. Rare or extremely vulnerable subtaxa that are critically imperiled are included in this category, despite the conservation status of the species as a whole. Imperiled taxa demonstrate rarity (6 to 20 occurrences or 1,000 to 3,000 individuals or 2,000 to 10,000 acres) or vulnerability to extinction due to some natural or man-made factor. There are approximately 1,800 species in the United States that are ranked as imperiled. Rare or vulnerable subtaxa that are imperiled are included in this category, despite the conservation status of the species as a whole.
Depleted Marine Mammal Species: Species identified and protected under the Marine Mammal Protection Act of 1972, as amended (MMPA) (16 U.S.C. 1361 et seq.). The term "depleted"; refers to marine mammal species that are listed as threatened and endangered, or are below their optimum sustainable populations (16 U.S.C. 1362). As of April 2000, 18 species were listed as "depleted"; under the MMPA. Eleven of these species are also listed as endangered and three of these species are listed as threatened under the Endangered Species Act.
Drinking Water Resources: Surface water intakes and groundwater systems supplying potable water for domestic, commercial and industrial users. Such supplies may provide drinking water for permanent communities (e.g. cities and towns), transient communities (such as campgrounds), or individual domestic supplies for residential consumption.
Ecological Resources: Fish, wildlife, plants, biota and their habitats, which may include land, air, and/or water.
Element Occurrence (EO): A locational record for a site that contains an individual, nest, den, population, or stand of a sensitive element. There are four categories of elements: plants, animals, terrestrial communities, and aquatic communities (California Department of Fish and Game, 1996).
Environmentally Sensitive Area (ESA): Drinking water and ecological resources as generally described by the National Oceanic and Atmospheric Administration (NOAA) (59 CFR 14714).
Filter Criteria: Assessment factors that provide parameters by which the USA candidates can be uniformly assessed for inclusion in the final set of USAs.
Hazardous Liquid: Petroleum, petroleum products or anhydrous ammonia (et seq. 49 CFR 195.2).
Marine Mammal: "Any mammal that is morphologically adapted to the marine environment (including sea otters and members of the orders Sirenia, Pinnipedia, and Cetacea), or primarily inhabits the marine environment (such as the polar bear)"; (16 U.S.C. 1362). The order Sirenia includes manatees, the order Pinnipedia includes seals, sea lions, and walruses, and the order Cetacea includes dolphins, porpoises, and whales.
Multi-Species Assemblage Area (MSAA): An area where three or more different critically imperiled or imperiled species, threatened or endangered species, depleted marine mammals, or migratory waterbird concentrations co-occur.
Non-Transient Non-Community Water System (NTNCWS): A PWS that regularly serves at least 25 of the same people at least six months of the year. Examples of these systems include schools, factories, and hospitals that have their own water supplies.
Pipeline Operator: The company, or other entity, which has responsibility for operating and maintaining the pipeline system.
Pipeline System: All parts of a pipeline facility through which a hazardous liquid moves in transportation, including but not limited to, line pipe, valves, and other appurtenances connected to line pipe, pumping units, fabricated assemblies associated with pumping units, metering and delivery stations and fabricated assemblies therein, and breakout tanks.
Public Water Systems (PWS): A system that provides the public water for human consumption through pipes or other constructed conveyances, if such system has at least 15 service connections or regularly serves an average of at least 25 individuals daily at least 60 days out of the year. PWS can be community, non-transient non-community, or transient non-community systems , as defined by the EPA’s Public Water System Supervision (PWSS) Program.
Ramsar Site: A site that has been designated under The Convention on Wetlands of International Importance Especially as Waterfowl Habitat program. Ramsar sites are globally critical wetland areas that support migratory waterfowl. These include wetland areas that regularly support 20,000 waterfowl; wetland areas that regularly support substantial numbers of individuals from particular groups of waterfowl, indicative of wetland values, productivity, or diversity; and wetland areas that regularly support 1% of the individuals in a population of one species or subspecies of waterfowl.
Sole Source Aquifers (SSA): An area designated by EPA under the Sole Source Aquifer program as the "sole or principal" source of drinking water for an area. Such designations are made if the aquifer's ground water supplies 50 percent or more of the drinking water for an area, and if that aquifer were to become contaminated, it would pose a public health hazard.
Source Water Protection Area (SWPA): The area delineated by the state for a public water supply system (PWS) or including numerous PWSs, whether the source is ground water or surface water or both, as part of the state source water assessment program (SWAP) approved by EPA under section 1453 of the Safe Drinking Water Act.
Species: A fundamental taxonomic classification category consisting of organisms capable of interbreeding. In this paper, the term "species" can refer to species, subspecies, population stocks, or distinct vertebrate populations.
Terrestrial Species: Species able to utilize habitats that are not dominated by or dependent upon the presence of free water at the surface. Such species may visit aquatic habitats on a regular basis but do not require constant or regular contact with or derivation of food from aquatic habitats.
Threatened and Endangered (T&E) Species: Animal and plant species that have been listed and are protected under the Endangered Species Act of 1973, as amended (ESA73) (16 U.S.C. 1531 et seq.). A summary of these listed species is published annually as the "List of Endangered and Threatened Wildlife and Plants" (50 CFR 17.11 and 17.12). In the United States (including Alaska, Hawaii, Puerto Rico, U.S. Virgin Islands, and Pacific Trust Territories), there are currently more than 1,000 listed T&E species.
Transient Non-Community Water System (TNCWS): A PWS that does not regularly serve at least 25 of the same persons over six months per year. This type of water system serves a transient population found at rest stops, campgrounds, restaurants, and parks with their own source of water.
USA Candidates: A subset of drinking water and ecological ESAs. These candidates are areas that contain resources that are potentially more susceptible to permanent or long-term environmental damage, regardless of land ownership, management, or proprietorship.
Wellhead Protection Areas (WHPA): The surface and subsurface land area surrounding a well or well field that supplies a PWS through which, in the event of a release, contaminants are likely to pass and eventually reach the water well or well field.
Western Hemisphere Shorebird Reserve Network (WHSRN) Site: An area that contains migratory shorebird concentrations and has been designated as a hemispheric reserve, international reserve, or regional reserve. Hemispheric reserves host at least 500,000 shorebirds annually or 30% of a species flyway population. International reserves host 100,000 shorebirds annually or 10% of a species flyway population. Regional reserves host 20,000 shorebirds annually or 5% of a species flyway population.
This section describes the sources that are utilized in developing the USA data set. Federal, state, and private data sets were gathered to identify and locate USAs. The data are expected to meet certain quality standards. The following discusses the data sources that were researched and gathered and the quality standards that were used to review these data sources.
The USA identification process is based upon a spatial analysis methodology that allows operators to assess the relative co-location of pipeline facilities with sensitive resource areas. In addition to coordinate-based location information for resource areas, other types of data are used to help identify USAs.
The U.S. Geological Survey (USGS) has created a nationwide electronic base map that depicts hydrography (e.g. lakes, rivers, streams, wetlands and coastline). These data are available as USGS 1:100,000 -scale digital line graphs (DLG) files and can be downloaded from internet sources. USGS is currently working in conjunction with EPA to create a new nationwide electronic data set called the National Hydrography Dataset (NHD). This data set will include all the digital representations of surface waters inherent in the DLGs, in addition to attribute data that indicates upstream and downstream order. DLG information is available on the internet at http://edc.usgs.gov/doc/edchome/ndcdb/ndcdb.html.
All public water suppliers submit compliance and enforcement information to EPA for inclusion in the Safe Drinking Water Information System (SDWIS), as required by the Safe Drinking Water Act (SDWA) Amendments of 1996. The SDWIS recently replaced the Federal Reporting Data System (FRDS) database. The Office of Drinking Water maintains and disseminates the data, which is used for the Public Water System Supervision (PWSS) Program. Data includes, among other things: owner/operator name and address, operational status, location, on-site visits, sources, violations, enforcement and compliance actions, treatment, variances and exemptions, area (county and population) served by the system, and historical information.
The USA model also makes use of "state-accepted" aquifer boundaries. "State-accepted" refers to publication sources that are widely respected by the state community. The aquifer boundaries are used to validate the source aquifer attributes of groundwater systems. The boundaries are also used to assign source aquifers to groundwater systems with unspecified or ambiguous source aquifer attributes. If available, surface geology maps can be employed to assist in aquifer classifications. Surface geology maps may be used to delineate aquifer outcrop boundaries when no "state-accepted" aquifer boundaries are available.
Sole Source Aquifer boundaries are used to provide extra protection for vulnerable groundwater systems that are located within a sole source aquifer. Digital boundary data can be obtained by contacting the headquarters of each EPA region.
Data from the Adequate Alternative Drinking Water Database is used in determining which public water systems have no adequate alternative source. An Adequate Alternative Source (AAS) is defined as an alternative source of water that currently exists, that can be used with a minimum amount of effort and cost, and that will meet the short-term consumptive and hygiene requirements of the existing population. Information about alternative sources for public water systems is generally not available in PWS databases. For the pilot test, public water systems were contacted and queried about alternatives in order to compile this information.
A number of data sources can be used to help identify ecological USAs. These data sources reflect both the nature of the landscape and the distribution of ecological resources upon the landscape. The identification of ecological USAs requires spatially explicit resource occurrence data. Resource occurrence data describe the actual locations where individuals or populations of species or subtaxa occur, or where Ramsar and Western Hemisphere Shorebird Reserve Network (WHSRN) sites have been established. Spatially explicit means that the actual location of these occurrences is represented in map based terms, as in latitude/longitude coordinates or other geographic units.
For species and subtaxa distributions on land (and sporadically in marine environments), the model employs the Natural Heritage Program (NHP) element occurrence (EO) databases from each pilot test state (i.e. California, Louisiana, and Texas).
For species and subtaxa distributions along the coast and in marine environments, the model accepts the sensitive biological resources information from the Environmental Sensitivity Index (ESI) data sets. In general, NOAA publishes ESI data sets. Some states, however, have a proprietary biological resources database that is considered the state-accepted ESI data set. For the pilot test, NOAA ESI data sets are used for San Francisco Bay, the coast and offshore islands of California, and the upper Gulf Coast of Texas. For the central and lower Gulf Coast of Texas, the model uses biological resources information from the Texas General Land Office (TGLO), because it is considered the state-accepted ESI data set. A digital ESI data set for the coast of Louisiana was not available at the time of the pilot test and was not included in the ecological USA model run for Louisiana.
It is desirable that USA data be mappable to sufficient precision such that there is a high likelihood that the resource occurs within the identified area. To meet the site specificity needs of the USA process, data must be based upon known occurrences or features that are mappable to one minute, or greater, precision. (One minute of a degree roughly translates to 1 mile in most parts of the globe.) Data that meet these requirements allow for the development of effective site-specific risk assessment and protective measures.
Data sets and individual data records that do not currently meet these resolution and quality requirements are periodically re-evaluated for improvements in data quality. This re-evaluation is necessary because these data sets and individual records are continually being revised and upgraded by the various responsible entities as new information becomes available.
USGS DLG data are digital representations of points, lines, and areas of planimetric information derived from 30- by 60-minute intermediate scale quadrangle maps. The data used by the model are considered DLG - Level 3 (DLG-3), which means the data contain a full range of attribute codes, have full topological structuring, and have passed certain quality-control checks described in the Federal Geographic Data Committee's (FGDC) Content Standards for Digital Geospatial Metadata. According to the U.S. National Map Accuracy Standards, all features in the 1:100,000-scale hydrography layer are mapped to a precision of approximately 167 feet.
The USGS/EPA National Hydrography Dataset (NHD) is comprised of the USGS 1:100,000-scale DLGs integrated with reach-related information from the EPA Reach File Version 3 (RF3). The integration of these two data sets enables the analysis and display of water-related data in upstream and downstream order at an intermediate data resolution scale. The information is being compiled in hydrologic cataloging units across the United States. At the time of the pilot test, quality control checks meeting FGDC standards were not yet completed for all HUC areas to make statewide applications practical. Once the effort is completed, it is recommended that the NHD be used in place of the DLG hydrography data. More information can be obtained from the web site, http://nhd.usgs.gov/.
The databases that contain public water system information and other data relating to drinking water resources, (such as aquifer boundaries or surficial geology), are created at the state and regional level following different data quality standards. Thus, data sets can vary widely from state to state in the level of map accuracy and amount of descriptive attributes associated with the mapped features. Although it is recommended that data be standardized in positional accuracy and content, the pilot test accepted the state drinking water databases "as is", because the digital information was the best available at the time.
Of the species and subtaxa distribution data sets available, the Natural Heritage Program (NHP) Element Occurrence (EO) database most effectively meets the data resolution requirements for terrestrial and freshwater ecological resources. Natural Heritage data are maintained on a state and regional basis under an initiative conceived of and fostered by The Nature Conservancy and the Association for Biodiversity Information (ABI). Attributes vary from state to state. In many states, extensive work has been done to populate the standard TNC/ABI data model, including attributes on data accuracy, precision and species characteristics. In other states, only a base level of data is available. Information on the TNC/ABI data model is available on the internet at http://www.natureserve.org/methods.htm.
For coastal, marine, and some inland resources, the Environmental Sensitivity Index (ESI) data sets most closely meet the data resolution requirements. The ESI data sets are composed of three primary elements, 1) Shoreline Classification, 2) Human-Use Resources, and 3) Biological Resources (Halls et al., 1997). Of these three elements, the biological resources element provides species occurrence data and compliments the NHP EO database.
NHP EO data and ESI data can generally be characterized as either points or polygons. Point data normally represent the place where the species was sited or the center of the area associated with the EO. Point data do not reflect specific boundaries or total area of the EO. The majority of EO data are available as points. Polygonal data are generally used to represent two different types of boundaries. Polygons can represent approximated areas, (such as a buffer circle), or they can provide the specific boundaries of a species’ habitat. The later type of polygonal data, referred to as a resource-based polygon, typically has been established through field investigations. Resource-based polygons are mapped as complex shapes associated with the landscape or other features. There are efforts by a number of programs to use resource-based polygons for prioritized species occurrences that are currently available as point data only.
The boundaries of migratory waterbird concentration areas identified by the Ramsar and WHSRN programs have not been fully mapped in all cases, but available site descriptions do provide sufficient detail to allow them to be mapped consistent with the recommended data quality requirements. Information on Ramsar sites can be found at the website, http://ramsar.org/, and for WHSRN sites at http://www.manomet.org/WHSRN.htm. Information can also be obtained from the U.S. Fish and Wildlife Service, Office of International Affairs.
Other sources were evaluated for utilization as USA ecological resource data, but did not meet requirements for data access, standardization, and site specificity, that were more readily available from other sources. Several of these ecological resource mapping programs may achieve the necessary data quality requirements in the future.
The successful implementation of the USA identification model is contingent upon the availability of suitable data elements, as discussed in the preceding sections. To the extent that data are currently available in map-based electronic or paper form, or in a form that can readily be plotted on a map, these data will be acquired and will be used to identify and map USAs. These maps will be made available to pipeline operators and others through the National Pipeline Mapping System (NPMS). Pipeline data for the NPMS is currently being gathered and processed on a state by state basis.
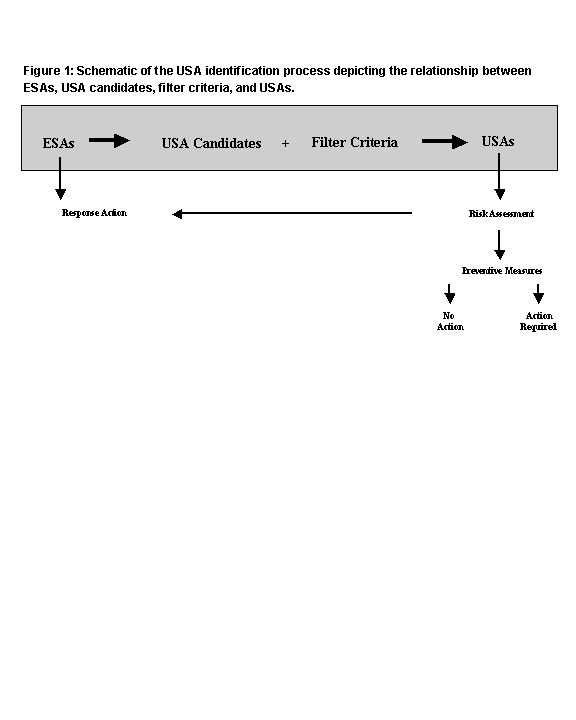
The USA process was developed through extensive consultation with drinking water and ecological resource experts, government agencies, and other stakeholders. This multi-step process involves the assessment of environmentally sensitive areas (ESAs) that meet the prescribed quality requirements and the designation of USAs through a filtering process.
ESAs include all potential drinking water and ecological resources that are considered sensitive and would be afforded protection under any number of federal resource protection programs. In addition to being afforded protection under their individual protective mandates, these resources are also afforded protection under the Oil Pollution Act of 1990 (OPA 90). As such, these resources are already identified and provided with appropriate response measures through the OPA contingency planning process.
From among the ESAs, USA candidate resources are identified. USA candidates are potentially more susceptible to permanent or long-term environmental damage in the event of a hazardous liquid pipeline release. For drinking water, USA candidates are those resources that are clearly identified as currently providing a potable drinking water source to populations and communities of people, or industrial use. For ecological resources, USA candidates include areas containing species clearly in jeopardy of extinction and areas where large concentrations of a species’ world population congregate for a period of time.
Filter criteria are applied to the list of USA candidates to identify those areas that are most critical to the maintenance of the health and welfare of humans and the continued existence of biological species. The application of filter criteria produces the final set of USAs. Figure 1 depicts the process for identifying USAs.
Pipeline operators will utilize a risk assessment process to determine if a release could impact USAs. Pipelines that could impact a USA will be subject to additional prevention, mitigation, and response action to minimize any potential impact on these USAs.
Ecological USAs focus upon geographic areas that support biological resources that are susceptible to permanent loss (i.e. extirpation) and/or irretrievable or long-term impairment on a global basis. From the broad spectrum of federally protected ecological resources, ESA data are selected based upon the distribution and occurrence of biological resources, rather than upon designated lands (i.e. parks, refuges, estuaries, etc). Ecological USA candidates are ESAs that are at risk of extinction or significant and long-term reduction. Filter criteria highlight the priority areas for protecting and maintaining biological species.
This rationale reflects an approach that is based upon an understanding of the geography of species at risk. Stein et al. (2000) provide an excellent synthesis of an approach to the identification of essential biodiversity refuges that is derived from previous studies including Scott et al. (1987), Kiester et al. (1996), Dobson et al. (1997), Flather et al. (1994 & 1998), Ehrenfeld (1997) and TNC (1996 & 1997).
Ecological ESAs are resources that are sensitive to the effects of oil spills (NOAA, 1994 59 FR 14714). ESAs include fish, wildlife, plant, and habitat resources. ESAs include such resources as breeding, spawning, and nesting areas; early life stage concentration and nursery areas; wintering or migratory areas; rare, threatened, and endangered species locations and other types of high concentration or sensitive areas.
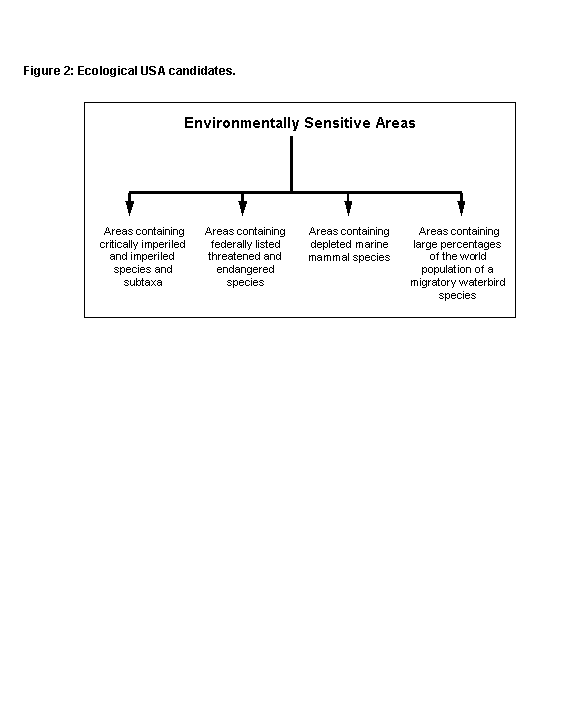
Ecological USA candidates are a subset of ecological ESAs. These candidates are potentially more susceptible to permanent or long-term environmental damage.
Four resource categories have been identified as ecological USA candidates (Figure 2). These categories are susceptible to permanent or long term ecological damage due to inherent characteristics of rarity, imperilment, or the potential for loss of large segments of an abundant population during periods of migratory concentration.
Two programs of international significance are responsible for identifying and delimiting areas where significant populations of migratory waterbirds congregate during critical periods. The first program, the Western Hemisphere Shorebird Reserve Network (WHSRN), ranks migratory shorebird concentration areas into four different categories on the basis of biological criteria. These three categories are:
As of April 2000, 24 WHSRN sites have been established in the United States (Table 1).
A second program, The Convention on Wetlands of International Importance Especially as Waterfowl Habitat (Ramsar), is dedicated to the identification of globally critical wetland areas supporting migratory waterfowl. The establishment of a Ramsar site (Resolution VII.11, COP7, 1999) includes the following specific criteria for waterfowl:
A wetland area that regularly supports 20,000 waterfowl, or
where data on populations are available, a wetland area that regularly supports 1% of the individuals in a population of one species or subspecies of waterfowl.
As of April 2000, there were 17 Ramsar sites identified in the United States (Table 1).
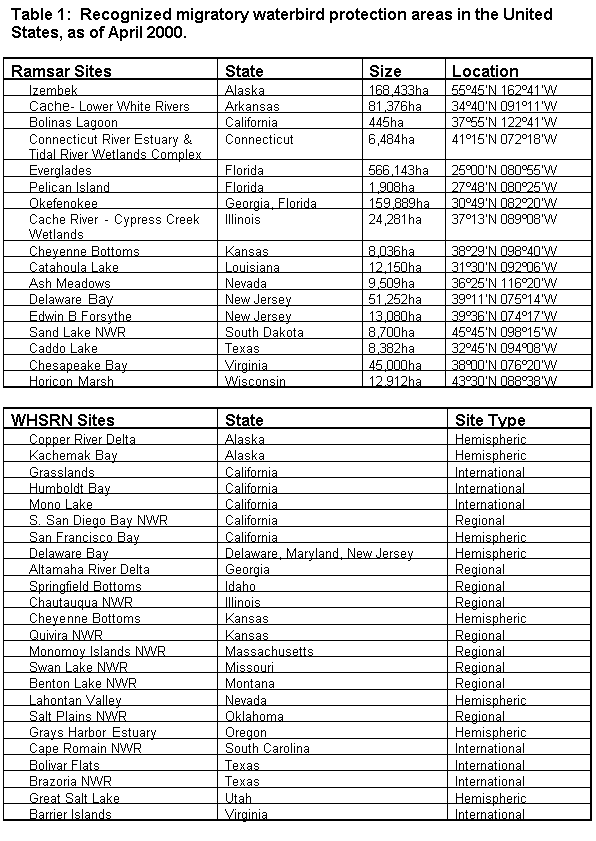
(Note: NWR stands for National Wildlife Refuge.)
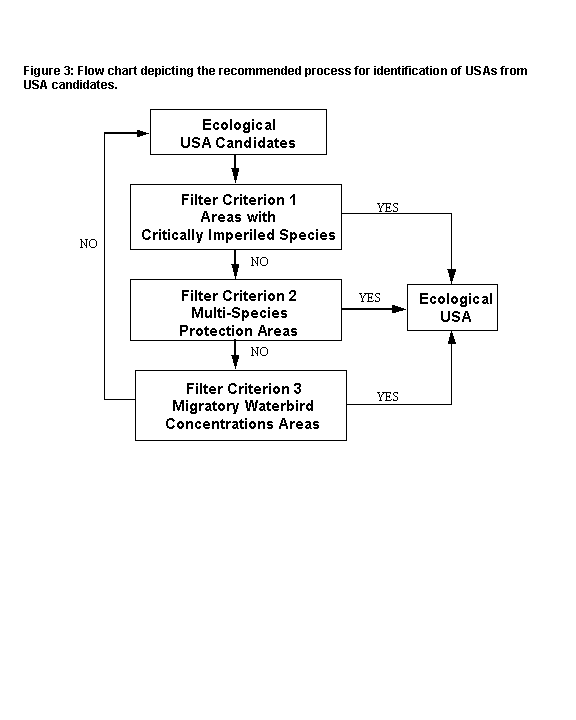
Three ecological filter criteria have been developed that are consistent with current trends in conservation ecology. These filter criteria identify areas with critically imperiled species, multi-species assemblages, and migratory waterbird concentrations. Figure 3 illustrates how these three criteria are applied in a multi-tiered process where all ecological USA candidates receive repetitive consideration for USA status. For example, an ecological USA candidate is first subjected to filter criterion 1 (areas with critically imperiled species) and may be designated as a USA at this point. If the candidate does not meet filter criterion 1, it then receives consideration under filter criterion 2 (multi-species assemblage areas) and may be designated as a USA at this point. If the candidate does not meet filter criterion 2, it receives consideration under filter criterion 3 (migratory waterbird concentration areas) and may be designated as a USA at this point. If the candidate does not meet filter criterion 3, it remains a USA candidate. All candidates are periodically reviewed to consider changes in resource information or status. A candidate becomes a USA once it meets one of the filtering criteria.
Filter Criterion 1 - Areas with Critically Imperiled Species
Filter criterion 1 selects as USAs those ecological USA candidates that are viable occurrences of species or subtaxa designated as critically imperiled globally. These species or subtaxa demonstrate extreme rarity or extreme vulnerability to extinction due to some natural or man-made factor. They typically have five or fewer occurrences or fewer than 1,000 individuals globally. In some cases, species or subtaxa may be identified as critically imperiled because they are subject to an extreme threat of extinction due to factors other than low number of occurrences or individuals.
The critically imperiled designation includes a wide variety of plant and animal species and subtaxa. As of April 2000, it included approximately 64 percent of the listed threatened and endangered species and 53 percent of those species currently designated as proposed or candidates for listing under The Endangered Species Act. This filter criterion also selects an additional number of plant and animal species and subtaxa that are not designated under The Endangered Species Act. All ecological USA candidates meeting this criterion are considered USAs. Ecological USA candidates that do not meet filter criterion 1 are retained for consideration under filter criteria 2 and 3.
Filter Criterion 2 - Multi-Species Assemblage Areas
Filter criterion 2 selects those ecological USA candidates that form multi-species assemblages. Multi-species assemblages are defined as areas where three or more different critically imperiled or imperiled species, federally threatened or endangered species, species federally-listed as essential experimental populations, depleted marine mammals, or migratory waterbird concentrations co-occur.
Whereas filter criterion 1 selects the critically imperiled occurrences of individual species or subtaxa, filter criterion 2 selects ecological USA candidates where multiple species, subtaxa, or migratory waterbird concentrations co-occur. These areas are valuable as they often represent unique ecosystems and protect a greater number of sensitive resources per site location.
Filter Criterion 3 - Migratory Waterbird Concentration Areas
Filter criterion 3 selects those ecological USA candidates that are designated as Ramsar sites that meet the specific waterfowl criteria, or WHSRN sites ranked as hemispheric or international.
Filter criterion 3 focuses on areas where significant populations of migratory waterbirds congregate during critical periods. Relatively common species may be at risk at such sites. In some cases, as much as 80 percent of the entire North American population of a particular species may occur at one of these sites during critical concentration periods (Harrington and Perry, 1995).
Developing an approach to designating and mapping USAs, the primary goal of providing adequate protection to areas of unusual ecological sensitivity necessitates adopting a rule set that enables resources of innately different ecological character to be handled appropriately within the model. The rule set must also handle the inherent limitations of currently available data sets that have generalized mapping procedures, in cases where greater specificity may be justifiable on an ecological basis. The remainder of this section discusses how a number of specific mapping problems were resolved during the pilot test.
For the pilot test, three types of USA polygons are used to delineate USAs: resource-based polygons, 1-mile radius derived buffer circles, and 5-mile radius derived buffer circles that incorporate surface water features on the landscape.
The resource-based polygon is derived directly from mapped element occurrence areas contained within the Natural Heritage Program (NHP) and Environmental Sensitivity Index (ESI) data sets. These polygons are mapped on the basis of recent field observations and are accepted as the best available characterization of the species location. Resource-based polygons are utilized preferentially over other derived areas.
Aside from these relatively rare polygons, the majority of EO areas are derived as buffer circles around the EO point. EOs identified with terrestrial and isolated aquatic environments are represented by buffer circles incorporating the landscape within a 1-mile radius of the EO point designated in the NHP data set.
EOs identified with open water aquatic environments are represented by all connected open waters within a 5-mile radius of the EO point. Derived open water aquatic EO areas also extend one-fourth mile on either side of mapped open waters in order to incorporate associated riparian areas.
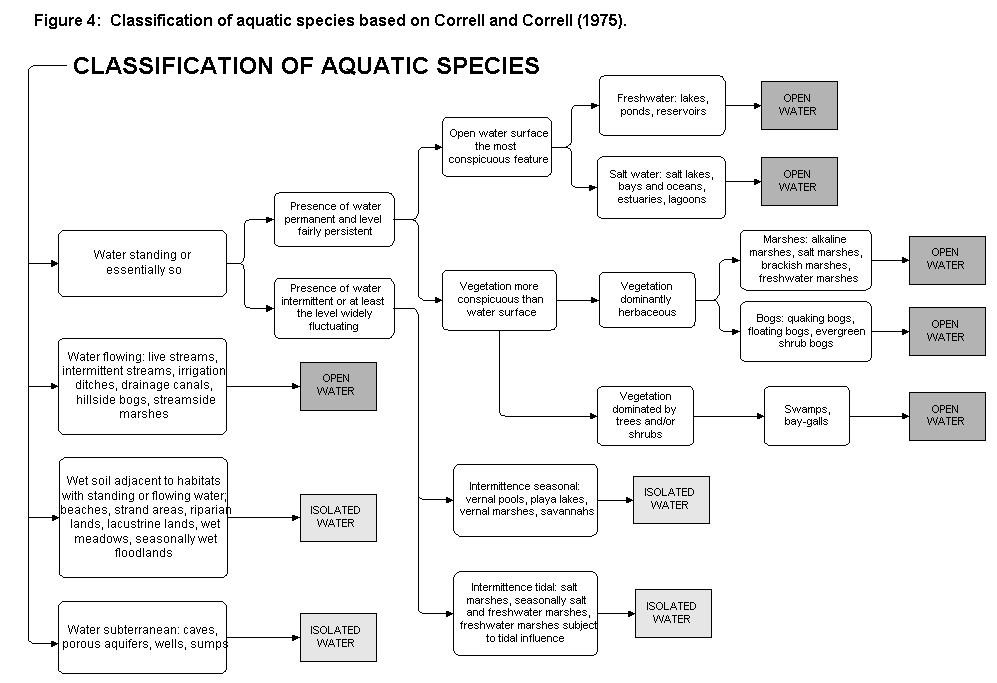
A number of habitat types have been employed by the ecological USA model that result in differences in the size and shape of the candidate USA. Derived buffer areas accommodate for uncertainties and inaccuracies about the actual location and geographic extent of the EO. They also provide an ample buffer of protection around the unusually sensitive ecological resource. Aquatic species are subdivided according to their dependence upon, or occurrence within, the various aquatic environments listed in Figure 4 based upon Correll and Correll (1975).
Species that occur predominately in, or associated with, isolated or ephemeral water bodies are treated as terrestrial species. Their derived EO area consists of a 1-mile radius buffer circle around the EO point.
Species that occur predominately in larger bodies of water and non-isolated water are treated as open water aquatic species. That is, the derived EO area is represented as all connected waters within a 5-mile radius of the coordinates of the EO point.
The original intent was for open water aquatic USAs to include all connected (e.g. source) upstream waters for a distance of five river miles above the EO. The downstream portion of the USA would include only receiving waters five river miles below the EO. That is, tributaries entering receiving waters below the occurrence would not be included in the USA. This methodology requires the use of a hydrography data set with flow direction information. The National Hydrography Dataset (NHD) best fulfills this requirement, but quality control checks are still underway on the data set. Without this data, it is difficult to assign flow directionality to river segments. Flow data are currently available in the EPA Reach File Version 1 (RF1), however this data set is mapped at a scale of 1:250,000 and the coarser resolution precludes the inclusion of a number of significant water courses. Until the NHD is available for use nationwide, the model adopts a 5-mile radius buffer circle around an EO point and incorporates all connected open waters within that buffer zone. The approach increases the number and mileage of water courses that are included in the USA; but it conservatively increases the likelihood that the appropriate water body will be included in the USA. Pipeline operators would retain the capability, however, of examining the USA during the risk assessment phase and discounting any unconnected and non-receiving waters from the USA.
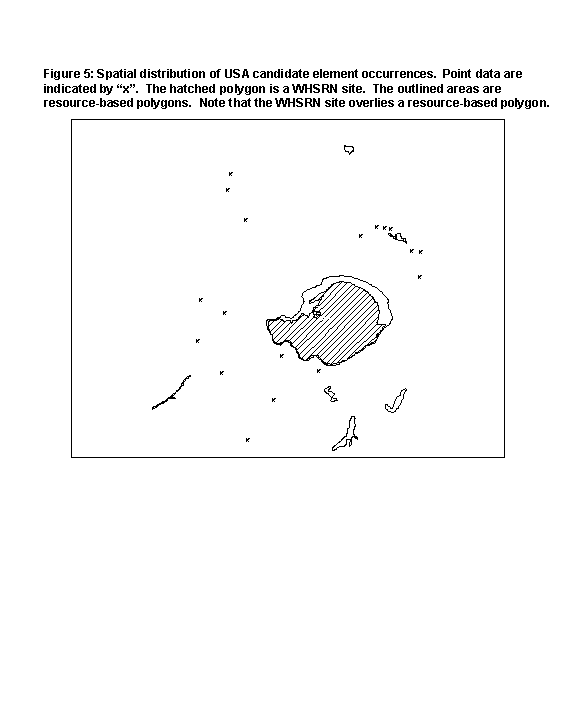
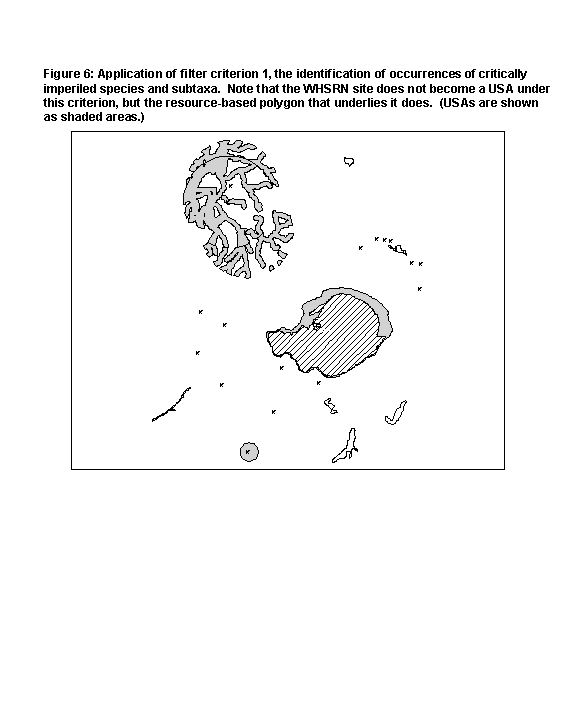
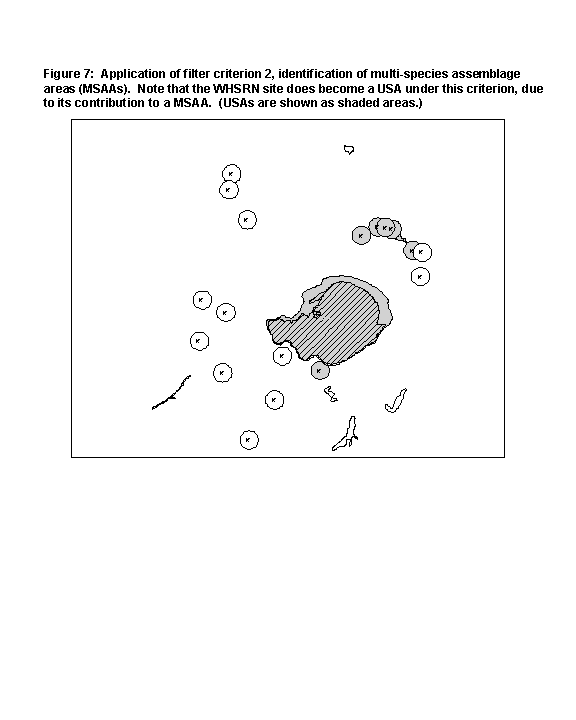
The implementation of the USA identification process for ecological USA candidates is depicted in Figures 5-9.
Figure 5 shows a spatial distribution of USA candidate element occurrences (EOs), as they would be represented by NHP and other data sources. Note that these data are acquired as both point and polygon data as described in Section 2.2.3.
Figure 6 depicts the application of filter criterion 1. Areas representing critically imperiled species and subtaxa have been identified as USAs and are represented by the shaded polygons. As discussed in Section 3.2.4.2, apparent differences in the size and shape of the USA polygons correspond to the habitat type of their species occurrence.
Figure 7 depicts the application of filter criterion 2. Multi-species assemblage areas (MSAAs) are identified by the union of three or more unique candidates USAs. Note that USA candidates represented by point data are shown as 1-mile buffer circles regardless of habitat type. Standard buffer sizes allow all USA candidates equal opportunity to contribute to a MSAA and keep open water aquatic species from driving the identification of large MSAAs.
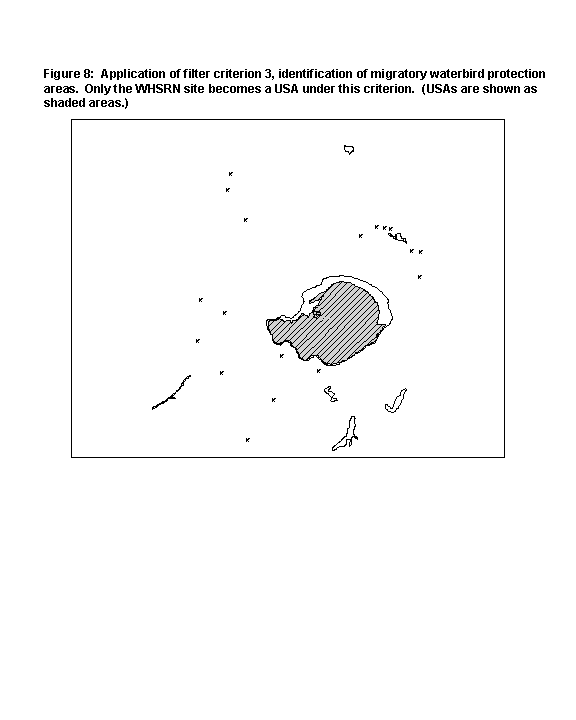
Figure 8 depicts the application of filter criterion 3. Occurrences that have been designated as Ramsar sites that meet the specific waterfowl criteria or WHSRN sites ranked as hemispheric or international reserves are identified as USAs. These occurrences are shown as shaded polygons in the figure.
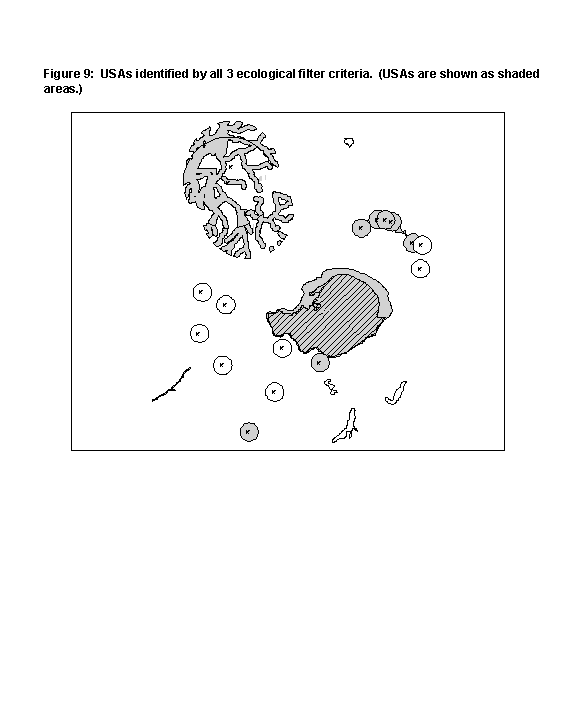
Figure 9 shows the final USAs that have been identified by the application of all three ecological USA filtering criteria.
Drinking water USAs are defined through the stepwise process of assessing the availability and quality of drinking water ESA data, the selection of USA candidates, and the application of filter criteria to produce the final set of USAs (Section 3.1). Drinking water USAs focus upon those identifiable sources of potable water that are necessary for uninterrupted human consumption and use; the priority is protecting human health.
Drinking water ESAs include surface water intakes and groundwater systems that supply potable water for domestic, commercial and industrial use. System may provide drinking water for permanent communities (e.g. cities and towns), transient communities such as campgrounds, or individual domestic consumption.
USA candidates for drinking water resources are a subset of the drinking water ESAs, representing those sensitive areas that are potentially more susceptible to permanent or long-term environmental damage from a hazardous liquid pipeline incident.
Drinking water USA candidates include the following:
- Public Water Systems (PWS): These systems are classified according in the EPA PWSS Program as:
Community water systems (CWS); Non-transient non-community water systems (NTNCWS); or Transient non-community water systems (TNCWS).
- Wellhead Protection Areas (WHPA): WHPAs are geographic areas of varying size and shape that surround existing wellheads. The areas are defined by individual state programs. As of April 2000, 47 states and 2 territories have identified WHPAs for public drinking water systems. For states without designated WHPAs, the model employs a default WHPA of 2000 feet.
- Sole Source Aquifers (SSA): The sole source aquifer program was established under Section 1424(e) of the Safe Drinking Water Act of 1974. The program identifies aquifers that provide at least one-half of the drinking water consumed in the area above the aquifer, or aquifers that provide the only local or regional source of drinking water.
Three filter criteria and two notable exceptions have been developed for use in the drinking water USA identification process.
Notable Exception 1 - Transient Non-Community Water Systems
If the public water system is a Transient Non-Community Water System (TNCWS), the water intakes shall not be designated as USAs.
Filter Criterion 1 - Community Water Systems (CWS) and Non-Transient Non-Community Water Systems (NTNCWS) Relying on Surface Water Intakes
For CWS and NTNCWS that obtain their water supply primarily from surface water sources, and do not have an adequate alternative source of water, the water intakes shall be designated as USAs.
Filter Criterion 2 - Community Water Systems (CWS) and Non-Transient Non-Community Water Systems (NTNCWS) Relying on Groundwater Sources Vulnerable to Contamination
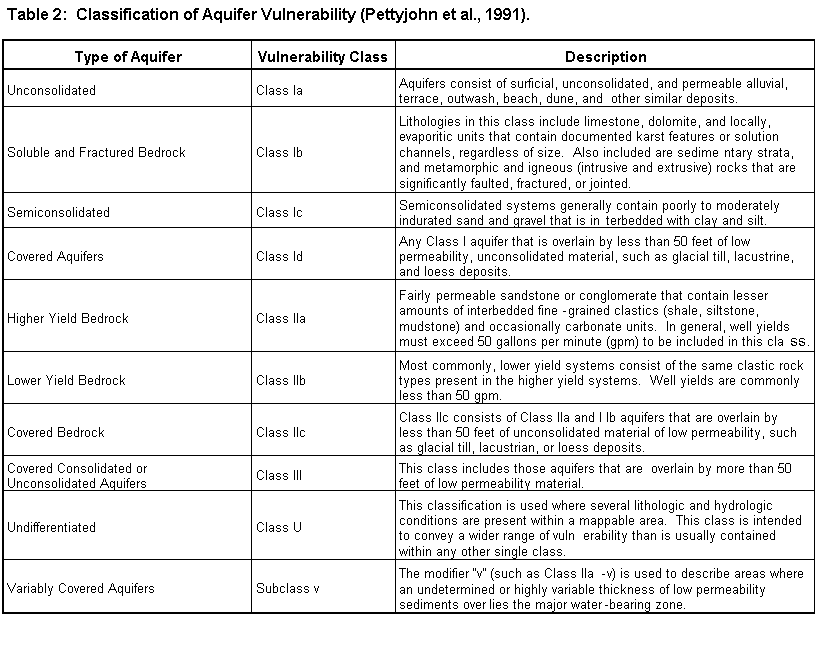
For CWS and NTNCWS that obtain their water supply primarily from groundwater sources, where the source aquifer is identified as Class I or Class IIa (per Pettyjohn et al., 1991), (see Section 3.3.4), and which do not have an adequate alternative source of water, the wellhead protection areas (WHPAs) for such systems shall be designated as USAs.
Class I and IIa aquifers are considered the most vulnerable to contamination due to the surficial, shallow, and permeable nature of their lithology.
Notable Exception 2 - Community Water Systems (CWS) and Non-Transient Non-Community Water Systems (NTNCWS) Relying on Groundwater Sources of Relatively Low Vulnerability
For CWS and NTNCWS that obtain their water supply primarily from groundwater sources, where the source aquifer is identified as a Class IIb, Class IIc, III or Class U (per Pettyjohn et al., 1991), the public water systems that rely on these aquifers shall not be designated as USAs.
Class IIb, IIc, and III aquifers are considered the least vulnerable to contamination by virtue of their hydrogeologic properties (e.g. depth and/or low yield, isolation due to overlying strata, etc.). Such properties make these aquifers less likely to be impacted by pipeline spills. The Class U designation is used where several lithologic and hydrologic conditions are found within the same geographic area, making a clear designation difficult due to a wider range of vulnerability than is contained within any other single class.
Filter Criterion 3 - Community Water Systems (CWS) and Non-Transient Non-Community Water Systems (NTNCWS) Relying on Sole Source Aquifers that are Vulnerable to Contamination
For CWS and NTNCWS that obtain their water supply primarily from groundwater sources, where the source aquifer is identified as Class I or Class IIa (per Pettyjohn et al., 1991), and the aquifer is designated as a sole source aquifer, an area twice the radius of the WHPA, (if the WHPA is fixed-radius), or the WHPA itself, (if the WHPA is zone-defined), shall be designated as an USA.
Sole source aquifers are defined by the EPA as the "sole or principal" source of drinking water for an area. Sole source aquifers supply at least 50 percent of the drinking water consumed in the overlying area. Such critical water resources warrant the highest levels of protection. Filter criterion 3 accounts for an ample buffer of protection around these extremely sensitive drinking water resources.
In addition to public water systems relying on surface or groundwater sources, the USA identification process incorporates data describing aquifer systems, surface geology, hydrology, lithology, wellhead protection areas, and source water protection areas.
Filter criteria and notable exceptions pertaining to groundwater sources employ an aquifer classification scheme to aid in distinguishing between differences in the characteristics of various hydrogeologic systems (Pettyjohn et al., 1991). Using this system, all aquifers in the United States have been classified into nine categories (Table 2).
The geology of the physical system determines vulnerability. Pettyjohn et al. (1991) developed the classification scheme based on an assessment of the vulnerability of surficial and relatively shallow aquifers to contamination from near surface sources. The investigation, based entirely on published reports and maps, was an attempt to evaluate all aquifers nationwide on the basis of their reported physical properties and related hydrologic characteristics and behavior.
The maps described by Pettyjohn et al. (1991) are regional in nature and provide a broad, generalized overview of aquifer vulnerability and sensitivity. All Class I and IIa aquifers are considered the most vulnerable to contamination, and therefore the objective of filter criterion 2 is to protect drinking water systems that rely on such sources of groundwater.
The determination of source aquifers for CWS and NTNCWS relying primarily on groundwater can be a complex problem, as no national database directly providing such information is available. Furthermore, for some CWS and NTNCWS, the depth of the wells or source aquifer is not known. Such information must be obtained on a case-by-case basis through contacting the appropriate state agencies or, at times, individuals responsible for the public water systems.
In 1986, amendments to the Safe Drinking Water Act (SDWA) established the Wellhead Protection (WHP) Program. Under these amendments, each state was called upon to develop, and submit to EPA for approval, a plan that would protect ground water which supplies wells, well fields, springs, and tunnels that provide drinking water to the general public. The plan is administered by the EPA Office of Ground Water and Drinking Water. States and U.S. territories that currently have approved plans are listed by the EPA web site http://www.epa.gov/OGWDW/wellhead.html.
State Wellhead Protection Programs establish Wellhead Protection Areas (WHPAs). The methods employed to define these areas range from the very simple arbitrary fixed radius method (inscribing a circle around a well location) to more sophisticated analytical methods. Whatever the method, the resulting areas are identified, potential contaminant sources are located, and the areas are managed to protect the drinking water resource. Additionally, the WHPAs are employed in planning for future development. Management techniques may range from public education to contingency planning for provision of alternative supplies in the event of contamination. EPA provides technical assistance to the states in the preparation, approval, and implementation of their plans.
As of January 2000, three states, the Virgin Islands and Northern Marianna Islands did not have Wellhead Protection Programs. The methodology employs a default fixed radius of 2000 feet for wells that do not have a state designated WHPA.
The EPA Sole Source Aquifer (SSA) program allows individuals and organizations to petition the EPA to designate aquifers as the sole or principal source of drinking water for an area. The program was established under Section 1424(e) of the Safe Drinking Water Act (SDWA) of 1974. The primary purpose of the designation is to provide EPA review of federal financially assisted projects planned for an area and to determine their potential for contaminating the aquifer to prevent a significant hazard to public health. Based on this review, no commitment of federal financial assistance may be made for projects which the Administrator (of EPA) determines may contaminate such (an) aquifer, although federal funds may be used to modify projects to ensure that they will not contaminate the aquifer.
As of October 1999, EPA has designated 70 SSAs nationwide. For each designated SSA there is a technical support document that compiles all available information for that SSA. These documents are obtained through the regional EPA offices. For a National Summary of Sole Source Aquifer Designations as of December 2000, including Federal Register Citations and the availability of Geographic Information System mapping, consult EPA at http://www.epa.gov/OGWDW/swp/sumssa.html.
It is noted that the list of SSAs in the U.S. is always open for additions, both from the designation of new SSAs as well as existing SSAs being extended based upon approval of new petitions. State and local agencies are at different stages in filing for SSA status, though. This can result in a discrepancy of the geographic delineation of the SSA across governmental boundaries. One notable example is the Clinton Street Ballpark Valley Aquifer System in New York, where the SSA boundary corresponds to the county lines and state border, rather than the hydrogeologic boundary.
The data used in the ecological USA model comes from many sources and is provided in different formats. Most of the data must be converted from its native format (e.g. AutoCAD, hard copy, spreadsheet, etc.), to a format recognizable by ArcInfo. Much time and energy were expended gathering the ecological resource data and melding it into a singular database that interrelated the various data sets. This section describes the types of data gathered and the pre-processing steps required to work with the information in an ArcInfo environment.
The GIS ecological USA model is built to run on a state-by-state basis. Because biological resources are not inclined to follow boundaries of political jurisdiction, model input data 5 miles outside of a state’s border is included in the model for a state, as long as the data are available and the model state borders areas within the jurisdiction of the U.S. This allows the model to fully develop multi-species assemblage areas (MSAAs) along state lines and avoids discontinuity of ecological USAs across state borders.
Essentially this calls for all Natural Heritage Program (NHP) and Environmentally Sensitive Index (ESI) element occurrences (EOs), hydrography data, and WHSRN and Ramsar sites that are within 5 miles of the border of neighboring states to be pre-processed and included in each model run. Special consideration is afforded to EOs from adjacent state databases when evaluating and updating attribute information during the model data pre-processing effort.
For the pilot test, this concept could only be applied for the Louisiana and Texas model runs. Because all three pilot test states were run during the same time frame, post-processed data from neighboring state model runs was used during the analysis. When full implementation of the ecological USA model is undertaken, it is feasible that adjacent states may not always be run concurrently. With the dynamic nature of biological resources information, it is advisable to perform data pre-processing work for adjacent state EOs prior to each model run, when a sufficient time lag exists.
In order to represent the WHSRN and Ramsar site boundaries as best as possible in the model, each agency that is responsible for a migratory waterbird protection area in the pilot test states was contacted to determine if any digital geographic information was available for the site. Most agencies had some type of geographic information about the site boundaries. However, the information is maintained in a multitude of formats, (both digital and hard copy), with varying levels of locational accuracy and data quality. The model accepted the data as they were received from the agencies. Interactive data pre-processing was required to convert the information into the format required by ArcInfo prior to the model runs.
The biological resources data used by the model can be grouped into three different representations: resource-based polygons, derived areas, and points.
Resource-based polygons are areas that have been mapped from field observations. These delineations are typically mapped at a large scale with a fine resolution. Resource-based polygons are considered by the model to be the best representation of the EO habitat.
The purpose of the GIS ecological USA model is to identify areas of unusual sensitivity. However, some of the ecological data sources do not provide polygonal data or the polygonal data that is provided does not map the EO within one minute, or greater, precision. (One minute of a degree roughly translates to one mile in most places on the earth). In most cases, these EOs are also represented by point data that indicates a siting or center of the approximated EO area. The model derives an area for each of the EO points that meet this condition in order to achieve the essential aim of the model.
Derived areas are buffer circles that describe the spatial uncertainty of a point feature. For example, the EO is marked as a point on a map, but because of various factors there is uncertainty that the mark is actually the exact location of the EO. To account for the uncertainty, a buffer is inscribed around the EO point. The EO is considered to be located anywhere inside the buffer circle. For biological resources data mapped as approximated areas with a precision less than one minute (or one mile), the model employs the EO point feature related to the approximated area, (if one exists), and derives a buffer circle to replace the approximated area in the model run. The type of habitat that the EO is associated with or the habitat that the element (or species) depends on during part or all of its life cycle is then evaluated to determine the size and shape of the derived area.
The derivation of polygonal areas from EO point data relies heavily on the type of habitat the EO is associated with. There are three habitat types that an EO may be classified as: open water, isolated water, or terrestrial. In the event that the habitat type of the EO is unknown, the habitat that the species depends on during part or all of its life cycle is evaluated and classified accordingly. Ideally, the classification is performed by the state NHPs. Since the majority of EO point data comes from state NHP databases, the state NHP has the unique position of being the most familiar with the data and any possible idiosyncrasies.
Unique species listings of all EOs in the state NHP database represented by approximated areas or points are compiled during the pre-processing stage of the model. The listings are refined so that only EOs meeting the ecological USA filter criteria are sent to the state NHPs for habitat designations. For the pilot test, botanists and zoologists from Texas and Louisiana NHP performed the habitat classifications for the species in their state databases. Unfortunately, the California NHP was unable to assist with the classification during the time frame of the pilot test. Habitat designations for California NHP EO approximated areas and point data were assigned from research performed by the technical contractors on the pilot project.
To create a polygonal representation of open water habitat that offers the EO an effective protective buffer from accidental pipeline releases in aquatic environments, the methodology calls for the derivation of an area that incorporates all connected waters within a 5-mile radius around the EO point. In order to identify the location of surface water features within a state, the GIS requires a digital representation of the hydrography in the state.
Preferably, once it is complete, the National Hydrography Dataset (NHD) will be used as the standard digital representation of hydrography in a state. The data set contains the information necessary to closely approximate the location of surface water features and determine the flow of water both upstream and downstream. These data are invaluable when trying to identify connecting waters in a drainage network.
Until the NHD is ready for statewide applications, it was decided that the USGS 1:100,000-scale DLG data set will be used as the standard for representing hydrography in the pilot test states. For each pilot test state, searches were conducted to locate statewide compilations of the USGS intermediate-scale quadrangles that had already been combined into one seamless hydrography map layer. The searches were not successful, however. Consequently, the technical contractors were required to build the seamless hydrography map layers as a pre-processing effort prior to any model runs.
The pre-processing effort begins by using file transfer protocol (ftp) to download from the internet every zipped SDTS (Spatial Data Transfer Standard) TAR (tape archived) file in the hydrography directory of all 1:100,000-scale half quadrangles for a state. Using WinZip, the downloaded files are unzipped and extracted from TAR format. The resulting files are used in the conversion from SDTS format to ArcInfo coverages. The arc macro language (AML) program used for the conversion is called sdts2cov.aml. This program and other helpful tools for working with the SDTS format can be downloaded from the USGS SDTS Information Site, http://mcmcweb.er.usgs.gov/sdts/.
The conversion program, sdts2cov.aml, was run with the "-combine" option in order to create one ArcInfo coverage from each downloaded file. AMLs, written by project staff, select out polygon and line features from the coverages that have non-blank USGS entity label information. The selected features are separated by feature type and placed into new coverages. As a result, two coverages are created for every file that was downloaded, one coverage contains only line features with definitive attributes; the other coverage contains only polygon features with definitive attributes. Using ArcInfo’s APPEND command, all line coverages are combined to create one coverage that is the seamless map layer of hydrographic line features (e.g. streams, canals, shorelines, etc.). Likewise, all polygon coverages are combined together to create a seamless map layer of hydrographic polygon features (e.g. lakes, inundation areas, tidal flats, etc.). Quality control checks are performed at every stage of the procedure. The checks include both visual verification and database confirmation that consistency and continuity among feature attributes is being maintained throughout the process. The model uses the final two coverages as the digital representation of hydrography for the state.
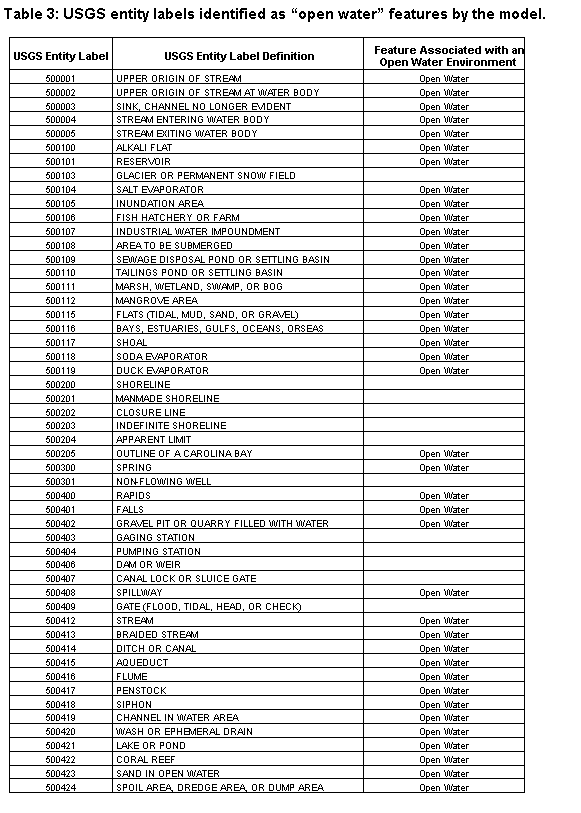
Additional pre-processing steps required for the GIS derivation of open water habitat polygons involve classifying the digital hydrographic features of the state by the entity that is mapped. Entity label attributes describe the types of features mapped by USGS DLGs. The entity label definitions of the hydrographic line and polygon features are reviewed to identify those features that are associated with an open water environment. Table 3 lists the unique entity label definitions that appear in the hydrography map layers for the three pilot test states. Table 3 also indicates which entity labels were identified as "open water" features by the model.
The entire data conversion and compilation procedure described above involved the download and processing of 264 files for California, 88 files for Louisiana, and 344 files for Texas. The significant effort required nearly 3 months of labor and computer processing time to complete.
The process of generating open water habitat polygons is only employed for EOs represented by approximated areas or points that have been assigned USA status by the model. The open water habitat polygon represents the area that is unusually sensitive due to the presence of a critically imperiled species or a species that contributes to a multi-species assemblage area (MSAA).
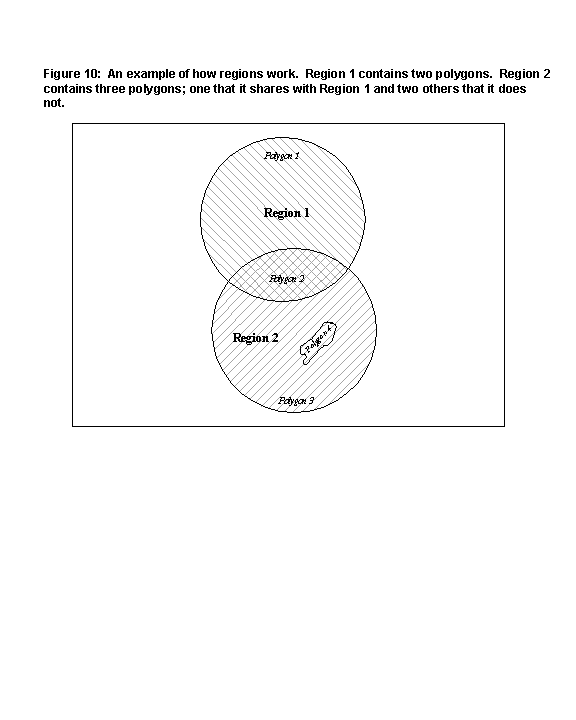
The model utilizes the ArcInfo region feature class in deriving open water habitat polygons. Regions can be used like polygons, but in contrast to polygons, regions can represent areas that overlap, such as species habitat ranges or land use types. Regions are represented as a set of polygons. See Figure 10 for an example of the way regions work.
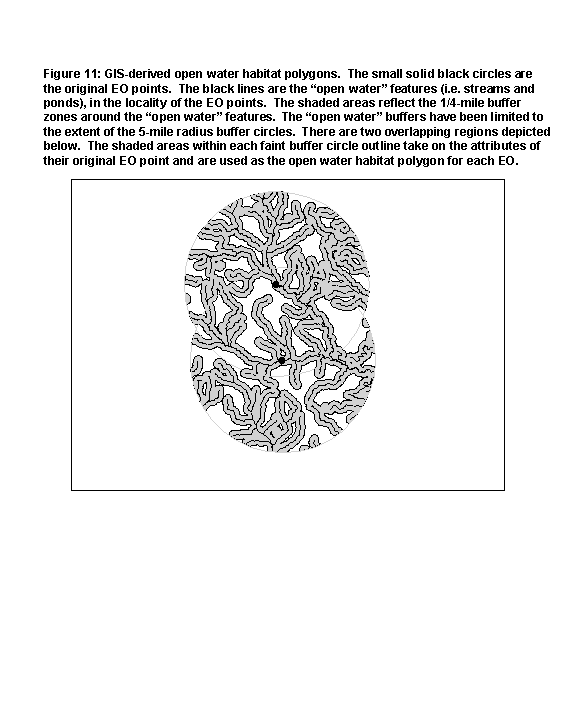
With the ArcInfo REGIONBUFFER command, a circle is generated around each of the USA-certified open water EO points using a radius of 5 miles. The 5-mile radius buffer circles are allowed to take on the attributes of the center EO points, so that the buffer circles retain the species and ranking information of their original EO. The buffer circles are then used as cookie-cutters to clip the state hydrography line and polygon coverages. The two resulting coverages contain only the hydrographic lines and polygons, respectively, that fall within a 5-mile radius of the original EO point. Only lines and polygons identified as "open water" features are selected out and placed into new coverages. In order to ensure that important riparian areas are included in the final habitat polygons, the "open water" features are buffered using a ¼ mile radius. Two polygon coverages are created from this buffering process. An attribute within the polygon coverages indicates which polygons represent a buffer zone and which are outside of the buffer zone. The polygon coverages are then unioned together. The coverage with the 5-mile radius buffer circles is used again as a cookie-cutter to limit the extent of the unioned open water buffers, so that no open water buffer polygon extends beyond a 5-mile radius of its original EO point. Finally, ArcInfo computes a geographic intersection between the open water buffers and the 5-mile radius buffer circles. The single resulting region coverage contains the open water habitat representations with attributes referencing the species and ranking information of their original EO points. Figure 11 gives a pictorial representation of GIS-derived open water habitat polygons.
To create a polygonal representation of isolated water or terrestrial habitat that offers the EO an effective protective buffer from accidental pipeline releases, the methodology calls for the derivation of a polygon that incorporates all area within a 1-mile radius around the EO point. Essentially, isolated water and terrestrial habitat polygons are 1-mile radius buffer circles.
There are three prequalification criteria and three filtering criteria defined by the ecological USA methodology. If an EO is excluded because it does not meet one or any of the criteria, it is still considered an environmentally sensitive area (ESA) and will be reevaluated in subsequent reruns of the model. EOs that are accepted by the model as ecological USA candidates, but become disqualified somewhere in the filtering process are still considered USA candidates after the model run. These EOs will also have an opportunity to gain USA status in subsequent model reruns.
There are three data quality standards that the EOs must meet in order to be considered as USA candidates.
EOs must be mappable to one minute, or greater, precision. Some NHP databases define spatial accuracy in terms of the imperial or metric system, instead of geographic (angular) units. In these cases, an EO must be mappable to within 1 mile or 1609 meters.
EOs must not be designated as historical, extirpated, or proposed for federal listing.
EOs must not be designated as communities (i.e. marshes, seeps, grassland, etc.), or other features (i.e. state trees, etc.)
Filter criterion 1 seeks to protect those species and subtaxa that have a restricted distribution due to their extreme rarity or because other factors make them especially vulnerable to extinction. A global (range-wide) conservation status rank is assigned to EOs by the Association for Biodiversity Information (ABI) using the standard Nature Conservancy data model in order to describe how rare or imperiled the EO is on a global scale. ABI is a designated lead office in the Natural Heritage Network
EOs that have been assigned a single rank of "G1" or "T1" are considered critically imperiled species by the model and hence are assigned USA status through filter criterion 1. If the EO is represented by a resource-based polygon, the resource-based polygon becomes the USA. If an EO is represented by an approximated area or a point, then the GIS model generates a representative polygon based on the habitat type of the EO as described in Sections 4.2 and 4.3. The derived polygon becomes the USA.
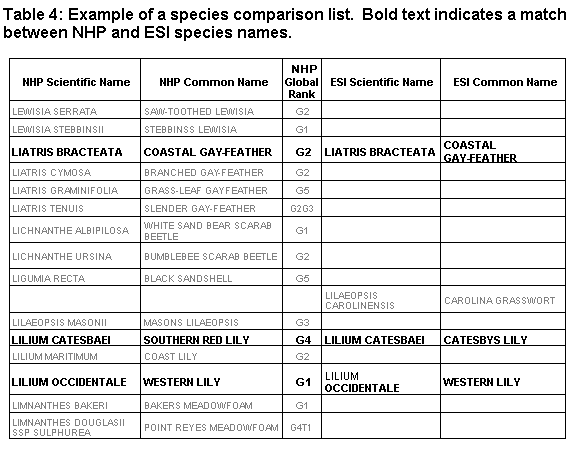
Earlier versions of ESI data sets do not include global ranks in their database structures. In order to assign global ranks to ESI species, the pilot test endeavored to match ESI species names to NHP species names in the databases of the three pilot test states. Both the species scientific name and common name were used to correlate between the two data sets. AMLs written by project staff were used to facilitate the alphabetizing of species names across the biological resource databases, namely the ESI and NHP data sets. The output of the AMLs was opened in Microsoft Excel and the correlation was performed interactively. See Table 4 for an illustration. The results of the correlation were read into ArcInfo and queries were performed to select records where an NHP match was found for an ESI species name. When an accord was found the ESI EO was assigned the global rank from its NHP match. The list of ESI species names that could not be matched was sent to ABI for global rank assignments. Some of the species names could not be ranked because they are too generalized and refer to elements at the genus level. Conservation rankings are only maintained at the species level. In other cases, the ESI EO was unable to be ranked because of the difficulties inherent in tracking oceanic species. ESI species with no global ranking information were evaluated on their federal status alone.
Due to the many variations and nuances of species naming conventions, the correlation method used for the pilot test proved unwieldy and susceptible to global ranking assignment errors. For future model runs, the technical contractors recommend that lists of all unique ESI species in a state be sent to ABI for global ranking assignments. Although, this recommendation will still introduce unranked EOs into the model, it provides desirable quality control enhancements to the model input.
Discrepancies were encountered between NHP global ranks and the global ranks listed by ABI during the validation of the state models. This could be attributed to outdated NHP attribute data or, in cases where the species in question is endemic to a state; the state NHP may actually be the global rank authority. It is recommended that global ranks of all unique species in the biological resource data sets be compared with current ranks listed by ABI to determine if there is any disparity. If incongruity exists, these species are passed to ABI and the state NHP to determine which rank is the correct one to use for the species in the state model.
In many instances, ABI has determined that there is enough uncertainty about the exact status of a taxon to preclude the assignment of a definitive global rank. Instead a variant rank may be assigned as the global rank for an EO or a rank qualifier may be appended to the surmised global rank to indicate ambiguity.
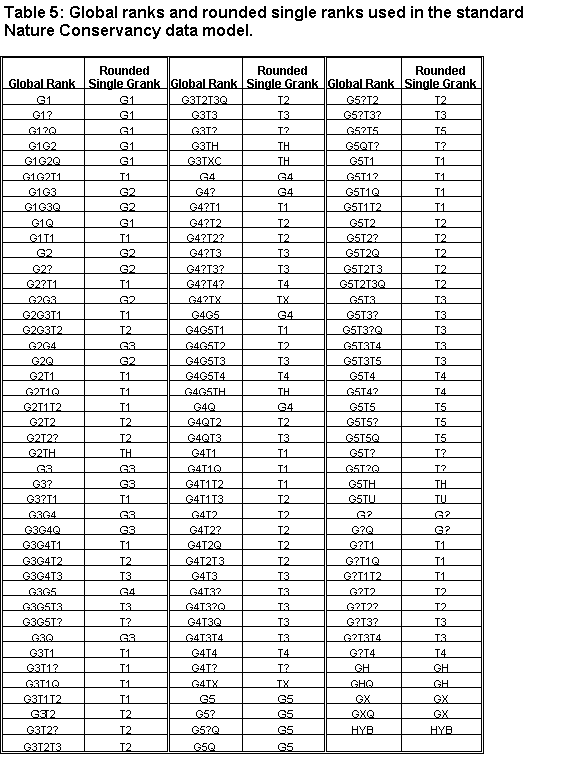
The GIS model examines the global ranks of all EOs that meet the data quality standards of the model. Unique listings of global ranks associated with the prequalified EOs are sent to ABI. The organization has developed an algorithm that performs a rounding on all ranks to reduce rank ranges and qualified ranks to a single rank. ABI ran the algorithm for the unique global ranks found in the EO databases of the three pilot test states and returned the output, so that the model could query on the rounded single rank during its USA filtering process. Table 5 lists the unique global ranks assigned to prequalified EOs in the three pilot test states. Table 5 also contains the rounded single rank returned by ABI that was queried for during the filtering process.
Filter criterion 2 strives to identify those areas where multi-species assemblages occur. The methodology describes multi-species assemblages as areas where three or more unique EOs or sites of high waterbird concentrations co-occur. The areas of co-occurrence are referred to as multi-species assemblage areas (MSAAs). The model determines which EOs will be considered under filter criterion 2 by examining the global rank and federal endangered species or depleted marine mammal listing status.
EOs with a rounded single global rank of "G1", "T1", "G2", or "T2" are considered critically-imperiled or imperiled by the model and are included as candidates in the MSAA analysis. (For an explanation of how global ranks are rounded, see Section 4.4.2.3.). EOs with a federal status of threatened, endangered, or essential experimental populations, as well as EOs that are depleted marine mammals, are also included as candidates. In addition, all filter criterion 3 candidates (i.e. the migratory waterbird concentration areas: WHSRN and Ramsar sites), are included in the process to identify MSAAs.
Using the species name correlation procedure described in Section 4.4.2.1, the species names of prequalified EOs were compared to current U.S. Fish and Wildlife Service (USFWS) species lists of threatened and endangered (T&E) plants and animals. The USFWS T&E lists can be downloaded from the internet at http://endangered.fws.gov/listdata.html. All prequalifed EOs were compared from both the ESI and NHP data sets in order to locate possible errors of omission and commission within the native databases, as well as update the static attribute information inherent to ESI data sets. Species whose federal status differs depending on the geographic location of the population were flagged and examined interactively to ascertain the appropriate federal status that should be assigned to each individual EO. The results of this correlation effort were far more successful than the similar effort undertaken for ESI global ranking assignments. This can be accredited to the detailed lists provided by USFWS and the overall accuracy of the federal status information in the ESI and NHP data sets.
In the pilot test, federal status information was updated from the USFWS T&E lists in the ASCII (American Standard Code for Information Interchange) text format. It was discovered that the ASCII text version of the T&E lists was not as current as the Adobe portable document format (PDF), available for download from the same web site. For future model runs, the ASCII text format should initially be utilized for the species comparison process, because it is easier to work with. Prior to assigning or updating federal status information, however, the PDF version should be consulted to correct any outdated statuses. This interactive process can be facilitated by using the "When listed" column of the USFWS T&E listing. The column can be searched for dates after the publication date of the ASCII text version.
The MSAA analysis requires region data as input. EOs mapped with resource-based polygons are represented by these polygons throughout the MSAA process. A 1-mile radius buffer circle is generated around the EO point for EOs originally mapped as approximated areas or points, regardless of the EO’s habitat type. The 1-mile radius buffer circles represent the USA candidates during the MSAA analysis. A standardized 1-mile radius buffer circle allows all EOs equal opportunity to contribute to a MSAA. Upon completion of the MSAA analysis, the habitat type of USA candidates with derived areas is taken into consideration in the final USA representation.
The model utilizes the element occurrence code as the "species name" for an EO in the MSAA analysis. The standard Nature Conservancy data model has assigned ten-character code to each element for data management purposes. Element occurrence codes are common to all Natural Heritage Programs within the United States and allow efficient inter-jurisdictional communication. For migratory waterbird concentration areas, the name of the WHSRN or Ramsar site is used as the "species name".
As encountered with global ranking information, earlier versions of ESI data sets do not include TNC element occurrence codes in their database structures. The effort conducted to assign NHP global ranks to ESI species was utilized to assign TNC element occurrence codes as well. As an addendum to the request that ABI assign global ranks to ESI species unmatched by the comparison procedure, element occurrence codes were also solicited. Because some of the ESI species are too generalized (referring to elements at the genus level) and due to the difficulties inherent in tracking oceanic species, some ESI EOs were not assigned element occurrence codes. The model generated a unique identifier for these EOs, based on a concatenation of the source data set and the unique species name (e.g. NOAA6113 refers to the species, "Anchoa mitchilli - Bay Anchovy"). The unique identifier is used as the "species name" for the EO in the MSAA analysis. As recommended in Section 4.4.2.1, a better solution for future model runs is to compile lists of all unique ESI species in a state and request that ABI assign both global ranking information and element occurrence codes to them.
The MSAA analysis is actually performed outside of the ArcInfo environment. Due to the repetitious query cycles and data file size constraints, it was more expeditious to run the analysis in an object-oriented programming environment. A C++ program was devised to take the output from an ArcInfo REGIONPOLYLIST command, run the analysis, and return an ASCII text file of the region number and answer, ("0" for non-MSAA contributor, "1" for MSAA contributor), for each USA candidate.
During the analysis, each USA candidate region is examined individually to determine if its area overlaps any others. If overlap is discovered, a list of "species names" associated with the overlapping areas is compiled. The "species name" of the area being examined is also added to the list. If three or more unique names are found in the list, the candidate region being examined is flagged as contributing to a MSAA and all overlapping candidates are flagged as MSAA contributors. Once a candidate region has been flagged as a contributor, it maintains this status throughout the cyclical process, regardless of the outcome of any subsequent examinations. The process is repeated until all USA candidate regions have been examined. See Figure 12 for an example of the process.
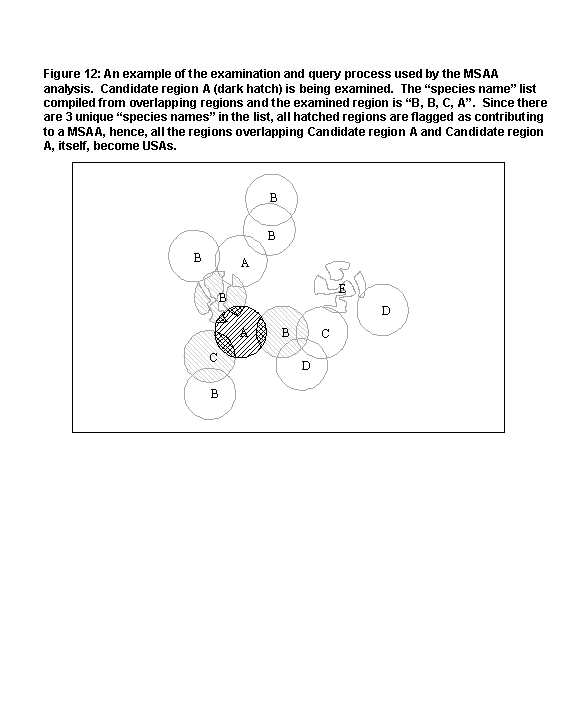
The results of the MSAA analysis are fed back into ArcInfo. EOs that have been designated as a MSAA contributor are assigned USA status by filter criterion 2.
If the EO is represented by a resource-based polygon, the resource-based polygon becomes the USA. If the EO is represented by an approximated area or a point, the model generates a representative polygon based on the habitat type of the EO as described in Sections 4.2 and 4.3. The representative polygon becomes the USA. EOs that are not designated as a MSAA contributor are still considered USA candidates and will again have an opportunity to gain USA status in subsequent model reruns.
Filter criterion 3 endeavors to protect those areas that harbor large populations of migratory waterbirds during critical concentration periods. All Ramsar sites that meet the specific waterfowl criteria and WHSRN sites that have been designated as hemispheric or international reserves are assigned USA status by filter criterion 3. WHSRN sites that are designated as regional reserves receive consideration under filter criterion 2 by being included in the MSAA analysis. Due to their regional nature, however, these reserves do not automatically become USAs.
The model accepts state public water system (PWS) data in a digital format. The water systems must have valid (i.e. non-zero) geographic coordinates in order to be accepted by the model. The PWS database should indicate the source type of the water systems (i.e. surface water source or ground water source). Ideally, the database should also indicate the system type (e.g. CWS, NTNCWS), as well as well depth information.
Source types of water systems are generally classed as surface water intakes or groundwater wells. On occasion, PWS databases may include other types of water systems, such as springs. These other water system types are researched to determine whether the state considers their supply to come from a surface or ground water source. If the source type of a water system cannot be determined, the water system is not considered as a USA candidate by the model, although it remains an ESA to be reevaluated in subsequent model reruns.
The drinking water USA model relies on statewide aquifer information to assign or validate the source aquifers of the groundwater systems. If a statewide aquifer map does not exist, aquifer outcrop and subcrop delineations can be converted into digital format from other state-accepted sources, such as surface geology or ground water basins. If aquifer delineations cannot be inferred and readily converted from existing publication sources, then the model is limited to the source aquifer information that may or may not be present in the state’s PWS database. When aquifer subcrop delineations cannot be found or inferred from a source that is in a readily convertible format, then the model uses either the aquifer outcrops as an overlay or the depth/source information of nearby wells to determine source aquifers for groundwater wells with unspecified or ambiguous source aquifer attributes.
A significant effort was undertaken to contact each public water system that had been assigned a preliminary USA status by the model. The preliminary status was assigned based on the directives in notable exception 1, filter criterion 1, filter criterion 2, and notable exception 2. Public water systems that meet these criteria were contacted personally by telephone or fax to ascertain whether they have an alternative source that is "adequate", as described in the definitions (Section 1.6).
The responses to the query ranged from explicit, detailed information to no response at all. The subjective information relayed through personal contact was manually documented, linked with its appropriate PWS ID number, and entered in Microsoft Access to create the adequate alternative source (AAS) database. In this way, structure was applied to the voluminous amount of information gleaned from the verbal or written communication. The linked PWS ID number is used as the key index field to join the AAS database with the PWS database. This enables the AAS information to be applied to the preliminary USAs to determine their final USA status.
For the pilot study, public water systems that stated they did not have an alternative source or that their alternative source could only provide water for periods of one month or less became USAs. Public water systems that stated they have a source that can provide water for periods longer than one month were not designated as USAs, but remain USA candidates to be reevaluated in later model runs. When a contact could not be made with a PWS or the information received was too ambiguous to decipher, the PWS is considered a USA candidate and has an opportunity to become a USA in future runs of the model.
The greatest challenge the drinking water USA model faces is determining the type of aquifer (vulnerable or non-vulnerable) that each groundwater system sources. One of the key data used for classifying groundwater wells is the source aquifer information listed for each well. The model’s main process focuses on validating the listed source aquifer information. When a validation cannot be made due to unspecified or ambiguous listed information, the model attempts to assign a source aquifer to the groundwater system.
The model makes use of a source aquifer lookup table that assigns each groundwater well to one of the standardized aquifer names referenced by the USGS Groundwater Atlases. The table is necessary because of the variability in the level of geologic detail used in describing the aquifers as well as regional differences in the names of aquifers. For example, in the case of the pilot test state,Texas, 660 separate geologic unit descriptions were collapsed to 23 aquifers names.
In the pilot test, the source lookup table for the Texas PWS data is a combination of the Aquifer Code Master Listings from the Texas Natural Resources Conservation Commission (TNRCC) and the Texas Water Development Board. Each aquifer code is assigned one of 23 aquifer names based on a project geologist’s interpretation of the aquifer description. Sometimes a standardized aquifer name cannot be inferred from an aquifer code due to a lack of information in the description for the aquifer code. This dilemma (and the fact that some groundwater wells do not have an aquifer code) results in a number of wells that are not assigned a standardized aquifer name. For these wells, source information (if available) is obtained from the supplemental public water system database. See Table 6 for an example of the Texas source aquifer lookup table.
The Louisiana source aquifer lookup table is from a unique list of source name descriptions associated with the PWS data. Each description is then assigned one of 10 standardized aquifer names based on a project geologist’s interpretation of the aquifer description.
In California, a source aquifer lookup table was not used, because the PWS data contained no source aquifer information.
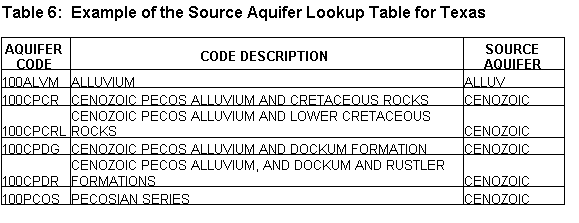
Attributes present in a state’s PWS database take precedence over any deductions the GIS model may infer during processing. ArcInfo selects the groundwater wells with source aquifer information from the PWS database and then overlays the "state-accepted" digital aquifer map onto the subset of groundwater wells to verify if the wells fall within their specified source aquifer. The following rule set guides the validation process:
If a geographic intersection is not verified and the digital aquifer map includes both outcrop and subcrop delineations, then the source aquifer for the groundwater well cannot be validated.
If a geographic intersection is not verified and the digital aquifer map contains only outcrop delineations, then the well’s location and depth are interactively evaluated for concurrence with the outcrop or subcrop description of the source aquifer specified in the PWS database. The results of the evaluation should be documented for each PWS considered, in order to facilitate any subsequent reviews of the interactive process. If concurrence is established, then the model infers that the groundwater well sources its specified aquifer.
If concurrence cannot be established, but the well’s depth is greater than 0 and less than or equal to 50 feet, the groundwater well is inferred to draw from a surficial or shallow, permeable aquifer, (Class I as defined by Pettyjohn et al., 1991). (See Table 2.)
If concurrence cannot be established and the well’s depth is unknown, 0 or greater than 50 feet, the model flags the well with "Source Aquifer Cannot Be Determined".
In some cases, the PWS database contains no source aquifer information or the information exists, but it is too obscure to use reliably. The source aquifer assignment process is only applied to groundwater wells with attributes that fit this description. As in the source aquifer validation procedure, the GIS model selects the groundwater wells with unspecified or ambiguous source aquifer attributes and overlays the "state-accepted" digital aquifer map onto the subset of groundwater wells to establish a geographic relationship between the wells and aquifers in the state. Depth information is used to validate deductions made during the source aquifer assignment process. When depth information is not available, the GIS model relies solely on the groundwater well’s location in relation to the aquifers for its deductions.
The source aquifer assignment procedure is as follows for PWS databases that contain no source aquifer information.
If depth information is available for the top and bottom of the aquifers, then the well’s depth is evaluated for concurrence with the prescribed depth range of the aquifer it intersects. If concurrence is established, then it is inferred that the groundwater well sources the intersected aquifer. When the digital aquifer map includes both subcrop and outcrop delineations, there is a possibility that the well may intersect more than one aquifer. If there is concurrence with the depth range of more than one aquifer, then the well is inferred to source the shallowest aquifer (Class I as defined by Pettyjohn et al., 1991). (See Table 2.)
When depth information is not available for the top and bottom of the aquifers or depth information is not included in the PWS database, the number of intersected aquifers is evaluated. If only one aquifer was intersected, then it is inferred that the groundwater well sources the single intersected aquifer. Otherwise the well is flagged with "Source Aquifer Cannot Be Determined".
When source aquifer information is included in the PWS database, the model looks at the number of intersected aquifers, the well’s depth, and the source aquifers and depth information of the groundwater wells near the well being examined.
If the well intersects one aquifer, the depth of the well is evaluated for concurrence with the description of the part of the aquifer that was intersected (either the outcrop or subcrop). If concurrence is established, then it is inferred that the groundwater well sources the intersected part of the aquifer.
If concurrence cannot be established and the digital aquifer map contains both outcrop and subcrop delineations, the well is flagged with "Source Aquifer Cannot Be Determined".
If concurrence cannot be established and the digital aquifer map contains only outcrop delineations, the model calculates a search radius based on 1/10th of the diagonal of the map extent of the intersected aquifer outcrop. Groundwater wells with source information that fall within the search radius are selected. If the well has a depth greater than zero, the selected set is limited to only groundwater wells with source information that have depths within a 10 percent range of the depth of the well being examined. If the well has no depth information, no refinement is made to the selected set. The GIS model then evaluates source aquifer information for all the wells in the selected set. If the well has a depth greater then 0 and at least 90 percent of the wells specify the same source aquifer, the groundwater well is inferred to draw from this aquifer. If a consensus does not exist for the source aquifers, but at least 90 percent of the wells draw from a vulnerable aquifer, (Class I or IIa, per Pettyjohn et al., 1991), or a non-vulnerable aquifer, (Class IIb, IIc, or III, per Pettyjohn et al., 1991), then the groundwater well is inferred to draw from the same aquifer type as the 90 percent or greater consensus. If no consensus can be established, the well is flagged with "Source Aquifer Cannot Be Determined". If the well has no depth information, the same conditional tests are applied, but the consensus must be 100 percent.
If the well intersects two or more aquifers, the model determines the area common to all aquifers that the well intersects. (See Figure 12.) The model then calculates a search radius based on 1/10th of the diagonal of the map extent of the common area, (Figure 13). Groundwater wells with source information that fall within both the common area and the search radius are selected. Selection refinements based on depth information and conditional tests of depth and aquifer classification consensus are applied in the same manner as described above when only one aquifer is intersected.
If the well intersects no aquifers, or concurrence cannot be established from the previous evaluations, but the well’s depth is greater than 0 and less than or equal to 50 feet, then the groundwater well is inferred to draw from a surficial or shallow, permeable aquifer (Class I, per Pettyjohn et al., 1991). If the well’s depth is unknown, 0 or greater than 50 feet, the model overlays an EPA-approved digital sole source aquifer map onto the well. If the well falls within a sole source aquifer, the groundwater well is inferred to draw from the sole source aquifer. Otherwise, the well is flagged with "Source Aquifer Cannot Be Determined".
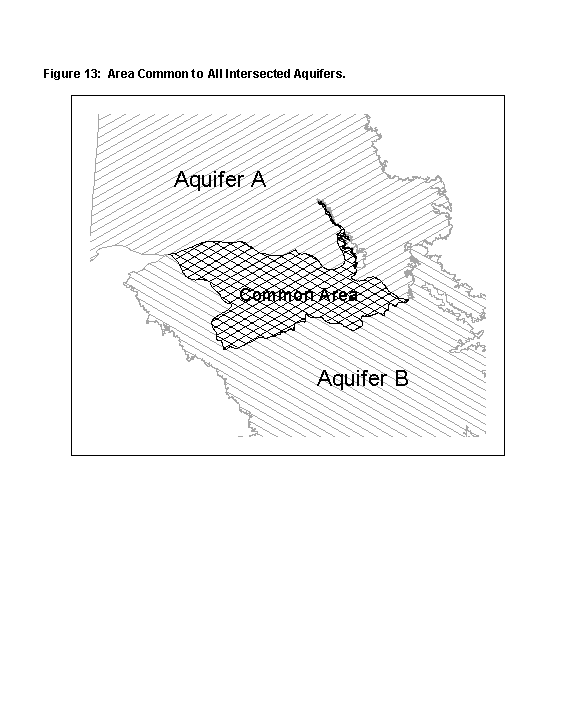
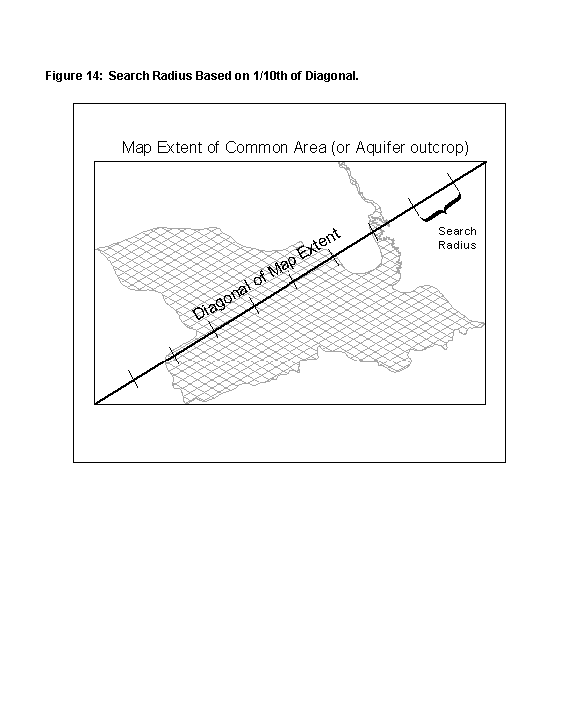
There are three filter criteria and two notable exceptions defined by the methodology. If a water system is excluded because it does not meet one or any of the criteria, it is still considered an environmentally sensitive area (ESA) and is reevaluated in subsequent reruns of the model. Drinking water systems that are accepted by the model as USA candidates, but become disqualified during the filtering process are still considered USA candidates after the model run. These systems will also have the opportunity to gain USA status in subsequent model reruns.
Notable Exception 1 identifies public water systems that are transient, non-community water systems (TNCWS). These systems are not designated as USAs, but remain as USA candidates that will be reevaluated in subsequent reruns.
Per the EPA, the accuracy of SDWIS classification of Public Water Systems into the three categories of CWS, NTNCWS, and TNCWS is good, but as with any such database the specific accuracy of a particular entry depends on the quality of that state's data input program.
As there are no readily available, national databases on which this filtering criteria could be applied, the existence of adequate alternative sources must be determined on a case-by-case basis for each CWS/NTNCWS, either through the appropriate state agencies or individual Public Water Systems.
The California PWS data do not contain specific information regarding the type of supply. However, some systems indicate the number of people served. Water systems that indicated they serve less than 25 people are treated as TNCWS by the model.
The Louisiana PWS data do contain specific information regarding the type of supply. The field, SYSTEMTYPE, contained a one-letter code denoting whether the system was a CWS, TNCWS, or NTNCWS.
The Texas PWS data was received in two parts: a public water supply sources ArcInfo point coverage which contains well locations, source aquifer, and source type (ground or surface); and a public water systems data file containing the contact information, a second set of source aquifer information, and the type of supply (CWS, TNCWS, or NTNCWS). To determine which wells in the point coverage are considered transient non-community, the two data files were related in ArcInfo. Both files contain a public water system id (PWS_ID), but the water system data file contains multiple records for the same PWS_ID differentiated by plant identifiers (see Table 7). Unfortunately, the water supply coverage does not contain any plant identifiers. Because of this incongruity, only records in the water system database where the same PWS_ID lists a unique type of supply (CWS, TNCWS, or NTNCWS) were selected by the model.
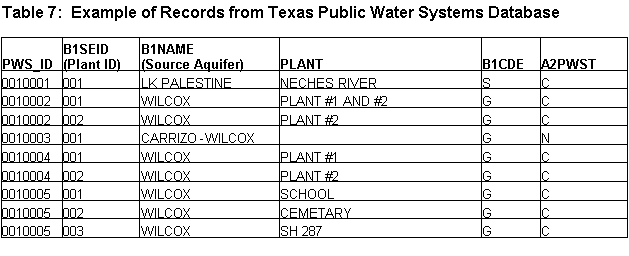
Filter criterion 1 identifies surface water systems that have no adequate alternative source of water. Surface water intakes are typically represented as points. In order to provide an area of protection for intakes, all open water features within a 5-mile radius of the surface water system are selected and buffered 1/4-mile inland to represent the USA. This procedure is the same one used to derive the ecological USAs dependent on open water habitat. The process is more fully discussed in Section 4.2.
All three pilot test states contain fields in the PWS data set that denote surface water systems, so this criterion was able to be applied equilaterally by the model.
Filter criterion 2 identifies groundwater systems that are considered vulnerable to contamination. If a groundwater system sources a vulnerable aquifer and has no adequate alternative source of water, the system is assigned USA status. The system’s WHPA becomes the USA. If a WHPA has not been established for the system, a protective buffer is generated around the system using a 2000 feet radius, as prescribed by the methodology. The 2000-feet radius buffer circle becomes the USA. Groundwater systems sourcing non-vulnerable aquifers remain as USA candidates and are reevaluated in subsequent model runs.
The key to identifying vulnerable groundwater systems is distinguishing those systems that obtain their water from Class I or Class IIa aquifers (Pettyjohn et al., 1991). A primary consideration is the location of the well with respect to the aquifer outcrop or subcrop. For some aquifers, the aquifer outcrop belt is Class I or IIa (see Table 2), whereas the subcrop belt of the aquifer is Class III, because the aquifer is overlain by a confining unit.
To aid in the process of classifying groundwater systems with a aquifer class, guidelines or screening rules were developed for each state that list the classification for systems based on the location of the well (outcrop/subcrop), well depth, and overlying surface geology. Below is an example of a guideline for the state of Louisiana.
"4) The Alluvial/Valley Trains aquifer system is composed of Quaternary braided stream deposits overlain, in some areas, by loess deposits. The aquifer consists of unconsolidated and highly permeable sands. Wells deriving water from this aquifer are Class Ia USAs and can be no deeper than 250 ft. When covered with loess, wells are Class Id and can be no deeper than 300 ft., because the loess is an impermeable layer, usually less than 50 ft. thick."
The guidelines are developed based on the known characteristics, the geographic relationships, and the attribute information of the groundwater wells, the aquifer boundaries, and the surface geology. Sometimes, all this information is not available to aid in defining a set of screening criteria. For example, the California PWS data does not provide depth information for wells. In this case, the guidelines for the pilot test of California were developed solely on aquifer geologic characteristics and the geographic relationship between the groundwater wells and the overlying surface geology maps.
Once the guidelines are developed an ArcInfo lookup table is created based on the information. The model steps through each record in the guideline table, selecting wells that meet the screening criteria for that record and classifying the groundwater wells accordingly, (see Table 8).

Notable exception 2 identifies groundwater systems that are not considered vulnerable to contamination. This identification is based on the aquifer classification of each groundwater system as defined by Pettyjohn et al. (1991). (See Table 2.) Groundwater wells identified as sourcing a non-vulnerable aquifer are not considered USAs by the model. They remain as USA candidates, however, and will have the opportunity to gain USA status in later model runs with the advent of updated and more detailed attribute information from the various drinking water data sources.
Filter criterion 3 provides extra protection to groundwater systems that are located within the boundary of a sole source aquifer. For groundwater systems that are located within a sole source aquifer the model has two options for delineating protection areas depending on the type of WHPA defined for the system.
- If a groundwater system has a fixed-radius WHPA, then the radius of the WHPA is doubled to provide more protection for the groundwater system.
- If a groundwater system has a zone-defined WHPA, then the zone-defined WHPA represents the protection area for the system.
For the pilot study both Louisiana and Texas provided fixed-radius WHPAs. Louisiana designates a 2-mile radius WHPA in unconfined aquifers and a 1-mile radius WHPA in confined aquifers. Texas has established various fixed-radius WHPAs that are applied directly to each groundwater system through a link on the PWS ID number. WHPAs were not provided for California at the time of the model run, thus a default fixed-radius of 2000 feet was used to define WHPAs, as described in the methodology.
Correll, D.S. and H.B. Correll. 1975. Aquatic and Wetland Plants of Southwestern United States. Environmental Protection Agency Research and Monitoring.
Dobson, A.P., J.P. Rodrieguez, W.M. Roberts, and D.S. Wilcove. 1997. Geographic distribution of endangered species in the United States. Science 275:550-553.
Ehrenfeld, D.R., R.F. Noss, and G.K. Meffee. 1997. Letter to the editor. Science 276:515-516
Federal Register. 1999. 64 FR 250: 73464.
Flather, C.H., L.A. Joyce, and C.A. Bloomgarden. 1994. Species Endangerment Patterns in the United States. USDA Forest Service General Technical Report RM-241. Fort Collins, CO.: U.S. Department of Agriculture, Forest Service, Rocky Mountain Forest and Range Experiment Station.
Flather, C.H., M.S. Knowles, and I.A. Kendall. 1998. Threatened and endangered species geography: Characteristics of hot spots in the conterminous United States. BioScience 48:365-376.
Halls, J., J. Michel, S. Zengel, J.A. Dahlin, and J. Petersen. 1997. Environmental Sensitivity Index Guidelines, Version 2.0. NOAA Technical Memorandum NOS ORCA 115. Hazardous Materials Response and Assessment Division, National Oceanographic and Atmospheric Administration, Seattle, Wa. 79 pp. + appendices.
Harrington, B. and E. Perry. 1995. Important shorebird staging sites meeting Western Shorebird Reserve Network criteria in the United States. Report of U.S. Fish and Wildlife Service, Washington, D. C.
Kiester, A.R., J.M. Scott, Csuti, R.F. Noss, B. Butterfield, K. Sahr, and D. White. 1996. Conservation prioritization using GAP data. Conservation Biology 10: 1332-1342.
Master, L.L. 1991. Assessing threats and setting priorities for conservation. Conservation Biology 5:559-563.
Pettyjohn, W. A., M. Savoka, and D. Self. 1991. Regional Assessment of Aquifer Vulnerability and Sensitivity in the Conterminous United States. U.S. Environmental Protection Agency, Robert S. Kerr Environmental Research Laboratory, Office of Research and Development, EPA/600/2-91/043.
Scott, J.M., B. Csuti, J.D. Jacobi, and J.E. Estes. 1987. Species richness: A geographic approach to protecting future biological diversity. BioScience 37: 782-788.
Stein, B.A., L.S. Kutner, and J.S. Adams (eds). 2000. Precious Heritage: The Status of Biodiversity in the United States. The Nature Conservancy. Arlington, VA.
The Nature Conservancy (TNC). 1996. Conservation by Design. The Nature Conservancy. Arlington, VA.
_______. 1996. California Natural Diversity Database, GIS Metadata. California Department of Fish and Game, Natural Heritage Division. Sacramento, California.
_______. 1997. Designing a Geography of Hope: Guidelines for Ecoregion-Based Conservation in the Nature Conservancy. The Nature Conservancy. Arlington, VA.
_______. 1999. Resolution VII.11. Strategic Framework and guidelines for the future development of the List of Wetlands of International Importance. Seventh Conference of the Contracting Parties (COP7), Convention of Wetlands (Ramsar, Iran, 1971). San Jose, Costa Rica.
Authors:
Bonnie Freeman