This paper presents the applications of an integrated GIS and MATLAB system in several groundwater studies for Dutch Watercompanies. A recent study in the province of Utrecht proved that time and money can be saved by applying these integrated systems instead of using a conventional approach with existing groundwater modelling software. The integration of GIS and MATLAB is based on open dataformats and standards and may be used for many other application areas, especially where modelling in 3D and 4D is involved.
Kiwa Research and Consultancy is the knowledge centre for water and associated ecological and environmental questions in The Netherlands. Kiwa is responsible for scheduling and conducting the joint research for Dutch water companies. Over the past 30 years expertise has been built up in diverse areas including hydrology, ecology, process technology and distribution technology. Since 1989 also GIS-technology has been used to support our core competence: the integration of these various fields of knowledge to develop innovative tools and concepts for adequate support of our customers.
In our daily work we have to deal with a broad range of data sources and formats and very different questions to solve. In the Netherlands a wide variety of groundwater modelling software is used. Among the finite-difference models the most commonly used is Modflow. Finite-element models Triwaco and MicroFem are also widespread. Manipulations are often necessary to exchange data from one model to the other. Therefore flexibility of our software tools is very important.
This paper illustrates why we have chosen to face some groundwater modelling challenges using GIS and MATLAB.
Some hydrologists have chosen not to be 'confined' to existing software for numerical groundwater modelling. They want to experiment more with analytical solutions for specific problems. Kees Maas and Theo Olsthoorn were pioneers in using MATLAB software (the MathWorks) to solve simple and complex hydrological problems in their daily work (Maas et al., 1997).
MATLAB stands for 'MATrix LABoratory'. It handles a range of computing tasks in engineering and science, from data acquisition and analysis to application development. The MATLAB environment integrates mathematical computing, visualization, and a powerful technical language. It is used in a variety of application areas, including signal and image processing, control system design, earth and life sciences, finance and economics, and instrumentation.
Because the data is stored in matrices of multiple dimensions a quick data access in 3D and 4D is also possible.
In many ways the evolution of MATLAB resembles the evolution of GIS, although in most application areas it has made a quicker transition from the universities to the industries. However, this does not hold true for applications in hydrology. This is due to the fact that hydrologists have built their models with the existing (numerical) modelling software. All their site-specific knowledge has been fed into these models, making them very valuable. There is an ongoing trend however to put this knowledge into GIS so they become available to a broader group of (potential) users.
Some problems may be tackled effectively with GIS techniques whereas others are more suitable for processing with MATLAB tools (e.g.3D and 4D modelling and visualization/animation). For these purposes a lot of AML's, Avenue scripts and MATLAB m-files have been developed over the past years.
Heinzer et al. distinguishes three levels of integration ranging from model centric to GIS centric approaches. Partial integration uses GIS only for certain aspects of model parameter input. Encapsulated Integration is when GIS 'wraps' around a model and a GIS user and data-interface for the model exists. Embedded integration is when the solution algorithms are programmed within the GIS language.
We have used the embedded form in case of our hydro-ecological model NICHE® (Nature Impact of Changes in the Hydrological Environment) which predicts effects on vegetation after hydrological measures or changes in landuse. Actually this embedded integration was a logical step because no technical model and software implementation existed at the time we started developing it in 1994.
Throughout the years we have solved many little and a few big hydrological modelling problems with a project-specific partial or encapsulated integration using ArcInfo, ArcView and MATLAB. This was only possible after thorough discussions about which part of the processing or modelling could better be done either by GIS or by MATLAB. Only then it became clear which data to exchange, when and in which format. Although the results were satisfactory most of the times a general approach was still missing and we started to look for means to integrate on another level.
We realized that we would be able to make a generic interface which we could effectively use in various (future) projects once we developed a simple method to define the 'links' we wanted, make m-files to read and write shapes and grids and establish simple means of communication between both applications. The close cooperation between GIS expert and hydrologist/MATLAB expert has led to the development of a valuable tool: the ArcView - MATLAB interface.
The components currently making up the integration of ArcView and MATLAB are:
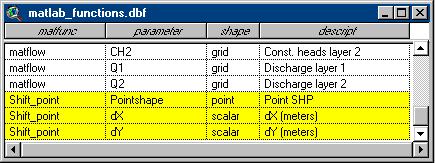
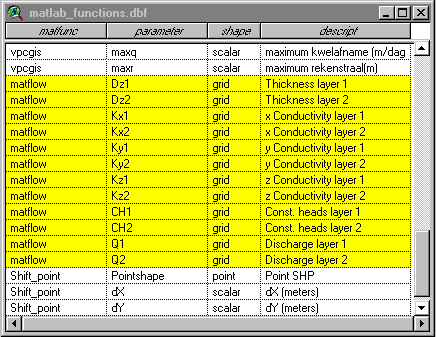
We will first use a simple example to illustrate how the integration works. Suppose we want to shift a point shape file with a certain dX and dY. First define what data we need to exchange; this is a point SHP and scalars for dX and dY. Therefore we add 3 records to the "matlab_functions.dbf" defining this new function which we call "Shift_point"

The [matfunc] field is used to call the appropriate MATLAB m-file, the [parameter] field is used to name the variables used in Avenue as well as in the m-files. The field [shape] tells ArcView and MATLAB what kind of data to expect (currently: scalar, grid, point, polyline, polygon and attributes of shapes). The field [descript] contains the description which will be displayed in the interface. Already the ArcView dialog will be able to display this function and when a shapefile of type point is available in the active view it will be listed in the combobox. The user can fill out the dX and dY values in the textline controls on the dialog.
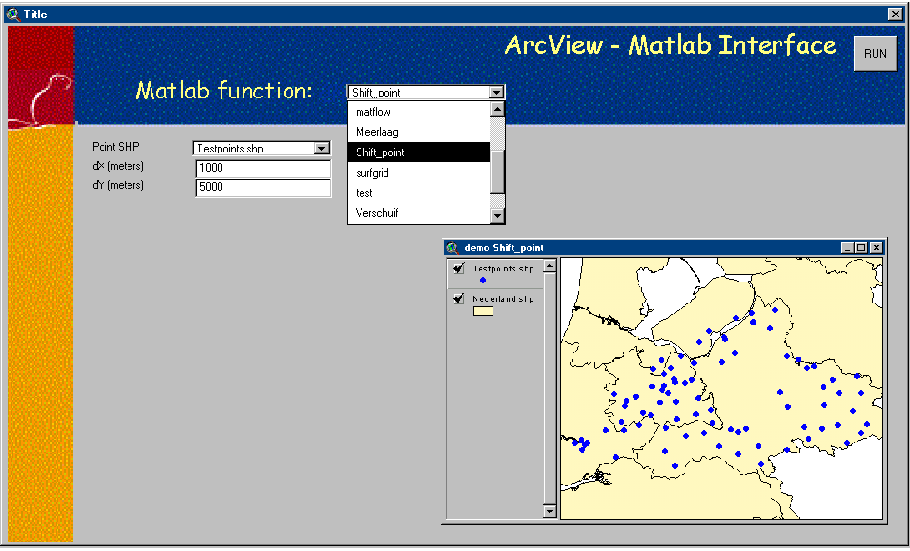
Now a MATLAB m-file called "Shift_point.m" is required doing the XY-shift when the "RUN" button is activated. Because it is not available yet we will create it:

In this case the original shapefile will be overwritten. Naturally a new shapefile may also be produced instead. If the RUN option is chosen and all parameter values are defined the file av2mat.txt is generated to instruct MATLAB what to do.

Now ArcView hands over the control to MATLAB. MATLAB interprets the above and carries out the job. When finished it writes mat2av.txt and the control is given back to ArcView.

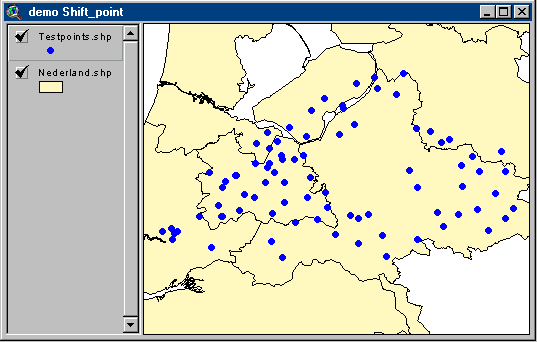
ArcView reads this line file. The word 'shp' is recognized as a keyword after which the complete pathname to the sourcefile is given. The result of the shift is shown in the next figure.
Other keywords may be 'grid' or 'error'. In the case of an error a message from MATLAB will display in an ArcView message box.
Where can we withdraw good quality groundwater for the production of drinking water in the province of Utrecht without endangering groundwater-dependant vegetation? That was an important question in 1999 for Hydron Midden Nederland. This Dutch watercompany had to draw new plans for producing drinking water from new groundwater sources as some of the existing production wells were located in or near nature-conservation areas. Eventually these production wells will have to move due to government regulations. It was necessary to depict areas for further, more in-depth, studies within a few months time.
There was not enough time to run the existing numerical groundwater models on approximately 720.000 scenarios (eight capacity scenarios times 90.000 possible well locations). An analytical solution was already available in MATLAB. Since all the hydrological parameters of the confined aquifer system could easily be converted from the Triwaco models to polygon SHP-files, the most logical step was to combine these efforts into an integrated system ready to run this large number of scenarios. Together with the provincial government of Utrecht and Kiwa the following approach was defined.
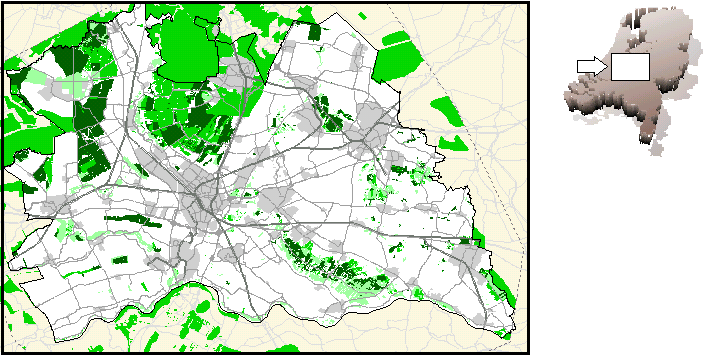
Figure 4 shows nature areas in the province of Utrecht and its vicinity. Three shades of green indicate the sensitivity of the vegetation to changes in groundwater table; dark green represents the most sensitive vegetation types.
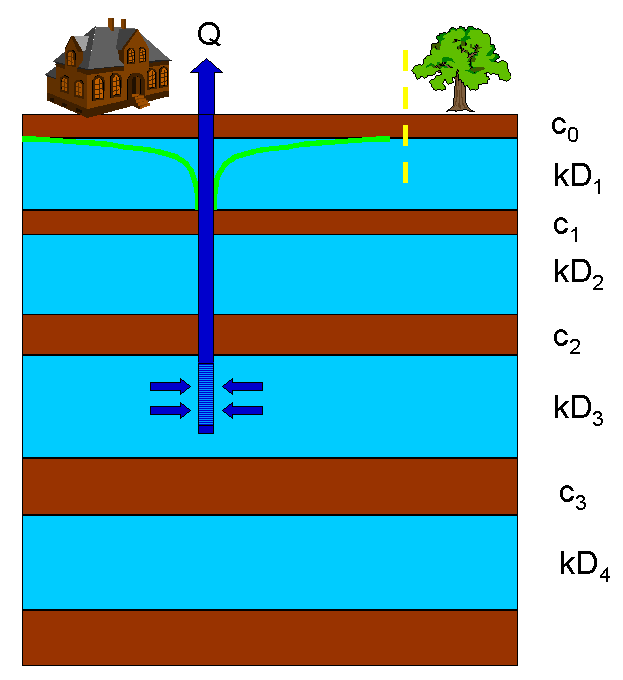
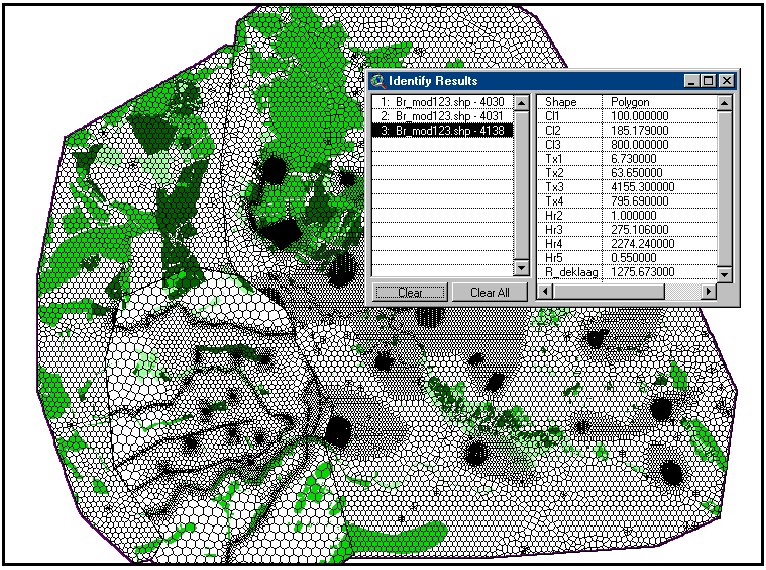
The subsurface may be schematized as shown in figure 5. Here four waterbearing sandlayers are shown confined by clay and loam deposits. The yellow line demarcates the zone were the seepage loss becomes less then 0.2 mm per day. When the yellow line 'hits' the border of a nature area, the proposed well-site must be rejected. The distribution of all hydrological parameters were converted from polygon shapes (figure 6) into a 'stack' of GRID themes. These themes formed the input to the model in MATLAB. For each scenario a calculation was made using the ArcView - MATLAB integration.
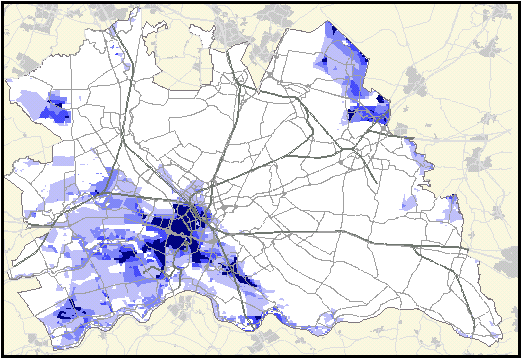
After 16 hours of calculation time the final results were available in GIS. The map below shows a compilation of the eight output scenarios. In areas that are shaded dark-blue further studies can be undertaken to look for a site where 10 Million m3/year can be withdrawn without effecting nature areas. Lighter shades of blue indicate a potential annual capacity of 7.5, 5 or 2.5 Million m3.
If conventional numerical modelling would have been used for this 'scan' the total processing time would have been much longer. Using the possibilities of ArcView and MATLAB we were able to produce a true 'quick-scan' and cut the costs of the project considerably.
The hydrologist accustomed to MATLAB will also be challenged to program MODFLOW in an m-file. Frans Schaars was and came up with 20 lines of code in Matflow.m. Input to MATFLOW must consist of regular grids. We have produced an example of a two layer model:
We have used a polyline shapefile to model a river with a constant head (=3) and a point shape representing a well with a discharge of 1. Then we used Spatial Analyst to convert these shapes to regular grids and added some grids with constant values of Ones, Zeros, 0.1, 0.001 and also a Nodata-grid to serve as input to MATFLOW.
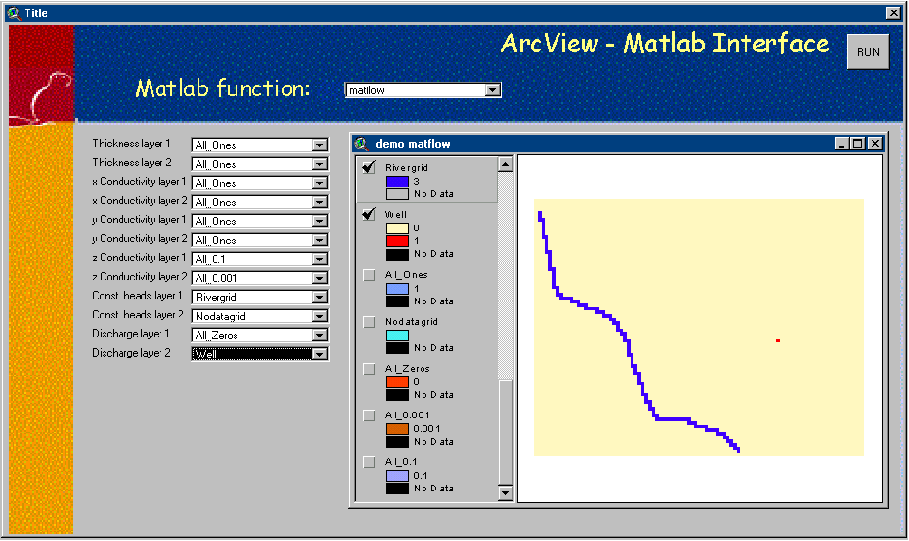
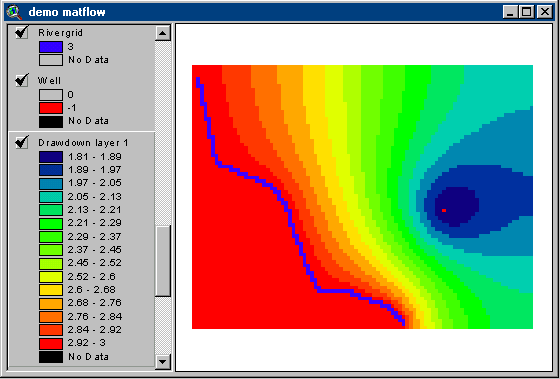
The results after execution of MATFLOW with above parameters set is shown below.
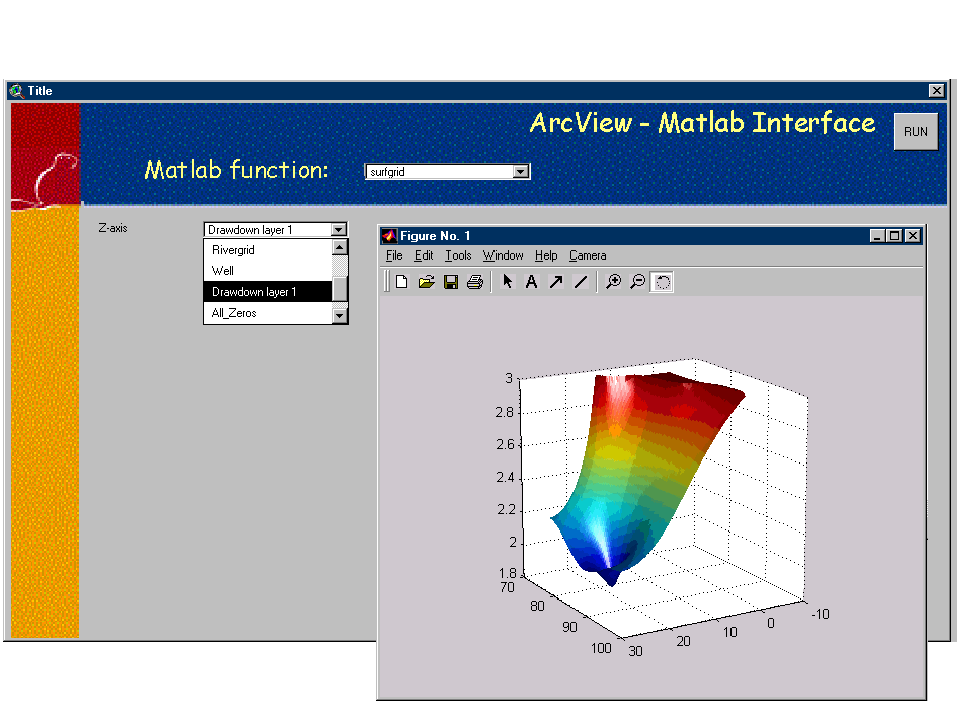
We may use MATLAB again to look at a 3D surface plot of this drawdown pattern. This is a standard function in MATLAB and takes a grid as input.
In 1998 the model SPREAD® (Solute Prediction from Regional distributed Agricultural Deposition) has been developed. The model predicts the mass-balance of nutrients (Nitrogen and Phosphorous) based on statistical data of manure and fertilizer use over the years combined with changes in land use, soil and hydrologic conditions. Concentrations of compounds in the soil and shallow-groundwater are predicted and may be used as input to transport models to estimate the quality of groundwater at an abstraction well. The model is implemented in ArcView and MATLAB. ArcView handles the data selection, polygon overlays, data aggregation and visualization. MATLAB routines predict the loads of the compounds per hectare, the concentrations in the unsaturated zone and in the phreatic groundwater taking into account biochemical processes such as denitrification.
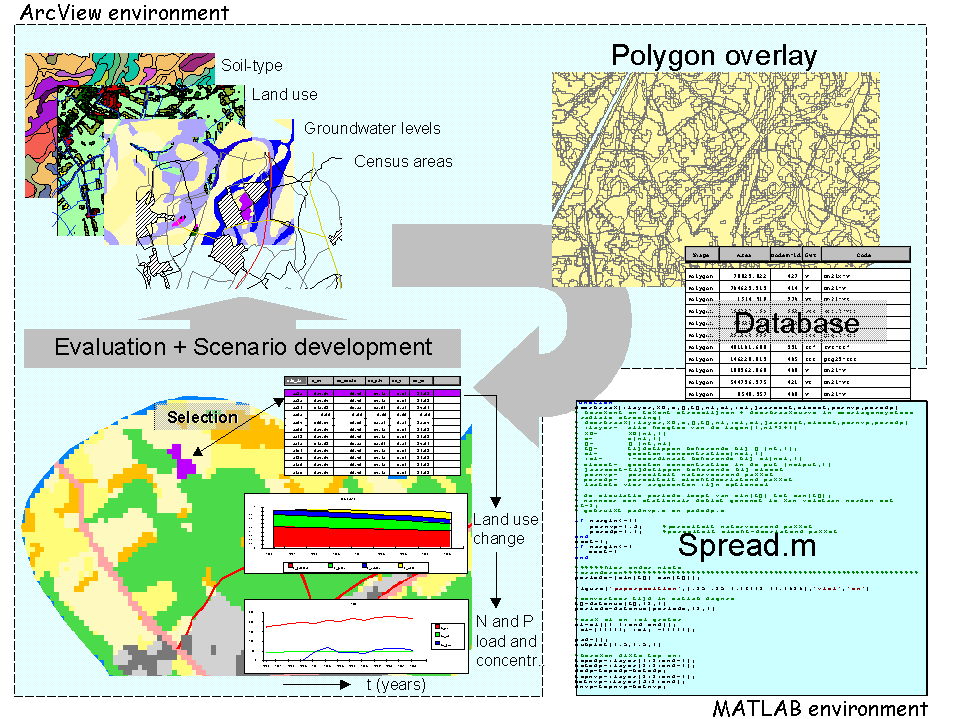
Together with Artesia and RIZA (Institute for Inland Water Management and Waste Water Treatment, The Netherlands) we are currently working on extending SPREAD® to predict the surface water quality. Therefore interaction with other unsaturated zone, groundwater and surface water models is necessary.
With the transition to ArcGIS 8.1 it becomes obvious that we want to rebuild the integration using the ActiveX technology. In doing so we expect to achieve even more flexibility. It will be possible to call ArcGIS COM objects from MATLAB and vice versa. The end-user will not have to be bothered with switching from application to application. We plan to extend the functionality of the interface e.g. dealing with multiple model-layers. We also want to extend the possibilities of the integration to facilitate 3D and 4D modelling applications.
For the time being the current methods used offer great possibilities, taking optimal advantage of both ArcView and MATLAB. Also the flexible interface tool built in Arcview is applicable to a wide variety of Avenue scripts developed over recent years. Once input (and output) are registered in a definition file like "matlab_functions.dbf" the interface may be used to address and run Avenue scripts.
The integration of GIS and MATLAB brings complex modelling closer to the end-user and the decision-maker. The hydrologist modelling in MATLAB benefits from presentation and accessiblility through ArcView while the GIS expert benefits from the powerful calculation, visualization and animation options offered by MATLAB.
Heinzer, T.J., M. Sebhat and B. Feinberg. 1999. Integrating Geographic Information Systems to Hydraulic Models: Methods and Case Studies. Esri User conference proceedings 1999.
Maas, C and Olsthoorn, T. 1997. Snelle oudjes gaan MATLAB (Golden oldies go MATLAB). Stromingen 3/4, p21-42.
N.V. Waterleidingbedrijf Midden-Nederland (Hydron Midden-Nederland). 1999. Vervangende Productie Capaciteit, bundeling technische deelrapporten. Technical reports 1 and 5.
The MathWorks, Inc. 2000. Using MATLAB, Version 6.
Frans Schaars
Martin Griffioen