The need to deliver presentations to a multitude of classrooms, in a cost efficient, time-sensitive manner initially drove our efforts in creating the 2000 GIS Day web cast event. With schools from Oregon to Florida logging into the Internet web cast, we catered to a projected audience of over 2,000 students, teachers, and other interested parties on GIS Day. In the end, there was simply no better way to implement a task of this scale.
Recognizing the promise of Geographic Information Systems (GIS) in public schools first promoted the collaboration between the KanCRN Collaborative Research Network (KanCRN – http://kancrn.org) and the Kansas Data Access and Support Center (DASC – http://gisdasc.kgs.ukans.edu).
The Data Access and Support Center (DASC) was created by the State of Kansas GIS Policy Board in 1991 and is located at the Kansas Geological Survey (KGS) at the University of Kansas. The DASC serves at the state's GIS data clearinghouse and is a node on the National Spatial Data Infrastructure (NSDI). The governor established the Kansas GIS Policy Board in 1989 to develop Kansas GIS technology management policies and direct the Kansas GIS Initiative. The GIS Policy Board consists of representatives from state, federal, and local government, and the private sector.
The Kansas Collaborative Research Network, a United States Department of Education Technology Innovation Challenge Grant, is a curriculum project that attempts to fulfill the vision of national efforts to reform science and technology education. The KanCRN community uses technology to facilitate communication between the participants through the KanCRN web site with discussion areas, research protocols, data submission and retrieval from interactive databases, background information on the research areas and a publication area for students to submit their own research work. As of June 1, 2001 the KanCRN Community had nearly 1,000 registered teachers in 48 states and a dozen countries. A special interest group at KanCRN related to GIS in education has grown to over 300 members, one of the largest in the nation.
On the whole, the web cast series began with an introduction of sponsoring organizations and then proceeded into an overview of GIS and its uses. Participants were then ushered through a legitimate scenario where GIS could be used. Several ArcIMS maps where created to support this example and to expand the user's holistic understanding of the possibilities of digital mapping in and out of the classroom. The prescribed web cast sequence presented concepts in logical fashion where application and use of the concepts was the ultimate goal.
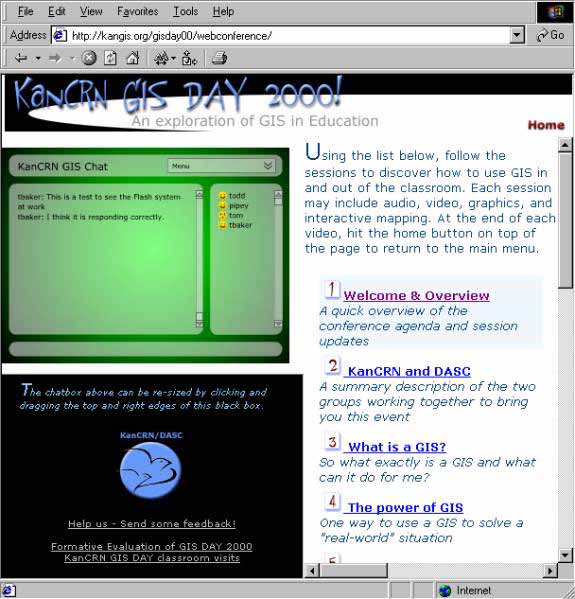
In an attempt to reinforce learning concepts, assist with technical concerns, and encourage participation a real-time chat window was always present on the user's screen. Users were able to choose a login name and participate at their own comfort level. Three key staff members were assigned to the room, including a GIS technician, a GIS Project Manager, and an education specialist. At times, our Macromedia FLASH room was supporting up to 50 simultaneous logins. In some cases, one login represented an entire classroom. The chat room and its constant visibility and ongoing activity added elements of personalization and reality to this online conference.
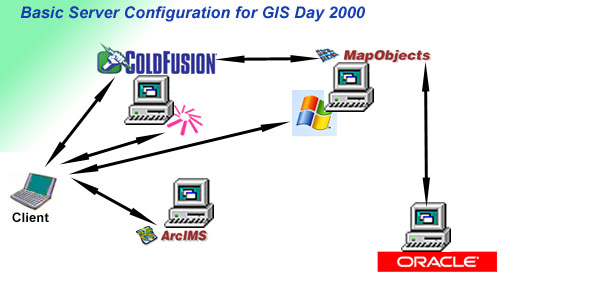
The second Windows NT server contained Microsoft's Media Services Server pack and was responsible for serving out on-demand video and audio feeds. This machine also had, at the time, at least four dynamic Map Objects Applications (Visual Basic) running. These maps were utilized during the course of the online conference.
The third NT server, housed at DASC, contained Esri's Internet Map Server software with ColdFusion handlers. The applications residing on this server were created especially for this event. The final server was a dedicated Oracle 8 machine that received Cold Fusion data posts and supported the on-the-fly map generation by the Map Objects applications. All four servers were supported by 100-megabit connections to the university WAN. The university is a member of KanREN, an Internet and Internet2 backbone across Kansas, supporting multiple T1 and fractional T1 lines (http://www.kanren.net).
In terms of client browser requirements, a "Tech-Check" was posted at the site of the web cast weeks in advance. The address and pertinent info regarding the Tech-Check were distributed with early announcement fliers. The Tech-Check walked users through testing a web browser for the presence and correct installation of Macromedia's Flash 4 Player and Microsoft's Media Player 7. We also strongly advised at least a 4.0 web browser, capable of supporting Java. As school district's networking capacity varies widely, we planned streaming services to target a minimum of a constant 56K connection to our web servers. This bandwidth includes the transmission of HTML pages, streaming Flash data transmissions, graphics, mapping applications, and streaming video/audio. The complexity of mixing these elements can become incredible, particularly as the developer considers user timing (of the non-linear format) and data transmission characteristics of these media, particularly those streaming. For greater detail on data transmission of streaming, we suggest you refer to Microsoft Media Server help documents.
As a Federal grant and often acting with minimal budgets, we are forced to be very "choosey" about expenditures. The selection of a streaming media service was in large part based upon this frugality. At the time of the web conference, the Microsoft Media Server was chosen largely because it was a completely free server application with free client browser plug-ins (for Macintosh, Solaris, and all Windows platforms). While the documentation and clarity of the administrative tools was not as friendly as other competing software, we were left with little choice. Prior to the online conference, we had used Real Network's Free G2 Streaming Server. Unfortunately, this product is limited to 25 concurrent connections, too few connections to support the conference.
By and large, on the day of the conference, our users experienced very few technical problems related to poorly configured personal computers. The two reported problems occurred on Macintosh 8.1+ computers, each running Netscape 4.0+. With regard to network connectivity, we did experience delay and increasing lag time for some users. Upon verification with the University of Kansas Networking and Telecommunication Services Department, we were notified that we did not saturate any part of the university or building WAN. The Media Server's throughput at no time reached unacceptable levels. We are left to conclude that uncontrollable congestion existed in some part of the network connection between the university and the client machine. It is important to consider that many school districts have extensive or poorly configured firewall, virus protection, or other scanning software in place. Occasionally, these services are responsible for creating lags or other connection failures.
What is a GIS?
Pulling from the materials available from the GIS Day web site (www.gisday.org), a
Microsoft Power Point presentation was published on the KanCRN GIS web site to
provide a basic overview of GIS. A short video recorded by KanCRN/DASC staff
members accompanied these slides to provide additional information.
The Power of a GIS
To illustrate the functionality of a GIS, a scenario was created to show how GIS could
be used to help solve a "real world" problem. The scenario is described below:
A toxic spill has just occurred in a heavily populated suburban area in Kansas. Emergency response teams have been dispatched to the scene. Upon arriving at the scene the Hazardous Materials (HAZMAT) team has determined that all people within 5 miles of the spill site need to be evacuated. The HAZMAT team has informed city officials that the spilled chemical has been known to cause respiratory problems in young children and has recommended that all children under the age of 12 and within 10 miles of the spill site be evacuated as well. Additionally, the HAZMAT team has said that the area within 15 miles of the spill site needs to be monitored over the next year for any long lasting environmental effects. The emergency response teams have requested detailed maps of the area to assist them in making decisions on how to evacuate the area. The following data layers were acquired from the local GIS department: Aerial photography, digital topographic maps, roads, streams, land cover, county and city boundaries, school district boundaries, and school locations.
A series of maps was created in ArcView to illustrate how a GIS can be used to display and analyze many different layers of geographic and tabular information at one time. A short video was developed to describe how the GIS system was used to create each map:
Map 1 – Shows spill site location with county and city
boundaries, and the transportation network of the area.
Map 2 – Show the 5, 10, and 15-mile buffer zone displayed on top of the basemap features from map 1.
Map 3 – Shows the 5 mile buffer area that needs to be evacuated
| Map 3a – Shows the 5 mile buffer area displayed on top of an aerial photograph | Map 3b – Shows the 5 mile buffer zone displayed on top of a USGS topographic map |
 |
 |
Map 4 – Shows the school locations within the 5 and 10-mile buffer zones
Map 5 – Shows the 15-mile buffer zone displayed on top of the land cover database for the area
This type of scenario was created because it illustrated some of the basic spatial functions of a GIS and how they can be used to provide answers in a "real world" situation.
Interactive Mapping on the Web
Next, to integrate GIS technology and the Internet, versions of the maps shown
above were incorporated into an ArcIMS project. This example of web-enable GIS
technology illustrated to the audience how the Internet can be used as a distribution
mechanism for GIS databases and cartographic products. The ArcIMS project
created for this event can be viewed at http://mapster.kgs.ukans.edu/toxic. Links to
other Internet mapping applications were also made available on the web site.
These WMV files are then loaded onto the server and placed into on-demand directories. Services for each video for instantiated and saved. We choose to stream our audio and video files on port 80, the default MS Media Services streaming port. While binding this port to streaming disallows web page serving from this server, it greatly increases the chance of not being blocked by school district software that often denies streaming data transmission on other ports.
If a live broadcast had been attainable, a very similar process as the one above would have occurred. In the case of live or real-time broadcasting the Media Server is bound to an incoming video stream and served out at a pre-determined address. The Microsoft Media Server does have the capacity to record live broadcasts for archival purposes. Due to time limitations, we were not able to release our planned live-web cast component during the GIS Day event. However, the web cast was very well received by students, teachers, GIS professionals and others.
By and large, the day was a great success! The pre-recorded sessions were regarded highly and many viewers expressed appreciation for our efforts. Although the live video feed was not as fruitful, the live chat, and all sessions worked correctly throughout the day. In terms of the grant, we are very excited about the general structure of the web conference and with additional research into available technologies, we plan to implement similar collaborations very soon.
Network bandwidth requirements from school district to district (and even building to building) are highly variable. We expected that we could confidently depend upon a continuos 56k stream into any given computer. This was not the case. Due to district network congestion, firewall software, and bottlenecking some schools had difficulty receiving streamed files. Geography made little difference, as schools in Kansas City often could not receive files that schools in Washington State and Oregon received relatively well. Similarly, a few schools had difficulty configuring browsers, particularly older browsers. We should have included a browser version check in our "Tech-Check" column.
At final count, we had nearly 50 classrooms log in, with additional unknown individuals also logging on. Freely speaking, we estimate virtual contact during GIS DAY at around 2,000 individuals across the world. This does not include any visits that have occurred since the initial broadcast. Several schools and agencies outside of the coterminous US logged on, including Puerto Rico, Australia, and Slovakia.
Kenneth A. Nelson is the manager of DASC and a Research Assistant (GIS Specialist) for the Kansas Geological Survey. Ken has been with the DASC team since May 1995. He graduated from the University of Kansas with Bachelor of Arts degrees in Geography and Environmental Studies in 1993. Ken's responsibilities include supervising the daily operation of DASC, researching new technologies related to GIS database archival and distribution, and providing GIS support services for various research projects. Mr. Nelson can be reached at nelson@kgs.ukans.edu
Steven B. Case, Ph.D. is an award winning biology teacher for 20 years, is currently the Director of the Kansas Collaborative Research Network (KanCRN) for the University of Kansas. He has taught in a variety of settings and computer technology is an integral part of his science teaching. A focus is on having students do science rather than learn about science. Dr. Case can be reached at scase@kancrn.org
Amber K. Shultz has been working as a GIS Specialist at the State of Kansas Data Access and Support Center (DASC) since 1995. Amber received a B.A. in Anthropology from the University of Kansas in 1997, and is currently pursuing a Masters degree in Geography from KU. She leads in the development and enhancement of the DASC web site, including cartographic and graphic design and layout, and ColdFusion and ArcIMS web development. Most recently she has been working on the Kansas Collaborative Research Network (KanCRN) and the KanView II WWW Project. Amber can be reached at ashultz@kgs.ukans.edu
The maps contained in the "Content" section were created by John Dunham, Ph.D. of the DASC.