

|
|
|
|
Patrick Dolemieux,
President & CEO
This paper discusses how schematic complements GIS for the design, construction, and management of a network - especially for the utility and transportation markets.
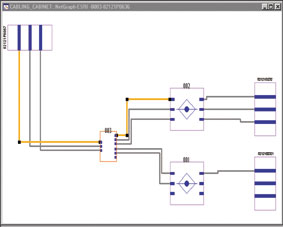
Schematic, or diagram, is a way to logically represent a network or a part of a network. It applies not only for outside plant but also for inside plant. Schematic complements the GIS by offering multiple views of the same network objects.
NetGraph Information Technology (NGIT) has developed a specific application integrated into the ArcGISTM
product range: NG SpatialTM.
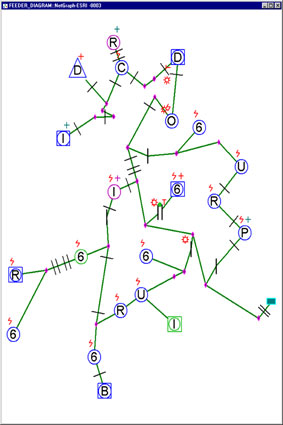
NG SpatialTM allows GIS users to automatically generate schematic and geoschematic
representations of geographic networks created and managed in ArcGISTM geographic databases.
Automating schematic production will save utilities and transportation users tens of thousands of dollars annually and will
provide much more up-to-date and accurate schematized maps and work orders.
NG SpatialTM allows users to dynamically run a trace from ArcGISTM or
a query in the geodatabase and to automatically generate the related schematic document.
NG SpatialTM is designed to address the documentation and asset management needs of large
public-utility networks. To that end, it is interfaced with Esri's tools and brings the necessary additional schematic
functionalities.
NG SpatialTM meets the graphical needs of:
Utility operators need to represent and manage their networks in the most accurate, precise and detailed
way.
So far they have been able to create diagrams using CAD solutions. However, CAD systems require lots of
resources to implement interactive solutions, lack automation and still suffer from updating delays.
Automatic schematic will allow operators to work with complex networks, regardless of the scale or level. It accesses the geodatabase and displays diagrams using extensive symbols, complementing GIS. Diagrams are useful in the decision-making process providing a graphic representation in accordance with the database contents.
We have developed a solution, called NG SpatialTM, which is integrated into ArcGIS
TM and connects to the information system to generate schematics automatically.
This solution addresses the major concerns being faced by utilities, comprehensive data display, reduction in data
redundancy and maintenance costs.
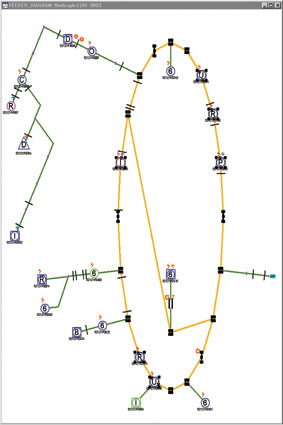
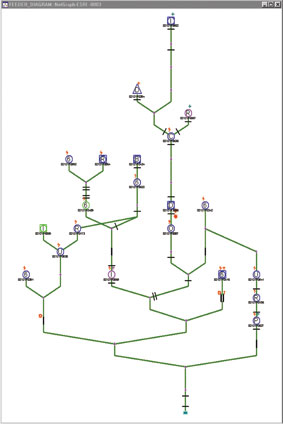
Schematic is a mean to represent any type of network and diagrams within a symbolic system, in a defined
space and without scaling constraints. It produces diagrams which can represent physically or logically a network.
Datadriven Shematic allows an overall representation of a network, allowing optimal object location.
Schematic is aimed at network operators, who wish to be able to make the most of the huge repository of alphanumerical data built up over the years, by getting such data to be graphically and schematically represented and even "cartographically" matched and displayed, as needed.
Schematic is intended for network operators of energy and water supply companies (electricity, gas, water supply and waste water), communication companies (Telecom, cable), transportation companies (road, rail, air, water ways).
Many technical application areas require automatic schematic: simulation and planning, engineering and design, supervision, administration, technical management, operation/maintenance, resource allocation...
NG SpatialTM is The Automatic Schematic Generation Software for ArcGIS
TM. It is interfaced with the ArcGISTM range in order to view, operate and
exploit any network in a geographical and schematical environment.
NG SpatialTM brings effective and innovative solutions to automate graphical representation of
network descriptive databases through customizable algorithms.
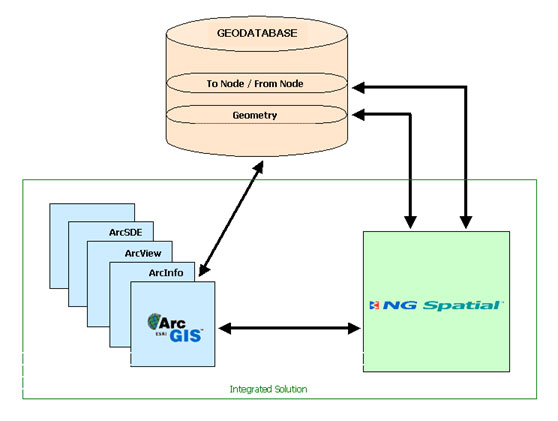
It connects to the geodatabase in two ways:
 |
 |
 |
||
 |
 |
||
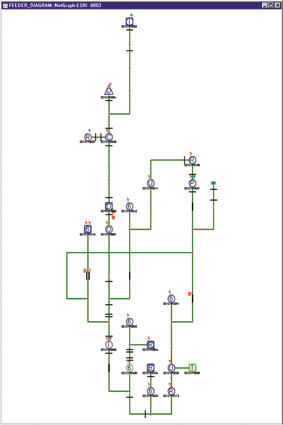
Schematic allows utilities operators to get tailored geoschematic or schematic network visualization.
Coupled with ArcGISTM, NG SpatialTM can enhance network management by
handling the automatic creation of networks within the cartography environment and manages consistency between cartographic
and schematic views, imposing no constraints on the information system architecture.
NGIT is commited to provide the utilities with evolutive solutions offering the best vision for the best decision.
Patrick Dolemieux,
President & CEO
NetGraph Information Technology SA
7-9, Avenue Aristide Briand
94230 Cachan - France
Tel. +33 1 49 08 57 00
Fax +33 1 49 08 92 02
www.netgraph-it.com