Using my GIS experience, I identified existing GIS data that I felt could be useful in this site suitability analysis. If the work proved promising, the results could be used as a stepping stone to more sophisticated analyses. ArcInfo was used for any initial conversion and reprojections of data. However, the GIS tools used for analysis were ArcView with the Network Analyst extension.
Delaware has a GIS community active at both the state
and local levels. The University's Center for Applied Demography and Survey
Research had recently completed a GIS project that required digitizing
all the school district boundaries along with all the schools in the state.
New Castle County had recently digitized all property parcels although
only the parcel number was available as an attribute. A number of additional
ArcInfo coverages and ArcView shapefiles were useful for this study. Some
conversion and reprojection was required. The following data were used:
Base Data
I selected only undeveloped land for potential school sites. To determine how much acreage would be needed for a school, I created polygons by heads-up digitizing a few existing school sites that I located on DOQs. I then calculated acreage for these polygons and came up with a working number of ten acres minimum.
The steps below were used to perform the suitability analysis. I used ArcInfo for the first two steps, but ArcView could have been used as well.
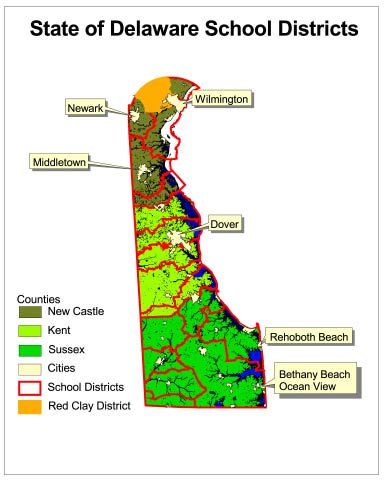
1. Select the Red Clay School District polygon from the statewide school districts theme and convert it to a polygon shapefile.
2. Using this district polygon, clip the other themes, except the DOQs, to it.
3. Using the property parcel data file, select all parcels greater than 10 acres and convert the selected parcels to a shapefile.
4. Using the land use shapefile, aggregate those land uses that would be considered open space and create another shapefile. The land use shapefile, originally created from the DOQs, contains approximately thirty-five classifications.
5. Using the ArcView geo-processing extension, perform an intersect between the parcel polygons greater than 10 acres and the open space land use polygons to create a polygon shapefile with the results of the intersect. Recalculate acreages for the resultant polygons to assure they still met the ten acre minimum size.
6. Use the shapefile created in step 5 to perform another intersect with the sewershed theme. The resultant shapefile would show open land with sewer availability on parcels greater than ten acres. Recalculate the acreages.
7. Overlay on this shapefile, data depicting environmentally sensitive areas. These include floodplains, steep slopes, and water resource protection areas. While such constraints would not preclude development, County ordinances require review before land so designated can be disturbed.
The above analysis provided a number of possible locations for school sites. It was obvious that some sites, although identified as suitable, would not be. For example, open space in the interior of existing housing subdivisions could be excluded although it might meet all three criteria used.
While data were available for performing the first part of the exercise, to proceed to the second part required student location data, and no GIS data were readily available. Thus, I created surrogate data to represent the student locations. Using ArcInfo, I randomly selected 16,000 points (labels) from the approximately 50,000 parcel polygons in this district and created a point coverage. Each point would represented one student. I converted this coverage to a shapefile.
Of course these data greatly oversimplify the situation.
Depending on the grade levels of the proposed school, the ages and/or grade
levels of the students would also need to be known so that current and
projected enrollment could be calculated and mapped. But that is a topic
for another time. Of significance, however, is that GIS vendors have created
extensions to ArcView, which can be used to map both student locations
and projected student locations. These utilities can create on-the-fly
examples of what the effect on enrollment levels at specific schools would
be if the boundary zones were moved. (See References)
Once the student data were available, I needed to
calculate the number of potential students within one and two miles of
one of the suitable school sites. I chose one site of approximately twelve
acres on which to run a service area analysis using Network Analyst. Since
I had data for the road network, I could do more than just create simple
circle buffers around the proposed site. Network Analyst could create a
potential service area of one and two mile irregular polygons by going
out along the road network. Once that was done, the total number of potential
students residing within the service area could be determined by viewing
the table of students selected by the Network Analyst. In this instance,
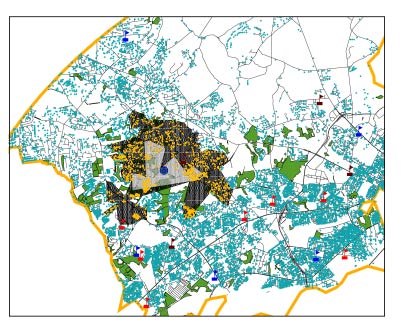
1,160 of the16,000 hypothetical students (points) were found to be within
two miles of the site (Figure 2 at right.).
The gray and black areas respectively represent the one and two mile extents along the road network of the irregular polygons drawn by Network Analyst. The large blue dot within that area is the site. The aqua dots are the locations of students, and the orange dots represent the students that fall within this study area. A look at the student attribute table would show the records for those students selected and provide a total. The data could be analyzed in a number of different ways. This example in itself underlines the value that the use of GIS could bring to school site suitability analysis. With some refinement and revision and with the analysis tailored for a specific geographic location, it would be a powerful tool for educational planners.
The obvious major data need in this type of analysis is accurate student location and age information. One would need both streets with address ranges and student addresses to geocode these data. Geocoding is the assigning of a x-y geographic coordinate location to a point and relating this point to a street address. That is, one needs to create a point shapefile with each point representing the location of a student based on the student's address. Each point would contain attribute data containing, at minimum, the age and grade of the student. The Delaware Department of Transportation has recently begun adding address ranges to their street files. Since New Castle County maintains a parcel polygon shapefile, geocoding could be done by joining address data from the County's assessment file to the parcel polygon shapefile using the parcel number as a join item. Once all the addresses were available for the parcels, a join to the address data for students in the districts database could be made to create a point shapefile of student locations. In most cases, this task might prove formidable because of various spelling and abbreviation conventions, but it would need to be done only once. Then baseline data could be updated and used in future modeling efforts.
For this demonstration, no research of existing literature on this topic was done. However, serendipitously, Dr. Richard D. Moretti, Financial Officer of the Red Clay Consolidated School District, was in attendance at the forum. Dr. Moretti referred me to his recent dissertation in which he discusses an algorithm that he developed for use in the school site selection. (See references). His method requires a rating sheet to grade criteria important in the preliminary site selection process and a more extensive rating sheet to grade the suitability of specific sites. The former assesses land availability, size, shape, ownership, and cost. The latter assesses and assigns weights to such criteria as location, accessibility, topography, utilities, public services and thirteen other criteria. Many of the selection criteria that Dr. Moretti uses in his algorithm could be converted from checklist form to a format usable by a GIS. Once weights were assigned, these sites could easily be mapped indicating their relative suitability.
I also feel that it is important to try to link this kind of site specific analysis to existing software that already has the capability to do school attendance zone boundary redefinition with attendant recalculation of student totals, and that can perform student enrollment projections for future school planning.
A GIS could also calculate travel times and distances from existing or proposed schools. It could plot the locations of different age groups with an eye toward future planning. Because it provides information on student locations, the number and locations of students affected by proposed plans can be calculated. Citizens in concert with school planners could estimate the effects of school site planning decisions. Easily understood facts could be provided in map form, on the fly if necessary, to administrators and parents when the location of new school is discussed.
Moretti, Richard D. An Algorithm-Based Screening Process
for the Selection of School Sites in Delaware, Unpublished EdD Dissertation,
Wilmington College, Wilmington, DE, 1999, 248 pp.