Digital orthophoto imagery has become a popular base layer in modern GIS. This paper presents a little twist on the standard variety of digital orthophotography. Through the use of the True Ortho method, we are able to produce imagery that is rectified without building lean. Using Denver, Colorado as an example, imagery is produced with skyscrapers that rectify to their upright position in geographic space. Surrounding streets and other cultural features are clearly visible where they ordinarily would not be with a standard ortthophoto. This innovation provides an opportunity to capture more cadastral information from digital orthophoto imagery.
Digital orthophotography is a resource being utilized by a significant portion of GIS users. With the price of disk space dropping and the speed of computers increasing, digital orthophotos are a viable option in building a fully developed GIS. Orthos can be used for technically specific needs such as planimetric, cadastral, or utility data capture and quality control. They can be used for accurate project analysis and design implementations. They can also be used to explain projects and issues to the general public. Real world pictures are easier for the untrained eye to understand, detect landmarks, and recognize familiar places. Digital imagery helps the audience to visualize the new light rail corridor, for instance. The ortho will show the existing conditions, while possible changes can be overlaid as vector information. The world around us is constantly changing, and digital orthophotography can help us monitor that change.
What exactly is a digital orthophoto? The technical definition goes something like this: " A raster photographic image that is combined with differential rectification to remove image displacements caused by camera tilt and terrain relief." An orthophoto is simply a photo map on which true distances can be measured. It is an accurate representation of the earth's surface.
In order to create an orthophoto, several key input files are necessary. The keys are aerial photos with a high percentage overlap, scanned imagery, aerotriangulation (A.T.) results, and a digital elevation model (DEM). The scanned imagery can be obtained from scanning aerial photo diapositives or negatives on an image-quality scanner. The A.T. results will include a camera calibration report and the ground control. At a minimum, the DEM can be a regularly-spaced grid of masspoints, each containing an x, y, and z value (see Figure 1). A more robust digital terrain model (DTM) can be also be used, because it includes strategically placed masspoints, dense breaklines, and ridgelines (see Figure 2).
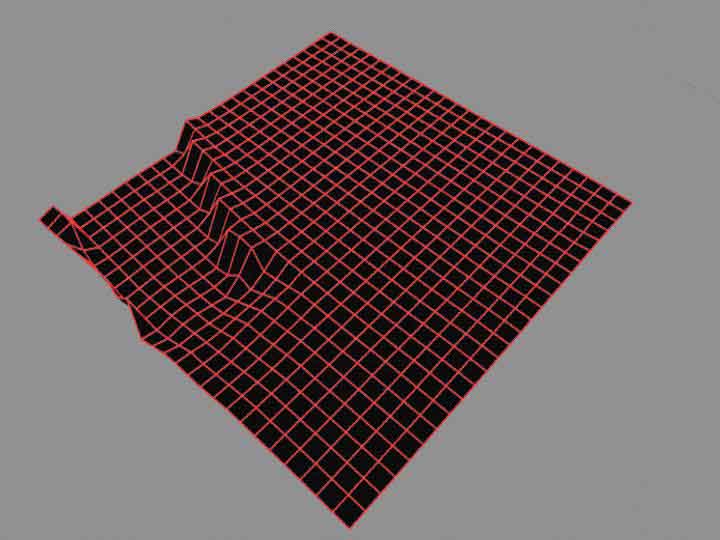
Figure 1: A simple DEM of regularly spaced masspoints.
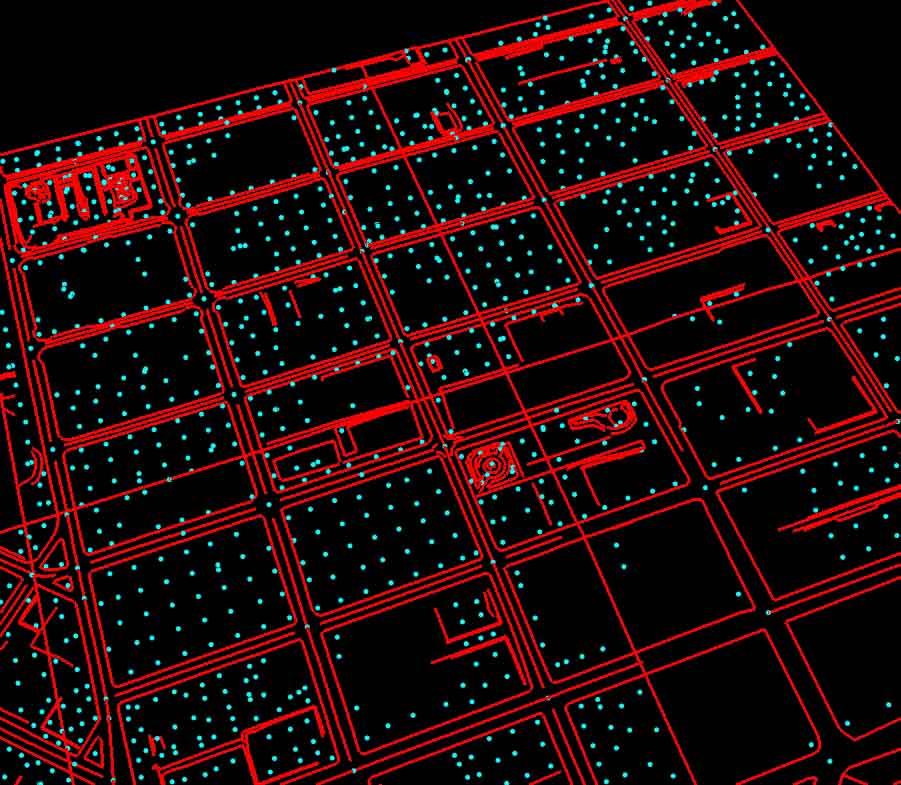
Figure 2: A more robust DTM of masspoints and breaklines.
Sanborn Colorado, L.L.C. has created its own piece of sophisticated production software and procedures specifically designed to create digital orthophotos. The software is called METRO - Method for the Elimination of Terrain and Relief Displacement in Orthophotography. The METRO system uses stereometrically-derived DTMs to fully rectify aerial images. To take it a step further, the DTMs are processed into a triangular irregular network (TIN) to provide a more accurate representation of the terrain surface. This method reduces errors caused by interpolation from a regular grid of masspoints. The TIN eliminates the waviness around sharp terrain breaks, like steep embankments, road edges, railway grades, and hydrographic features (see Figure 3).
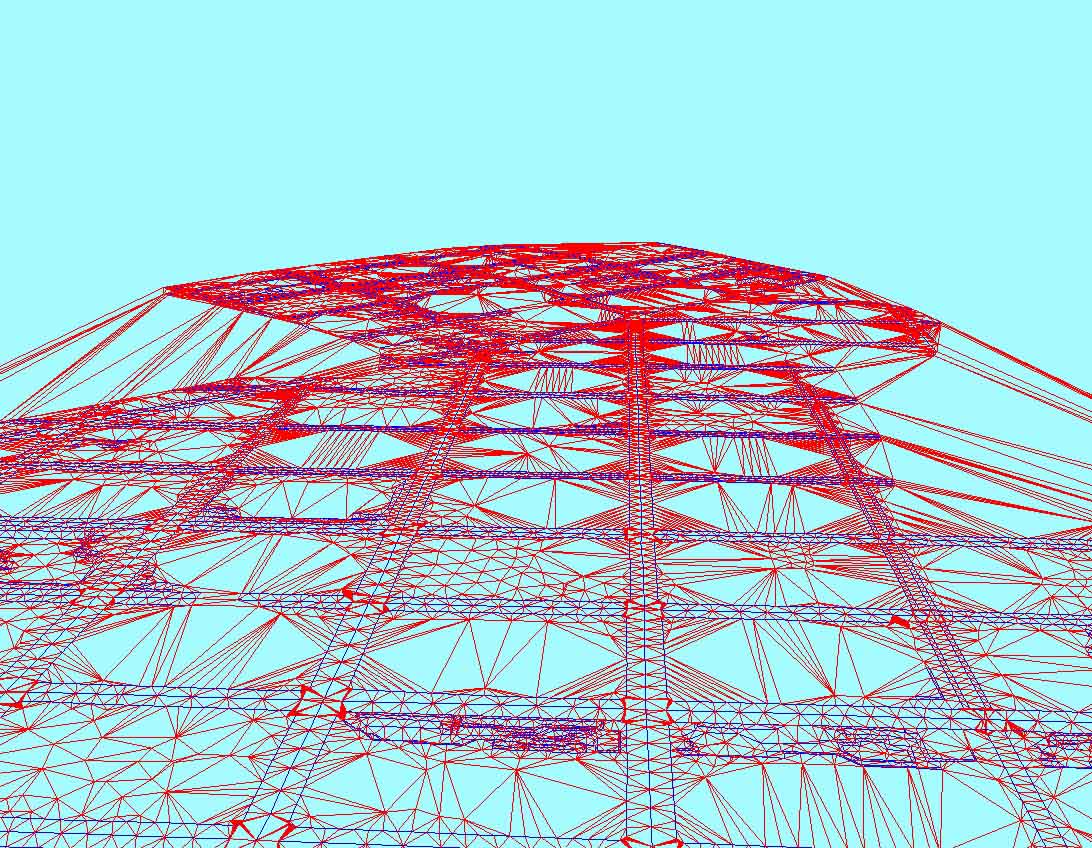
Figure 3: A TIN at ground level for a section of downtown Denver, CO.
In ordinary digital orthophotos, expansion features such as bridges create problems. DTM is captured at ground level, so bridges that are rectified with this data are "pulled down to the ground, giving them a distorted appearance. Elevated features (buildings, trees, power lines) also create a problem due to radial displacement. The farther you move away from the center of the aerial photograph the more lean you see in features such as buildings. The determining factors for the amount of lean are the percentage of overlap in the aerial photography and the height of the feature. A higher percentage of overlap shows less lean, because the percent of photography used from the outer edge is reduced. This leaning effect can have an impact on the functional and aesthetic features of an orthophoto. These issues will be discussed later in the paper.
The Sanborn Colorado, L.L.C. METRO software offers a true orthophoto component that rectifies these issues. This process essentially straightens out the bridges and buildings in an image. The METRO true orthophoto process requires the collection of DTM data for bridges and buildings, as well as for the ground below. The bridge is captured as a separate polygon with its true elevation, while the ground below is also modeled. When the scanned image is rectified, both the bridge and the ground below will be accurate.
The most impressive and useful component of the Sanborn Colorado, L.L.C. true orthophoto process is the method to make the buildings "stand up straight". This component can be vital to the capture of ancillary data. It involves collecting intricate data on the tops of buildings. Compilers must photogrammetrically capture and model every building at roof level AND every feature over ten feet in elevation on the rooftops - vents, elevator shafts, turrets, slopes, and other changes in elevation. The highest point of each enclosed feature is also captured (see Figure 4). They must also capture any outstanding features at ground level, like a stairwell or courtyard that is part of the building. This data would also include the standard ground DTM capture. This raw, yet highly detailed, data can be incorporated into Esri's ArcView 3D Analyst to provide a 3D view of Denver's downtown (see Figure 5). The data can be scaled, rotated, and expanded to create an image useful for city planning, developing, and marketing.
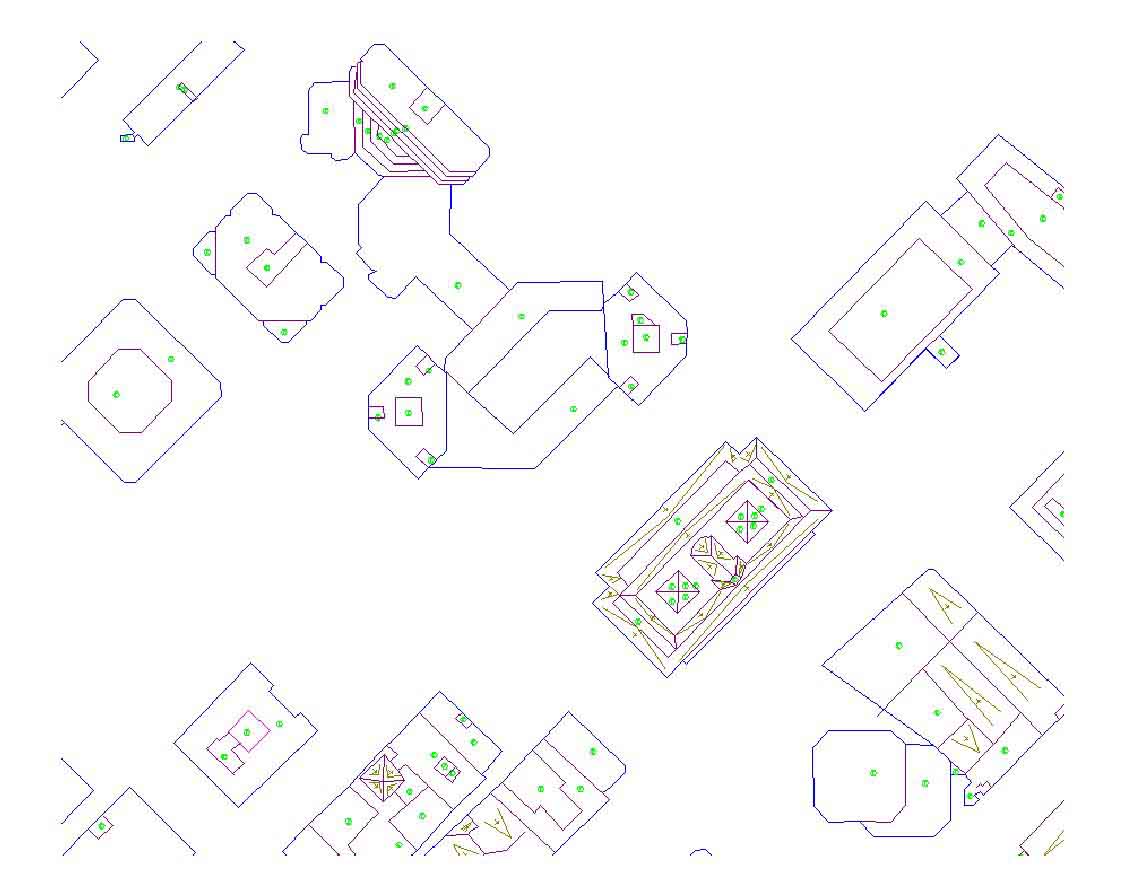
Figure 4: Digital building model. Each break in rooftop and slopes with at least ten feet of elevation change are modeled.
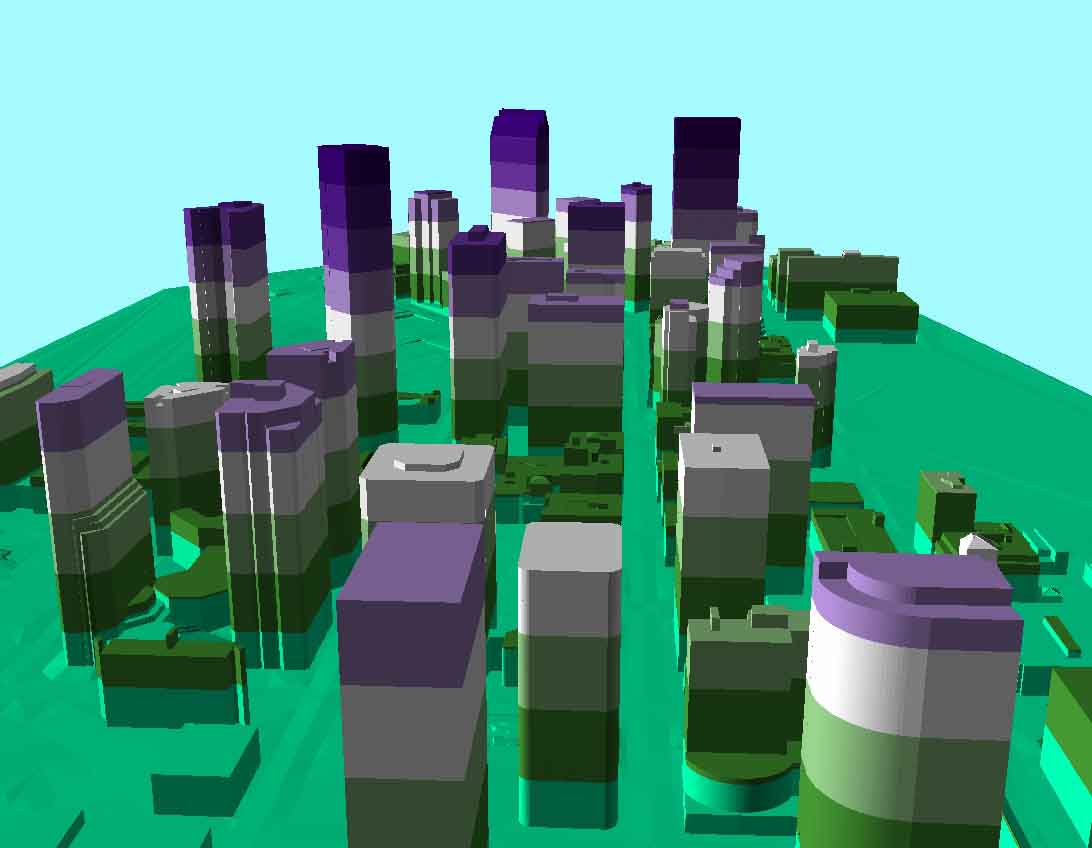
Figure 5: 3D model of downtown Denver using the digital building model.
Once compilation of the planimetric features is complete, the orthophoto technician will then go in and edit the dtm data. The technician will build two offset polygons from the original building polygon. The inner polygon will have the elevation of the rooftop taken from the captured roof spot. The outer polygon will have the elevation of the ground taken from the captured building (see Figure 6). The original polygon is then discarded.
This data is then used to automatically place building-top imagery directly over the footprint of the building. Corresponding pieces of images available from the increased overlap are used to fill the imagery holes left by the corrected building. As mentioned before, one of the keys to the true orthophoto building process is the overlap and sidelap among flight lines. For optimal conditions, the METRO true orthophoto building process requires a project area to be flown with 80% overlap and 60% sidelap. When either of these values is decreased, you sacrifice imagery to insert for the original building lean position. The result will be blank imagery, an area where the camera could not see the ground.
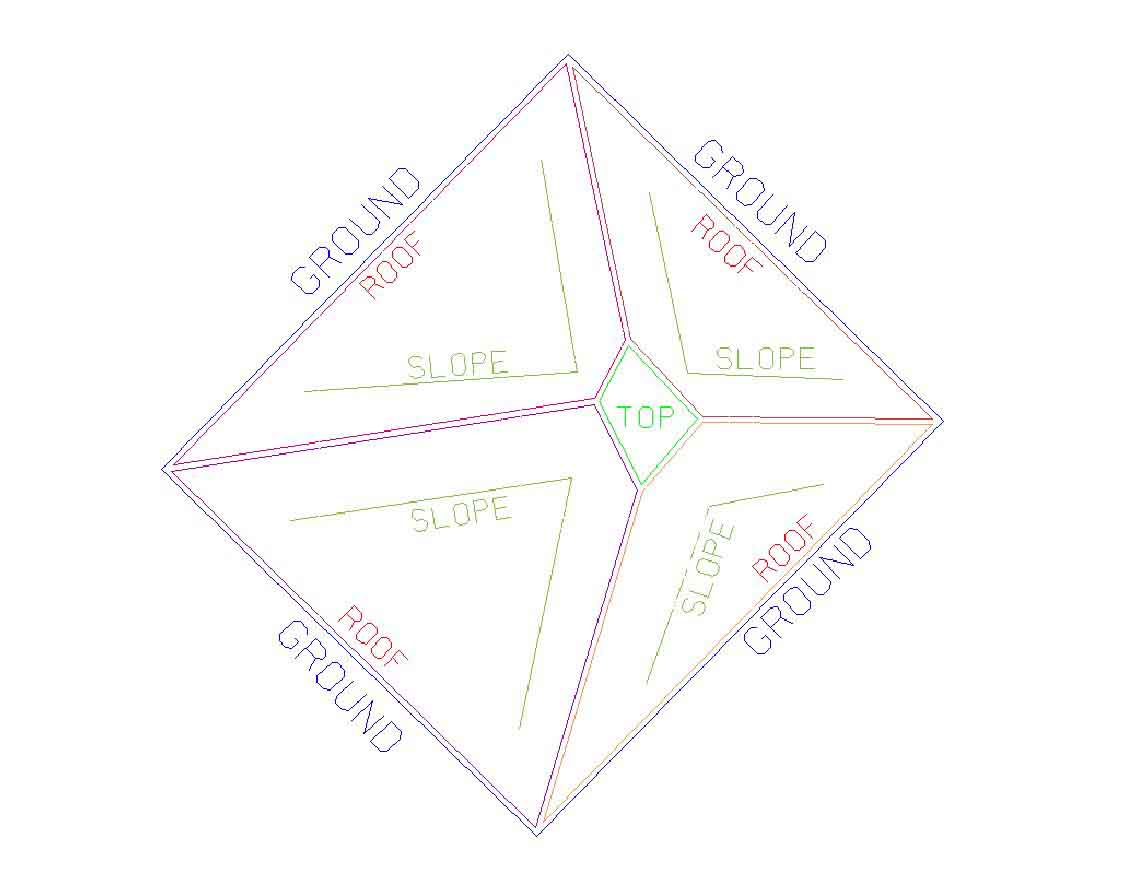
Figure 6: Building terrain model after technician processing. Z values are inherent in the captured and processed data.
As an example, I chose the City and County of Denver Orthophotography Project - 2000. The project area encompasses the entire geographic extent of the City of Denver, Colorado, approximately 120 square miles. The imagery was flown at a scale of 1"=600' to produce a 0.5' pixel resolution. The entire project was flown with 60/30 coverage. The downtown was selected as a true ortho building area, and it was flown with 80/60 coverage. The Denver Technological Center was also chosen by the client for true ortho building correction, but it will not be discussed in this paper. The true ortho downtown area consists of a 1/3 square mile. The area is full of tall buildings in a narrow corridor. Without performing the true ortho building correction, many features would be hidden from view. Intersections, manholes, utility poles, parking meters, streetlights, and alleyways would be out of sight (see Figure 7). Looking at the street on the left side of the sheet, it seems like chaos. There are buildings leaning left and right, spilling into the street. At one point, two buildings come together, leaning into each other, to cover up the entire street. It is impossible to know how many utility and transportation features are hidden from view. It would be difficult to perform any type of GIS analysis or interpretation with this imagery. Figure 8 shows another example. There are buildings covering streets, parks, parking lots, and even other structures.
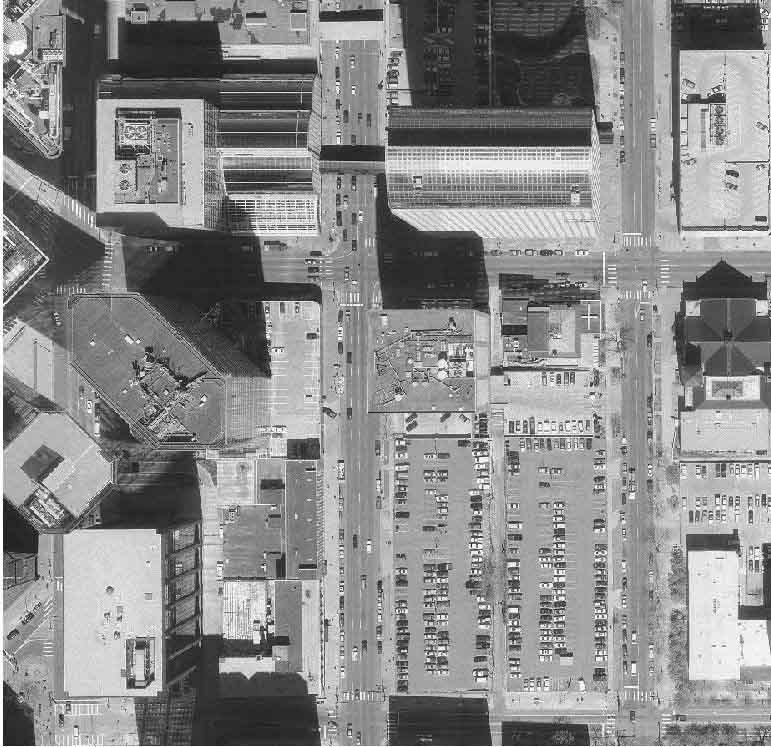
Figure 7: Non-METRO Ortho.
The solution is here. Figure 8 shows the same sheet as Figure 7 with the true ortho building correction applied. The streets open up to show curb edges, light poles, manholes, streetlights, a median, and a bus terminal. The true orthophoto images provide more functionality for the end GIS user. One can perform analysis, compilation work, or image interpretation on these improved orthophotos.
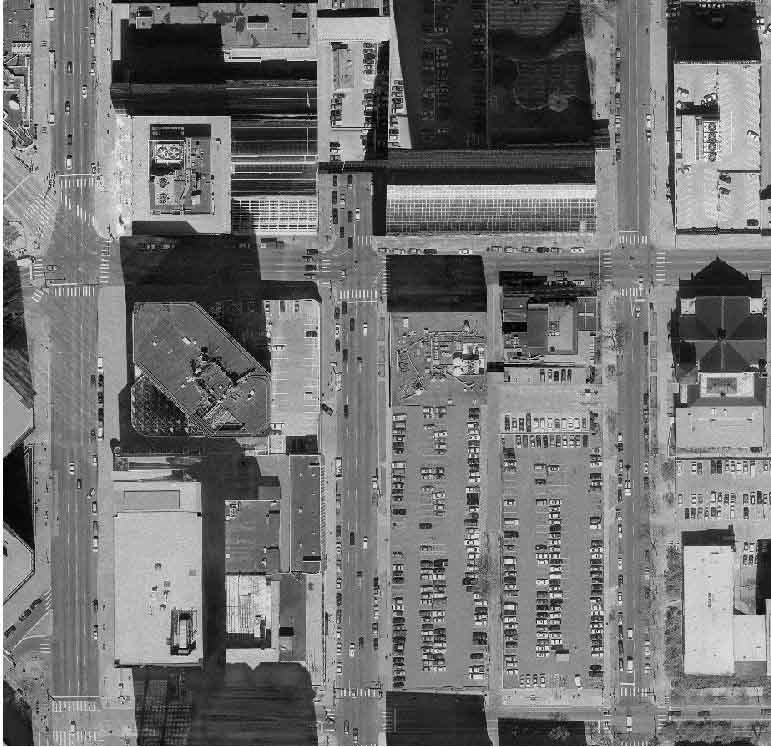
Figure 8: METRO True Ortho.
The true orthophoto building correction process produces a highly interpretable image. The process is more labor intensive than the standard DEM collection. The compiler spends a fair amount of time capturing features on rooftops and adding in slopes and label points. The orthophoto technician also spends additional time editing the buildings in the DTM to produce the desired results. This additional labor will increase the cost to produce the project. However, it should pay off in the long run. If the client is planning to perform their own capture or compilation of planimetric and/or utility features, the benefits are numerous. The user will be able to discern all of these features directly on the digital orthophoto. The user will not need to consult contact prints for hidden features.
In summary, Sanborn Colorado, L.L.C. has created a monumental process to take the lean out of tall buildings in digital orthophotography. The result is an image free of radial displacement. The process is somewhat labor-intensive, but the gains are worth the effort. The end user has the ability to capture all features present in the image, including the ones hidden behind leaning buildings. The end product can be useful for data capture, quality control, analysis, display, and marketing. The orthos can be further overlaid with the digital building model and digital terrain model to create an amazing presentation (see Figure 11). Without the true ortho and extensive modeling, the overlay of the ortho for a high quality presentation map or fly-through would not be possible.
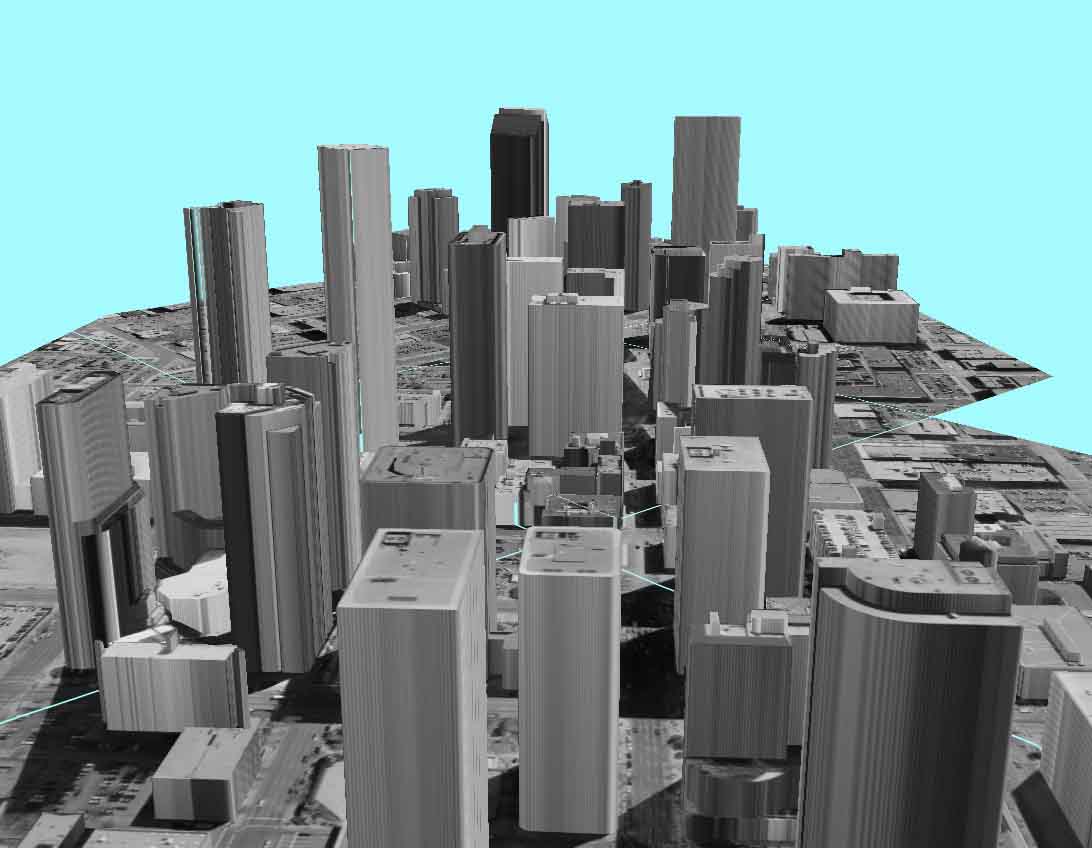
Figure 9: A 3D model with True Ortho overlay.
We would like to thank the project administrators at the City and County of Denver for granting us permission to use and display their data in our paper. Special thanks to David Luhan, GIS Data Administrator, Project Manager for the City of Denver, for his support throughout the duration of this project. Also, we would like to acknowledge the hard work the Sanborn Colorado, L.L.C. stereo-compilers and technicians put into the initial project to make a quality product. We especially thank Jenny Madsen and Chris Russelavage for their efforts to organize and prepare much of the archived data we used.