Mapping Urban Deer Populations Using GPS and GIS
Brandalena Gianette Blake
University of Texas at San Antonio
Stephen Castlebury Brown
University of Texas at San Antonio
Abstract
Urban white-tail deer populations are becoming increasingly more common
across the United States. In the community of Hollywood Park, Texas, several
factors such as confinement, feeding, and lack of predators, influence a local
white-tail deer herd. Using a real-time, differentially corrected GPS receiver
connected to a laser range finder, researchers at the University of Texas
at San Antonio were able to create GIS maps of the white-tail deer community
in Hollywood Park. These researchers were then able to document the various
factors that influence this white-tail deer herd. Participants in this session
will learn how to conduct similar wildlife surveys.
INTRODUCTION
The continuing human population growth in The United States has resulted in
a decrease of rural habitat and an increase in urban areas. The destruction
of rural areas and lack of food has forced wildlife and people to coexist
in closer surroundings. Specifically, white-tail deer populations have been
forced into cohabitating with people in cities and suburbs. Increasing deer
and human populations have resulted in a great deal of conflicts (DeNicola
et. al., 2000). According to DeNicola et. al., when deer populations approach
or exceed human tolerance levels, leading to conflicts with human priorities,
the deer may then be considered overabundant. The book "The Science of Overabundance:
Deer Ecology and Population Management," states that there are four definitions
of "overabundance" when referring to an animal population: (1) when the animals
threaten human life or livelihood, (2) when the animals depress the densities
of favored species, (3) when the animals are too numerous for their own good,
and (4) when their numbers cause ecosystem dysfunction (McShea et. al., 1997).
People enjoy viewing the species; but several problems develop when the population
increases beyond control. These include deer-vehicle collisions, destruction
of native flora, decline in plant and animal diversity, and human disease
concerns (Hansen and Beringer, 1997).
Increases in deer populations directly affect the increase of deer-vehicle collisions. An example is in Northern California's San Francisco Bay Area. Deer have invaded suburban areas as well as small housing tracks in which they have been using the street and sidewalks to travel (McCullough et. al., 1997), thus, allowing the deer to become more urbanized. According to McCullough et, al., deer vehicle collisions have become more common on city streets creating concerns of public welfare. National statistics on the number of deer hit were not readily available; however, the author does discuss the number of carcasses removed. The Animal Control Office of Contra Costa County, California removed 1,200 deer carcasses from roads in 1996 in the northeastern part of the Bay Area (McCullough et. al., 1997). Various measures have been tried to control the deer, but the only permanent solution is fencing. Most residents feel that fences would detract from value of their property (McCullough et. al.,1997). Similarly, The Landings, a residential community near Savannah, Georgia had an increase in deer accidents from 2 per month in 1991, to 5.8 and 5.3 in 1992 and 1993 (Butfiloski et. al., 1997). This community contracted with the U.S. Department of Agriculture's Animal Damage Control (ADC) agency to assist in controlling the deer. In this case, population control was achieved through spotlight shooting.
Human safety is also a vital concern with the increase of deer vehicle collisions. From 1984 to 1994 in the community of Bellvue in Sarpy County, Nebraska, the number of deer-vehicle collisions in that county increased 325 percent (DeNicola et. al., 2000). Approximately 1 million deer-vehicle collisions occur annually in the United States (DeNicola et. al., 2000). DeNicola estimated that 29,000 human injuries occur each year and 211 deaths due to deer-vehicle collisions.
The overabundance of deer also produces a negative impact on ecosystems. A ten-year study (McShea et. al., 1997) of deer in northwestern Pennsylvania has documented their affect on the habitat for some species of songbirds. The bird community that used the intermediate woody vegetation demonstrated a significant decrease in species abundance as well as some herb and shrub communities. Some herb and shrub species documented in earlier surveys were not found due to their elimination as a result of browsing over 70 years by deer populations (McShea et. al., 1997). Species of plants in the herb and shrub layer shifted to ferns, grasses, and mosses when deer densities exceeded 7.9 deer/km2. McShea believes that when the deer population exceeds the estimated pre-European settlement density, reduction and elimination of genetic material can result. This can cause changes in a species niche regarding abundance, dominance, and composition (McShea et. al., 1997). McShea states that passive deer management may result in reductions of species richness and abundance and cause shifts in composition of plant and animal communities. Thus upsetting the main goal of ecosystem management, which is preservation of an ecosystems integrity (McShea et. al., 1997).
Birds and other mammals are not the only victims in areas of overpopulation of deer. According to Kuznik (1998), plant species are bearing the effects of over grazing as well. He quotes wildlife biologist David deCalesta from the Northeastern Forest Experiment Station in Warren, Pennsylvania as saying that the plant community is the foundation of an ecosystem. Alter the foundation and the effects will be felt throughout the food chain including invertebrates ( Kuznik, 1998). Plant communities are the foundations of the food chain. Changes in the plant community affect the chain from the foundation on up. Kuznik also states that deer are the beneficiaries of a severe drop in predators such as wolves and mountain lions, and to urban development in areas near their woodland habitat. He noted specifically suburban backyards with gardens and shrubs. Kuznik also quotes Professor Robert Warren of wildlife ecology and management at the University of Georgia as saying that over-browsing by deer has created situations where an area may not be able to restore itself to its natural state even if the herd is reduced.
Human disease is another problem in areas of high deer densities. White-tailed deer can and frequently do carry Lyme disease, bovine tuberculosis, and chronic wasting disease. White-tails are the hosts of the black tick Ixodes scapularis or Ixodes pacificus, which are lyme disease vectors (DeNicola et. al., 2000). Lowering white deer densities might reduce tick populations. DeNicola et al state that bovine tuberculosis is rare in wildlife but has recently been found in wild deer. This bacterial disease affects the respiratory system and can potentially be passed to humans (DeNicola et. al., 2000). It is usually transmitted among deer through sneezing, coughing, or nose-to-nose contact and is more likely to be passed among overabundant deer at feeding stations (DeNicola et. al., 2000). DeNicola et. al., states that chronic wasting disease is primarily found in Wyoming and Colorado. This disease is also transmitted among feeding stations.
Wildlife management agencies have attempted both lethal and nonlethal methods to control deer populations. The lethal approach includes hunters or sharpshooters to control the deer. Ohio, Wisconsin, and Minnesota have created specific zones for urban deer hunting. Cities within these zones have created local firearm-discharge ordinances to accommodate the hunting during the harvests. According to Messmer et. al., 1997, harvested deer were considered the property of the participating hunter. Deer removed by contracted sharpshooters were taken to local packing plants and the processed venison was donated to local charitable institutions (Messmer et. al., 1997). Non-lethal approaches deal with the live-capture and relocation of wildlife. According to Wildlife Society Bulletin, the technique of live capture has been costly, inefficient, stressful, and lethal to the relocated animals (Messmer et. al., 1997). Another possible strategy that could be considered is contraception. According to Messmer (1997), no states currently allow the use of contraceptives in regulating wild vertebrate populations (Messmer et. al., 1997). DeNicola et. al., state that field studies are under way to determine the feasibility of using contraceptive vaccines to regulate free-ranging deer populations (DeNicola et. al., 2000). The authors state that antifertility agents for wildlife are not commercially available. This is a result of all antifertility agents currently being classified as experimental drugs and are only produced in a few research laboratories. DeNicola et. al., states that experimental drugs can only be administered to deer following U. S. Food and Drug Administration (FDA) guidelines. A federal Investigational New Animal Drug permit and state or provincial wildlife agency approval are necessary to capture or treat any deer with drugs (DeNicola et. al., 2000). Therefore, in North America, treatment of deer with contraceptive vaccines is only being conducted in research projects. The authors also state that the FDA has concerns about safety of consuming deer treated with experimental drugs. Fertility control agents are usually delivered to deer using draft rifles or biobullets (DeNicola et.al., 2000). Restrictions on firearm discharge in suburban areas limits practical delivery of drugs to free-ranging deer (DeNicola, et. al., 2000).
Several different methods have been utilized to estimate deer populations. According to Storm et.al., 1992 accurate estimates of white-tail deer are needed to evaluate the interactions within the population, vegetation, human activities, and to respond to citizen groups concerned about the size of the local deer herd (Storm et. al., 1992). Different methods include the mark-resight method, area-conversion method, spotlight surveys, aerial census, and Interactive Geographic Information Systems.
The mark-resight method is based on the number of observed marked and unmarked deer counted along survey routes (Storm et. al., 1992). This method assumes the ratio of marked deer present to marked deer observed is the same as the ratio of the total population to all deer observed in a survey. The mark-resight method first used aerial photographs to determine the size of open and forested areas. Each forested area was divided into suitable and unsuitable zones (Storm et. al., 1992). Storm et. al., states that 92 female and 33 male deer were captured and marked from 1985-1987. During counts, 30-54 adult female deer marked with either a vinyl or radio collar were present. Marked female deer provided the basis for estimating abundance with the mark-resight method (Storm et. al., 1992). This study concluded that the mark-resight method was a suitable technique because deer were not evenly distributed between suitable and nonsuitable areas. Storm et. al., states that deer marked for the mark-resight method also helped reduce double counting during dusk surveys (Storm et. al., 1992).
The area-conversion method assumes a 100% probability that all deer present are seen. Suitable zones were treated as sample plots. This method assumes that the suitable zone is a random sample of the total area survey area, and that the deer density is not consistently different between suitable and unsuitable zones. The statistical analysis used in this study consisted of computing means and standard errors for the replicate population estimates (Storm et. al., 1992). According to Storm et. al., the area conversion method requires equal distribution and thus was not as suitable for their study as the mark-resight method.
In the 1986 Feldhamer et. al, study "Effects of Interstate Highway Fencing on White-Tailed Deer Activity," spotlight surveys of deer were conducted at monthly intervals. Each side of the highway is surveyed during the same time period on each of the 2 consecutive nights. According to Feldhamer, a vehicle was driven 32 km/hour along the highway shoulder while an observer used a high-power spotlight to count deer on the right-of-way. Reference markers were located every 0.16 km throughout the length of the study area. Results were analyzed by calculating frequency distributions and Chi-square tests were used (Feldhamer et. al., 1992). Statistical results showed more deer were seen on the right of way during fall and summer months. Few groups were seen along the highway where there was a fence of 2.7 meters (Feldhamer et. al., 1992).
According to the article "Managed hunts to control white-tailed deer populations on urban public areas in Missouri," a Missouri Department of Conservation task force (MDC) was formed to assess the problem of deer and provide guidelines for managing urban deer. The MDC evaluates the problem, advises land mangers on appropriate management techniques, and establishes boundaries in which a feasible management alternative can be developed (Hansen and Beringer, 1997). They assess populations through simulations determined by aerial censuses. Hansen and Beringer believe censuses in conjunction with population modeling provide insight into the dynamics of urban deer populations and the harvest rates needed to achieve population goals. They also collect data on the number of deer-vehicle accidents and complaints about garden destruction. Managed hunts were used to control the populations and Hansen and Beringer state that population reduction has been successful.
Interactive Geographic Information Systems have been utilized in Germany to record deer overpopulations and to show habitat and population modeling (Radeloff et. al., 1999). This study was aimed at determining deer population densities and to assess harvest rates necessary to maintain desired deer densities (Radeloff et. al., 1999). Scientists applied studies of geological and environmental habitats to deer living space. They took the area studied, subtracted the space occupied by human activity, and left the same population of deer in that same area where they would compete for resources. GIS was used to view how densities were impacted over time by a decrease in living space (Radeloff et. al., 1999). The authors also used GIS and time structures to question how geology and density boundaries are affected. The population increase due to deer habitat decrease was demonstrated through the models. Thus, the authors determined that a geographic information system (GIS) approach was the best for assessing habitat of roe deer (Radeloff et. al., 1999). Using deer damage maps to calibrate the model allowed researchers to evaluate deer density dependence of a roe deer population.
Many different strategies have been tried in an effort to study the populations of urban white-tail deer. There are no simple solutions to all the problems associated with areas of high deer densities. There are a variety of approaches to dealing with this problem, each for an appropriate setting. However, the first step in handling deer overpopulation is identification of the cause, and an accurate assessment of a population is a crucial part of that first step. Some methods may work more efficiently than others depending on the circumstances. To clearly assess any wildlife population, the key first step is the ability to obtain an accurate estimated count and distribution. Using GPS equipment in conjunction with GIS mapping software, one can obtain an estimated population count and accurate distribution models of the population.
In an interview, November 1999, Gary Mercer the then mayor of Hollywood Park, Texas, stated that the deer were a huge problem and that the state would not help. Mayor Mercer formed a deer committee that discussed ideas such as contraception or trapping. Mayor Mercer stated that the State would allow them to move deer but that the problem lay with the state agency Texas Parks and Wildlife which had to approve the relocation of the deer and required a minimum of 14 acres per deer to be available. According to Mayor Mercer, the committee could not find a location that could fit more than two deer.
Contributing to the deer problem is people feeding them. Residents still feed the deer even when threatened with jail time. Mercer stated that "they need help and are not getting it," in reference to Texas Parks and Wildlife failure to assist them in finding a solution. Mayor Mercer estimated that population to be between 400-600 deer with triplets also being born every year due to being well fed by residents.
According to Anne Miller of the San Antonio Express News, deer are the unofficial mascots in the town of Hill Country Village, which is next to the community of Hollywood Park. Miller says there is a prize buck trophy above the mayor's chair in council chambers (Miller, 2001). She states deer will also playfully race with cars as they drive through town.
In November 1999 an interview took place with resident Leah Lewis who was then the chair of the Deer Committee formed in Hollywood Park for the purpose of finding a solution to the population problem. Leah Lewis stated that Robert Pettis, a state biologist came out and spoke at a town meeting informing residents of the harm in feeding the deer. Despite that effort, residents still feed corn to the deer. Lewis also stated that Mayor Mercer's mother also feeds the deer. She said ranchers have offered to take the deer but that the State must approve it. Most ranchers do not want the state to have the ability to interfere with their land. The other problem is that the council did not approve a budget to move the deer. Ranchers charge 150 to 200 dollars per deer to remove.
Lewis said she has observed deer with their tongues out, broken legs, and rutting season beginning as early as September. Lewis felt these signs show the deer are not healthy and perhaps starving. Well-meaning residents could potentially be injured if they interfere with a rutting buck or tried to assist a deer caught in wire or suffering from broken legs.
Hollywood Park is not the only area in Bexar County, Texas suffering from deer over population. The community of Fair Oaks Ranch located in Northwest Bexar County has had more than a million dollars in landscape damage as a result of the deer. According to the author of "Unwanted Animals Trapped and then Relocated to Mexico," the Texas Parks and wildlife Department has expanded a controversial program to trap hundreds of the animals and ship them to Mexico (MacCormack, 2001). Approximately 20 percent of the estimated 3,000 deer roaming the area will be relocated to the Mexican state of Nuevo Leon in an effort to rebuild their white-tail population. The author states there is a lot of controversy surrounding this program. Trappers worry if they will not make any money if enough deer are not caught for each trip. The rules of the program state the deer must be delivered within 16 hours of being caught. Participants feel the net-and-relocate program is the most humane. Others such as People for the Ethical Treatment of Animals (PETA) say there are better methods to reduce deer populations. Residents either like or hate the deer. One resident has been threatened with arrest for ringing a cowbell to scare the deer away from a net and picketing near the nets (MacCormick, 2001). The author states the program is expected to expand and Hollywood Park officials are hoping to participate.
The Hollywood Park deer population has seen an increase in deer populations over the last ten years. When this study began, it was hypothesized that the deer do not migrate to other areas due to the heavily traveled highways U. S. 281 and Loop 1604. It was believed that these highways acted as barriers preventing the deer from leaving the area, and decreasing the risk of predators contributing to an increase in population.
Using Geographic Information Systems (GIS), it is possible to establish a baseline study for a given population. Population densities can be monitored, movement can be predicted, and follow on studies can assist in more accurately predicting a population's size using Global Positioning System (GPS) in conjunction with GIS. Growth, expansion, distribution, habitat and human factors can all be documented using GIS and GPS.
METHODS
This is a study of the white-tail deer population in Hollywood Park, Texas.
Hollywood Park spans 921 acres from Thousand Oaks and Hwy 281 north to Loop
1604 and eastward to Void's Recreational Center. Specifically, the study area
studied was the southern half of the community which stems from Donella Drive
and Highway 281, south to Hollywood Park City Hall at the corner of Sunway
and Mecca Streets (See Figure 1). Data was collected with a Trimble Pro XRS
real time differentially corrected GPS receiver utilizing a Trimble TSC1 datalogger
and a Laser Atlanta Brand Advantage laser rangefinder (See Figures 1,2). A
data dictionary was created to automate the data collection using GPS Pathfinder
Office Software version 2.51. Deer were classified as points. Attributes or
characteristics were then created for the feature. In this study, the features
were "antlers," "antler less," and "feeder houses." The areas where the deer
where fed by residents or local establishments were defined as feeding stations
or feeder houses. The position logging rate was set at one second.
The highest concentration of deer determined the survey route. Road construction in Hollywood Park also influenced the survey route. The equipment sat in the back of a pickup truck with the GPS receiver attached to a tripod and antennae. Antennae height was approximately 3 meters above the ground, but considered unimportant to the study. The datalogger was attached to the laser and passed through the rear window of the vehicle for the driver to operate. The procedure was to drive the route until deer was spotted. When deer were spotted, the pickup stopped. The point was entered into the datalogger and the feature "deer" was selected. Then the person with the laser unit was ready to "tag" visible deer by targeting them with the laser rangefinder. After each deer was "tagged", the datalogger individual would press enter, and then select which attributes applied, i.e. antlers or antler-less. The position was saved by pressing enter. This procedure was then repeated for each deer seen. Deer that were targeted with the infrared laser beam had its position calculated as a bearing/distance offset. Upon completion of each count, the data was downloaded into Pathfinder Office and the files were converted into shapefiles for use in Environmental Systems Research Institute's (Esri) ArcView mapping software version 3.1.
Population counts were conducted in the morning, noontime and evening over a period of 33 days. The first count conducted was on October 31, 2000 at 7 a.m. The data obtained from this count were not included in the study, it was merely used as a practice run to get familiarized with the area and data collecting process. The final count was taken on December 2, 2000 at 4 p.m. The morning counts began at 7 a.m.; afternoon counts began at 12 p.m.; and evening counts began at 4 p.m. Data was collected on four different days for each specific time frame for 12 population counts.
Data was then analyzed using GIS software. A shapefile showing the streets of Hollywood Park was also used in creating the project in ArcView. The data for each count was then imported into ArcView and superimposed over the streets showing the exact location of each deer counted. Feeder house data was also imported and superimposed over the streets, allowing analysis of the distribution of the deer.
Figure 1 shows the route driven for each count. The tables and figures show the highest counts to be in the evening and the lowest in the morning. Overall, the counts remained consistent during each particular time of day.
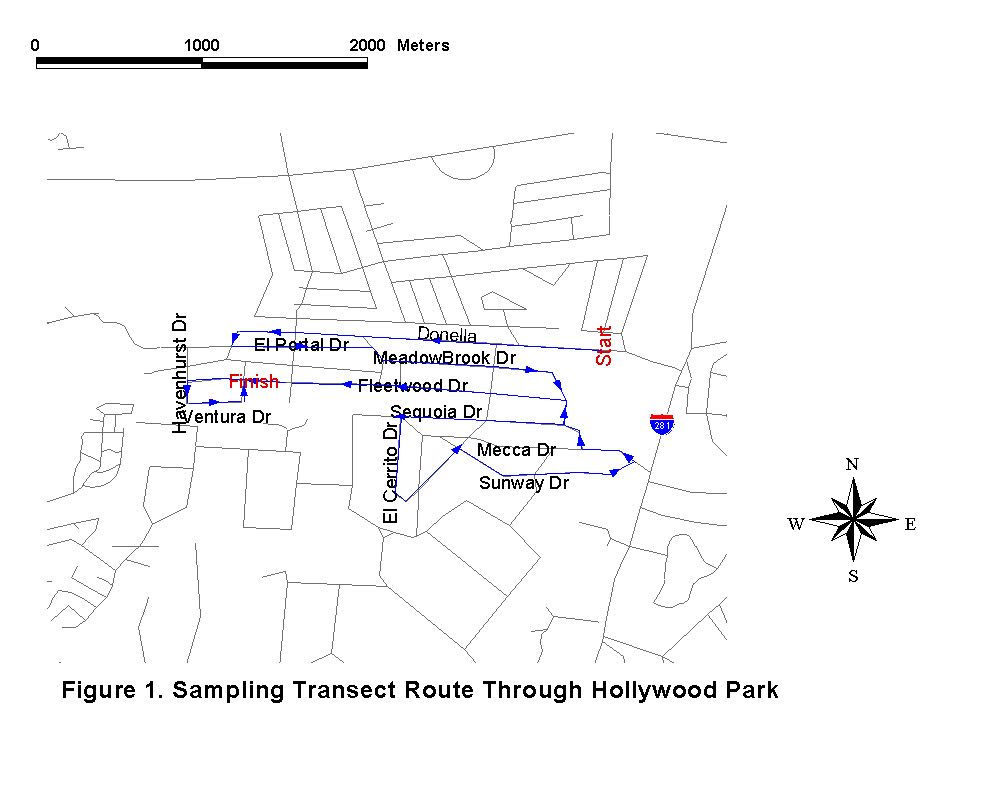
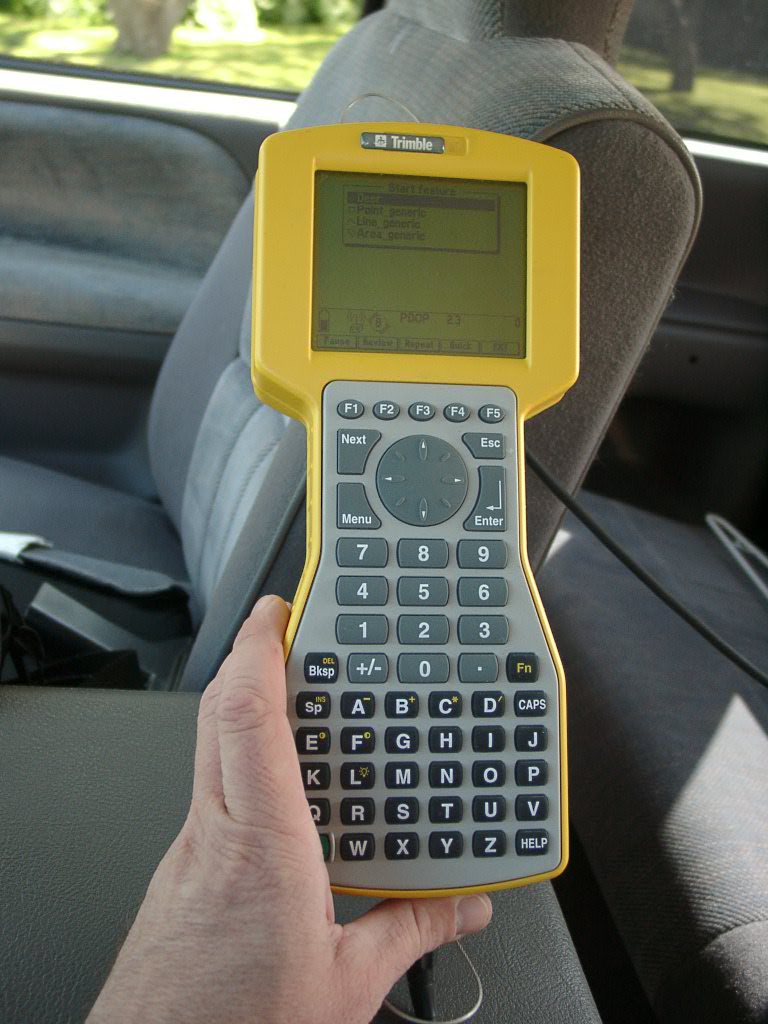
Figure 2. Picture of TSC1 Datalogger. The datalogger Stores the GPS positions of deer observed.
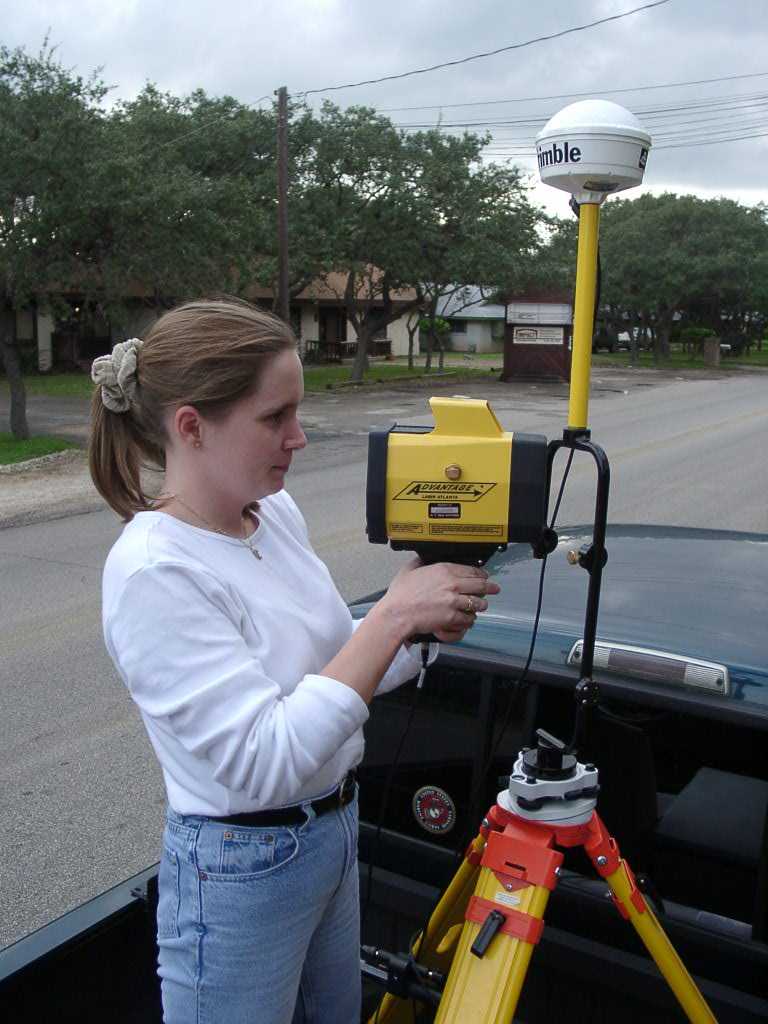
Figure 3. Laser Atlanta Brand Advantage Range-finder. Deer were targeted with the laser from the bed of the truck.
RESULTS
For the results of each count, see Tables 1, 3, and 5. Tables 1, 3, and 5
break down the data according to time of day, date, total count, and characteristics
of antlers and antler-less. The letters a, b, and c, after each date represent
the time of day respectively morning, noon, and evening. Tables 2, 4, and
6 show the standard deviation and average mean for each group. A total of
13 feeder houses were observed during the entire study but are not included
in the tables. The number of deer counted ranged from 152 - 262 and were influenced
by the time of day. The collective morning counts averaged 161 deer, noon
counts averaged 158, and the evening counts averaged 239 deer. These numbers
represent a sampling of the total deer population observed and not an exact
number of total deer residing in Hollywood Park.
The results for the morning counts are shown in Table 1. On November 7, 2000 a total of 152 deer were observed. 125 were antler-less and 27 had antlers. November 9, 153 total deer were observed, 131 were antler-less and 22 had antlers. November 10, 166 deer were observed, of which 143 were antler-less and 23 had antlers. November 12, 171 deer were observed with 139 being antler-less and 32 with antlers.
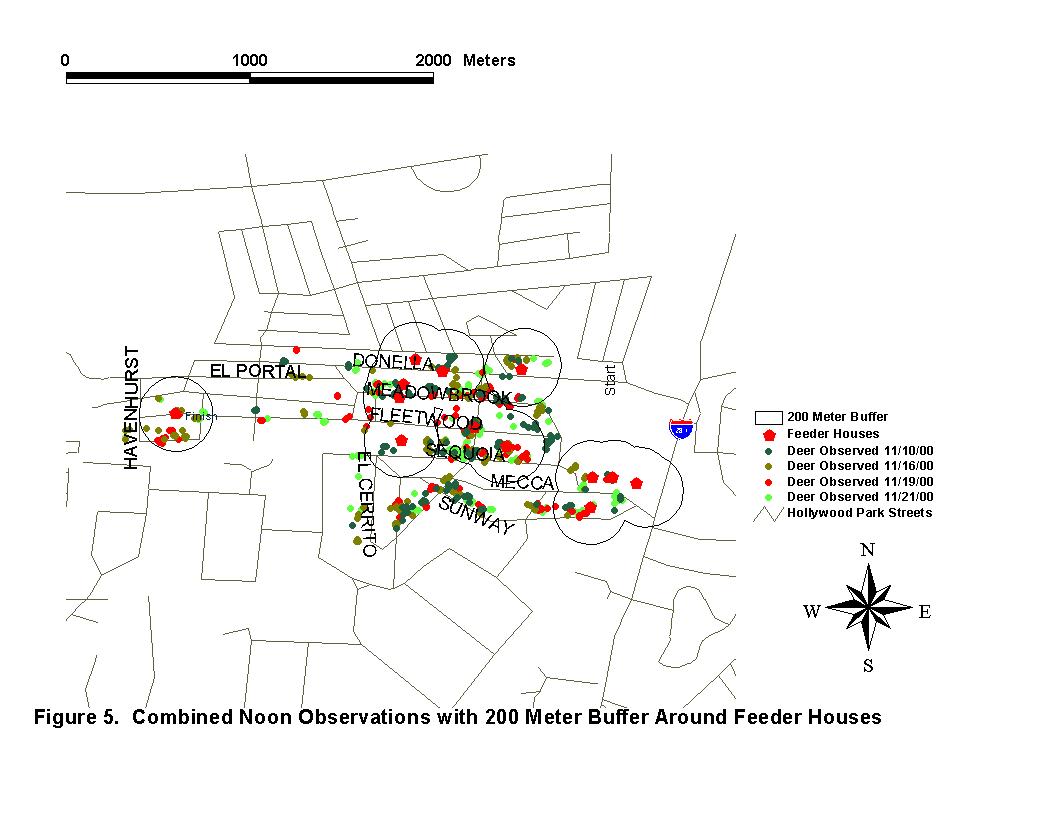
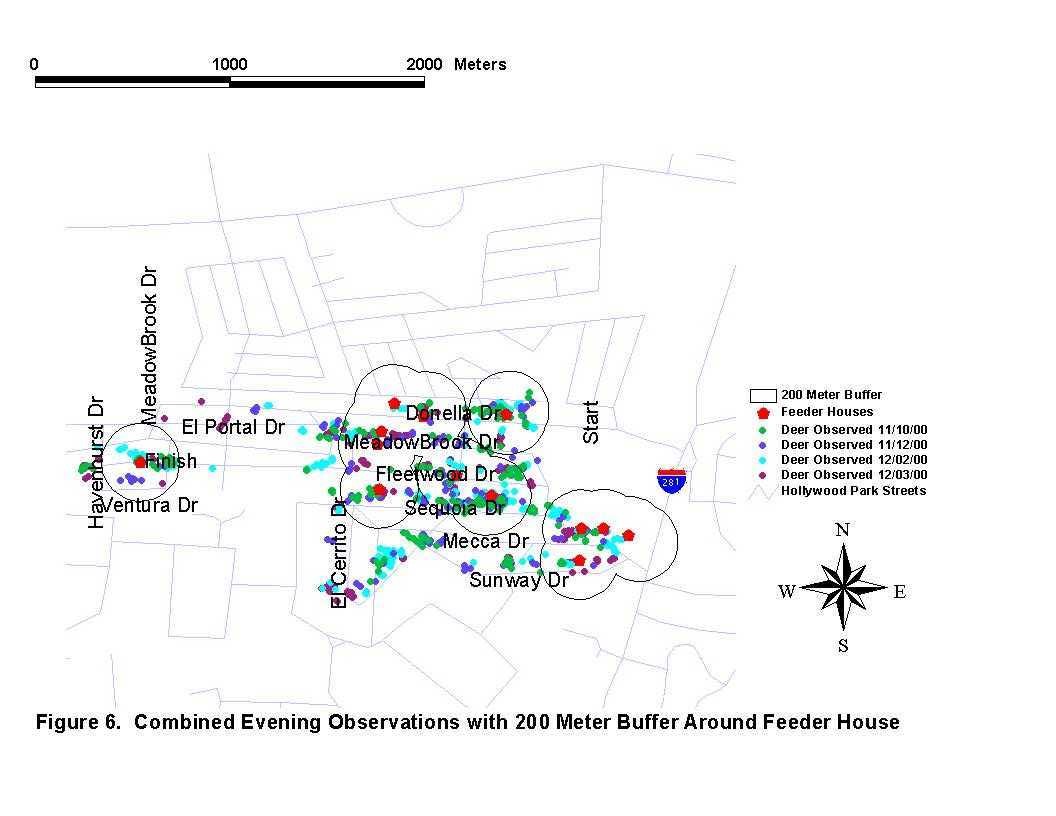
More than half the total deer counted for each day are within the 200m buffer. For the morning counts, November 7 has 72% of the total deer counted within the 200m buffer. November 9 has 66% of the total deer within the buffer, November 10 has 71% of the total deer counted, and November 12 has 70% of the total deer counted within the 200m buffer. The noon counts have the following percentages of the total deer counted within the buffer: November 10 has 62%, November 16 has 60%, November 19 has 68%, and November 21 has 61%. The evening results showed the following percentages of total deer counted within the buffer: November 10 has 72%, November 12 has 73%, December 2 has 69%, and December 3 has 71%. This shows that the deer in this area do not travel far from feeder homes.
|
Dates
|
Time of Day
|
Female (antler-less)
|
Male (antlers)
|
Total Count
|
|
11/7a
|
0700-0830
|
125
|
27
|
152
|
|
11/9a
|
0700-0830
|
131
|
22
|
153
|
|
11/10a
|
0700-0830
|
143
|
23
|
166
|
|
11/12a
|
0700-0830
|
139
|
32
|
171
|
Table 1. Results of Each Morning Count.
Table 2 shows the standard deviation of the morning counts and the mean. The standard deviation is 9.5 and the mean for each group is 160.5.
|
Time of day
|
Standard Deviation
|
Mean
|
|
Mean Morning
|
9.5
|
160.5
|
Table 2. Standard Deviation and Mean for Morning Counts.
Table 3 shows the results for the noon time counts. On November 10, 173 deer were observed of which 147 were antler less and 26 had antlers. November 16, a total of 153 deer were observed. 125 without antlers and 28 had antlers. November 19, 154 deer were observed with 128 being antler less and 26 had antlers. November 21 had a total of 152 deer observed of which 123 were antler-less and 29 had antlers.
|
Dates
|
Time of Day
|
Female (antler-less)
|
Male (antlers)
|
Total Count
|
|
11/10b
|
1200-1330
|
147
|
26
|
173
|
|
11/16b
|
1200-1330
|
125
|
28
|
153
|
|
11/19b
|
1200-1330
|
128
|
26
|
154
|
|
11/21b
|
1200-1330
|
123
|
29
|
152
|
Table 3. Results for each noon count.
Table 4. shows the standard deviation and mean for the afternoon counts. The standard deviation is 10 and the mean for each group is 158.
|
Time of day
|
Standard Deviation
|
Mean
|
|
Afternoon
|
10
|
158
|
Table 4. Standard Deviation and Mean for Afternoon Counts.
Table 5 shows the results for each evening count. November 10, a total of 243 deer were observed with 197 antler-less and 46 with antlers. November 12, a total of 211 deer were observed of which 178 were without antlers and 33 with antlers. December 2, 262 deer were observed with 217 without antlers and 45 with antlers. December 3, 241 deer were observed with 202 without antlers and 39 with antlers.
|
Dates
|
Time of Day
|
Female (antler-less)
|
Male (antlers)
|
Total Count
|
|
11/10c
|
1600-1730
|
197
|
46
|
243
|
|
11/12c
|
1600-1730
|
178
|
33
|
211
|
|
12/2c
|
1600-1730
|
217
|
45
|
262
|
|
12/3c
|
1600-1730
|
202
|
39
|
241
|
Table 5. Results of Each Evening Count.
Table 6 shows the standard deviation and mean for the evening counts. The standard deviation is 21.1 and the mean for each group is 239.2.
|
Time of day
|
Standard Deviation
|
Mean
|
|
Evening
|
21.1
|
239.2
|
Table 6. Standard Deviation and Mean for Evening Counts.
Figures 4-6 show only the counts with respect to time of day as well as all the feeder houses clocked throughout the study. Using Arcview, a buffer of 200m was created with respect to the combined feeder houses. The result displays all the deer in the circle are within 200m of a feeder house. Table 7 shows the breakdown of deer located in the buffers with respect to time of day.
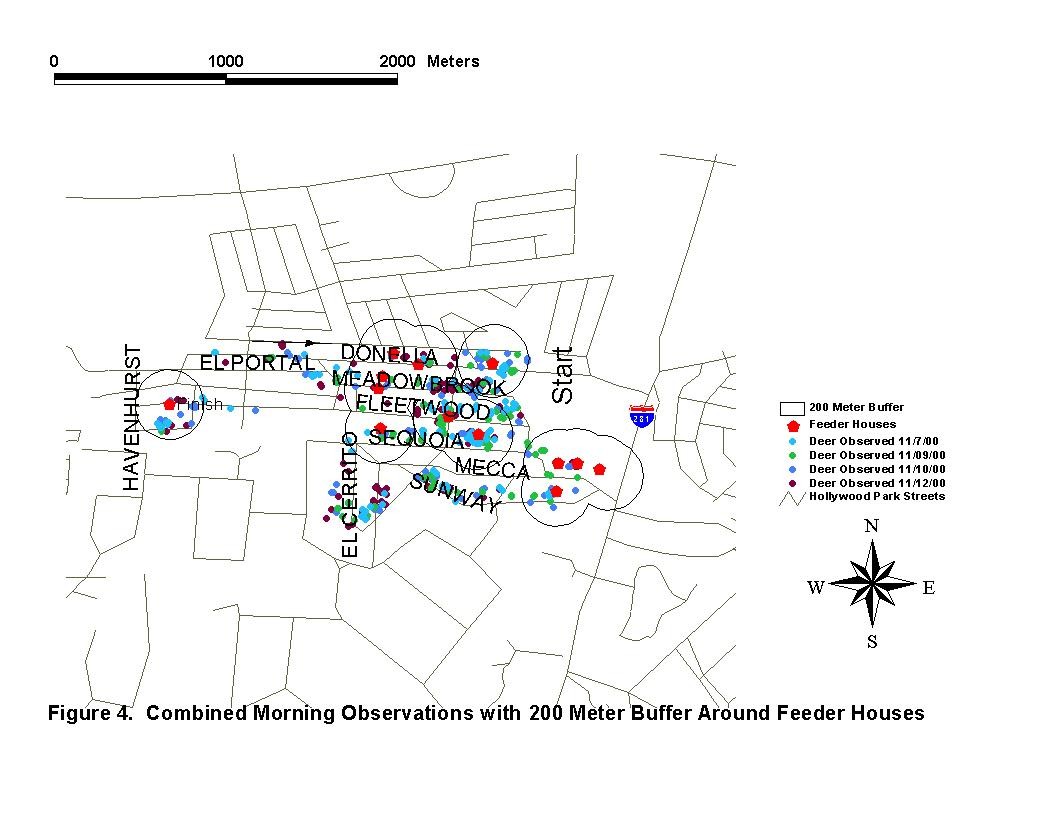
|
Dates
|
Time of Day
|
Total Deer in Buffer
|
Total Deer Count
|
|
11/7/00/a
|
Morning
|
109
|
152
|
|
11/9/00/a
|
101
|
153
|
|
|
11/10/00/a
|
117
|
166
|
|
|
11/12/00/a
|
120
|
171
|
|
|
11/10/00/b
|
Noon
|
108
|
173
|
|
11/16/00/b
|
92
|
153
|
|
|
11/19/00/b
|
104
|
154
|
|
|
11/21/00/b
|
93
|
152
|
|
|
11/10/00/c
|
Evening
|
174
|
243
|
|
11/12/00/c
|
153
|
211
|
|
|
12/2/00/c
|
180
|
262
|
|
|
12/3/00/c
|
171
|
241
|
Table 7. Results of Deer in Buffer a=morning, b= noon, c=evening
Table 8 shows a single factor Analysis of Variance (ANOVA) that was run on the total counts. The p-value is less than .05 demonstrating that there is a statistically significant difference in the amount of deer counted at different times. A Tukey's Honestly Significant Difference revealed that morning and noon counts were the same. Only the evening count is statistically different from the other two (See Chart 1). This could be a result of more resident's feeding in the evening as well as the nocturnal nature of deer.
|
ANOVA: Single Factor
|
||||||
|
SUMMARY
|
||||||
|
Groups
|
Count
|
Sum
|
Average
|
Variance
|
||
|
T1
|
4
|
642
|
160.5
|
89.67
|
||
|
T2
|
4
|
632
|
158
|
100.67
|
||
|
T3
|
4
|
957
|
239.25
|
444.25
|
||
|
ANOVA
|
||||||
|
Source of Variation
|
SS
|
df
|
MS
|
F
|
P-value
|
F crit
|
|
Between Groups
|
17,079.17
|
2
|
8,539.58
|
40.37
|
3.2034E-05
|
4.26
|
|
Within Groups
|
1,903.75
|
9
|
211.53
|
|||
|
Total
|
18,982.92
|
11
|
Table 8. Results of Single Factor ANOVA.
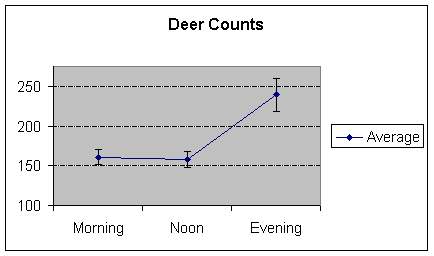
Chart 1. Average counts with standard deviation.
A single factor ANOVA was also done on the total deer in each buffer vs. the total deer in each count (See Table 7 for data). The results of this analysis can be found in Table 9.
|
ANOVA: Single Factor
|
||||||
|
SUMMARY
|
||||||
|
Groups
|
Count
|
Sum
|
Average
|
Variance
|
||
|
Feeder House
|
12
|
1,522.00
|
126.83
|
1,095.42
|
||
|
Total Count
|
12
|
2,231.00
|
185.92
|
1,725.72
|
||
|
ANOVA
|
||||||
|
Source of Variation
|
SS
|
df
|
MS
|
F
|
P-value
|
F crit
|
|
Between Groups
|
20,945.04
|
1
|
20,945.04
|
14.85
|
0.000862
|
4.30
|
|
Within Groups
|
31,032.58
|
22
|
1,410.57
|
|||
|
Total
|
51,977.63
|
23
|
Table 9. Anova results for deer in buffer.
Table 9 shows the p-value to be less than .001, suggesting that for the population sampled on all counts between 0700 and 1800 over a period of 33 days, there is no statistically significant difference between the amount of deer located within 200 meters of the feeding houses and the whole herd. Statistically speaking, the entire population keeps themselves within 200 meters of each designated feeder house. Therefore, the entire population can be estimated by the deer in the buffer zones. Chart 2 shows the averages of the two groups with standard deviations.
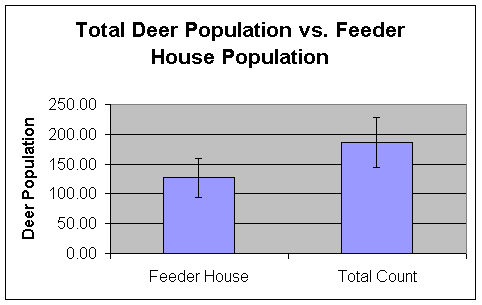
Chart 2. The Total Deer Population vs. Feeder House Population.
CONCLUSION
The deer population in Hollywood Park is overabundant and a nuisance to some
residents. It was originally hypothesized that the large population was due
to their inability to migrate to other areas because of highways 281 & 1604.
The area was studied to obtain an accurate sampling count and distribution
models of the deer, and identify factors that may be keeping the population
growing as well as clustered.
In studying a large mobile population such as deer, the most important thing is to be able to obtain a count to assess the population and accurately show their distribution. The consistency of the counts taken in this study, the accuracy of deer locations plotted, and the ease with which the researchers could use the equipment supports the methodology of using GPS equipment in conjunction with GIS mapping software to study wildlife populations. One can obtain a count and accurate distributions of the population. Thus, allowing an individual to describe the population accordingly.
The evidence found throughout the study shows that the deer are not trapped by Highway's 281 & 1604, rather they remain in the area due to numerous feeding opportunities. Deer take advantage of available landscapes, food from residents, and lack of predators in the area. The population will probably only decrease when resident's refrain from feeding, disease strikes, or some of the deer are trapped and relocated.
Currently, the community is discussing such options as relocation, spaying, or euthanasia. Follow-up research will be necessary to determine if the population decreases, once the community implements such options. It will be interesting to see how the population responds and how quickly it grows beyond control if residents continue to feed even after one or all of the above measures are taken.
Further research in this study is necessary for many reasons. One reason is a the lack of methodologies using this equipment for population studies. Improvements on accuracy need to be explored in order to obtain accurate counts of a population. Ideas of how to improve the methodology used in this study should be explored to better assist future researchers. Community perception and education about the deer also can be explored. Lack of understanding and education on the part of the residents perhaps has fueled the growth of this population. Texas Parks and Wildlife needs to be more receptive to community concerns on over population. In conjunction with Parks and Wildlife citizen groups need to work in to resolve these situations.
Overall, GPS/GIS can be used to obtain counts of deer at different times and show their unusually large distribution of groups near feeder houses. The distribution maps may be used in assessing the population and in educating the resident's on the magnitude of the problem. GPS mapping is easy to use and allows one to obtain different kinds of information at one time and later evaluate it through mapping.
BIBLIOGRAPHY
Butfiloski, J.W., Hall, D.I., Hoffman, D.M., and Forster, D.L. 1997. White-tailed Deer Management In A Coastal Georgia Residential Community, Wildlife Society Bulletin,Vol 25, pp. 491-495.
DeNicola, A.J., VerCauteren, K.C., Curtis, P.D., and Hygnstrom, S.E. 2000. Managing White-Tailed Deer in Suburban Environments. A Technical Guide. Cornell CooperativeExtension, Ithaca, NY.
Environmental Systems Research Institute, Inc. 1999. Getting to Know ArcView GIS. Environmental Systems Research Institute, Inc, Redlands, California.
Feldhamer, G.A., Gates, J.E., Harman, D.M., Loranger, A.J., and Dixon, K.R. 1986. Effects of Interstate Highway Fencing on White-Tailed Deer Activity, Journal of Wildlife Management, Vol 50(3), pp.497-503.
Hansen, L. and Beringer, J. 1997. Managed Hunts to Control White-Tailed Deer Populations On Urban Public Areas in Missouri, Wildlife Society Bulletin, Vol 25, pp.484-487.
Kuznik, F. 1998. Eating Themselves Out of House and Home, National Wildlife, pp. 38-43.
Lewis, L. 1999. Interview by phone with Hollywood Park resident and former head of the Deer Committee.
MacCormick, Zeke. 2001. Unwanted Animals Trapped and then Relocated to Mexico, San Antonio Express News, A Section; pp. 1A.
McCullough, D.R., Jennings, K.W., Gates, N.B., Elliott, B.G., and Didonato, J.E. 1997. Overabundant Deer Populations in California, Wildlife Society Bulletin, Vol 25, pp.478-483.
McShea, W.J., Underwood, H.B., and Rappole, J.H. 1997. The Science Of Overabundance: Deer Ecology and Population Management Smithsonian Institution Press, Washington and London.
Mercer, G. 1999. Interview by phone with then Mayor Gary Mercer of Hollywood Park.
Messmer, T.A., George, S.M. and Cornicelli, L. 1997. Legal Considerations Regarding Lethal and Nonlethal Approaches to Managing Urban Deer, Wildlife Society Bulletin, Vol 25, pp.424-429.
Miller, A. 2001. Devoured landscapes can cost owners deerly, San Antonio Express- News, Special Section; pp. 18M. March 4, 2001.
Radeloff, V.C., Pidgeon, A.M., and Hostert, P. 1999. Habitat and Population Modeling of Roe Deer Using an Interactive Geographic Information System, Ecological Modeling, Vol 114, pp.287-304.
Schmitz, B. 1998. Deer Attacks: Protecting her young, Prime Time Newspapers, June 25 1998.
Storm, G. L., Cottam, D.F., Yahner, R.H., and Nichols, J.D. 1992. A Comparison of 2 Techniques for Estimating Deer Density, Wildlife Society Bulletin, Vol 20 (2), pp.197-203.
Trimble Navigation Limited. 1999. Pathfinder Office. Trimble Navigation Limited, Sunnyvale, California.
Trimble Navigation Limited. 1999. TSC1 Asset Surveyor. Trimble Navigation Limited, Sunnyvale, California.
Brandalena Gianette
Blake
The University of Texas at San Antonio
Department of Earth and Environmental Sciences
6900 N. Loop 1604 West
San Antonio, Texas 78249-0663
210-458-4956
hm3blake@earthlink.net
Stephen C. Brown
The University of Texas at San Antonio
Department of Earth and Environmental Sciences
6900 N. Loop 1604 West
San Antonio, Texas 78249-0663
210-458-4956
sbrown@utsa.edu