Abstract. Volcanoes are a very important component in the geological description of the earth. A volcano can modify the geographical description where it is localized when an event arrives. An important activity is the observation of volcanic events to make predictions and to reduce the impact hazard (eruption, volcanic ash) on the population. Around the Popocatepetl volcano there are about 200,000 persons in several towns. The volcano events can be identified and placed on a map to help make a decision. A first work has been developed with old cartography of the zone. A first prototype has been built, and now it is used to develop an application with a geographical database. The work is made in collaboration with the Plan Popocatepetl Office from the Puebla government and CENAPRED (Centro Nacional de Prevencion de Desastres) in Mexico City. Some tools are developed to place the application in a network context. The application will be a tool to help the decision makers to protect the population.
For the last seven years, the Popocatépetl volcano has shown some important activity. This volcano covers three different states: Estado de Mexico, Morelos and Puebla. There are several urban cities that are in risk, and they don't have something to help people to make their decisions. The government use to make decisions printed information and doesn't have any automatic procedure to do it. This produces slow results and sometimes with out accuracy. That´s why we proposed first a model to represent spatial and non spatial data and then an application. We are trying to avoid losing time and data failure. The manager of the Popocatépetl office has a lot of experience and knows very well the zone. His decisions are very important for the people at his office, who work just with printed items. Printed maps indicate the danger around the volcano. These maps have been provided by CENAPRED (National Center for disaster's prediction) the organism which is responsible of monitoring the volcano [3].
An emergency map indicates that 10 km around the crater is a very dangerous zone. Nobody lives in this area. From 10 km to 20 km we have a dangerous zone. Several towns are located in this area but the closest town is 12 km from the crater. However the plan of the government to re-localize these habitants is not feasible, because the towns have been established in the XVII century and now people use to work the ground. It is very useful to have a good plan to help people in case of danger. This plan must include the actions needed to keep order when evacuating each town. Puebla's government works based on the Plan Operativo Popocatépetl office to coordinate the actions of evacuation in case of danger. Figure 1 shows the zones of danger around the Popocatépetl volcano.
Several scenes of danger had been described by CENAPRED and the Plan Operativo Popocatépetl office. Four stages of danger are actually described for these scenes:
With this classification the Plan Operativo Popocatépetl office decides which towns have to be helped. The Office has made an estimation of the resources needed to execute a plan. The parameters estimated by the office are the following:
Fig. 1. Risk Management Map in the Volcano Popocatépetl Zone
Our goal is to create a model to reflect this problem and an application which implements the model. The next section describes the work made around this context.
Our group of research started working on this problem in year 2000. Several components have been developed to have an application which responds the needs presented in the last section. In [4] is described a translator from shp format to OpenGIS, a standard representation of geographical data. In [9] is presented a first prototype of the volcano zone by using a 1:250 000 cartography. This work is described also in [18]. The work developed in [19] shows a tool to visualize geometric data in a internet environment. The 9 intersection topology, which supports the queries in our project is described in [8]. The component added by [15] generated a module to edit and to correct cartography in ArcView GIS before to store it in the database. In this context, this paper describe the work developed by Morales A. [12] and Montero L. [11]. These works integrated the database and a tool to query the database in an internet environment. Figure 2 shows a general scheme of the project with the different components. The components described in this paper are situated at the Organization of data level and at the Services level
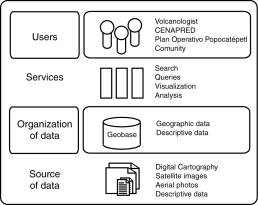
Fig. 2. Popocatépetl Volcano Project
The model of the database was built when the first prototype, the translator, the tool to visualize, the module to edit and to correct and the module which supports the queries were developed. The database and the module to support the queries are the base for the application to access the database in an internet context. We describe first the data modeling and the database, and after we describe the query application.
Our Geographic Database (GDB) includes two kinds of data: spatial and non spatial. The general scheme of our model is based on the geometric data management proposed by [6]. Our group of research has also previous experience in developing data models for geometric data [17]. Cartography of danger modeling supported also some ideas developed in our work [10]. The spatial data manages the position of geometric objects within an area. The basic objects are: points, lines and polygons. Each type of geometry have a representation within our GDB. The non spatial data is related to the spatial data. This type of data is known as descriptive data. For instance, a road is represented by a sequence of lines in a GDB. A road can be described by its longitude, the towns related, its width, etc. The set of data related to a geometric object is represented within the GDB. All the objects (spatial and non spatial) are modeled by using the OpenGIS specification (see [13]).
The source for the spatial data is a cartography 1:20 000 of the Popocatépetl volcano region. We start to identify the important geometric objects for our model and for our application. We remember that the goal is to provide a tool to help in the making decision process. Each type of object is modeled by a layer. The initial layers, included in our database are shown in the figure 3. A parallel work [15] generated a tool to clean the cartography. This tool was included as an extension in ArcView GIS. The initial representation of the geometric objects is shp, which is the ArcView proprietary format. The geometric data were then translated to the OpenGIS specification by using the translator created by Garcia F. in another work developed in our project [4].
Fig. 3. Layers included in the Popocatepetl Volcano Project
The layers model the geometric components related to Popocatépetl volcano. Each type of geometric component is associated to descriptive data. Several meetings with the experts in the area allow us to understand the problem and to identify the important data. A data model was developed to reflect the problem. Then we started to obtain the data associated to each geometric component. The data were provided by Plant Operativo Popocatépetl Office and by INEGI (Instituto Nacional de Estadística, Geografía e Informática). We got information about:
The data model proposed is shown in the figure 4. In the model we can see how non spatial data is related to spatial data. For each type of object we present an icon and it can be related to a basic geometric object (point, line, polygon).
Fig. 4. General data model for the Popocatépetl volcano project
Once we got the characteristics and spatial data for this objects, we modeled the information using a standard notation for the geographic applications [7].
Our data model was integrated by using the OpenGIS specification [13]. This specification is a standard to represent geographic data. The specification includes a structure to store geometric objects. Each geometric object uses a set of operations. The specification indicates how these operations are related to an object. In particular, these operations are used inside an application which matchs the database. The operations will be described in the next section when a tool to access the database will be presented. Figure 5 describes the database structure proposed by OpenGIS. With this specification is possible to relate non spatial data with spatial data. The specification is implemented in a relational model. The model contains a first structure to represent the spatial reference (SPATIAL_REFERENCE_SYSTEM, figure 5). This spatial reference is related to other structure (GEOMETRY_COLUMNS, figure 5) which controls a set of layers which together can represent a real problem. Each layer is represented by one type of feature. The principal features are point, line and polygon. However, the specification models a hierarchy of features (see figure 5). A particular feature is represented in another table. Each type of feature is related to the tables which store all the points needed for the feature. A line needs two points and a polygon needs a sequence of points (at least three points). All the points need to be stored in the database.
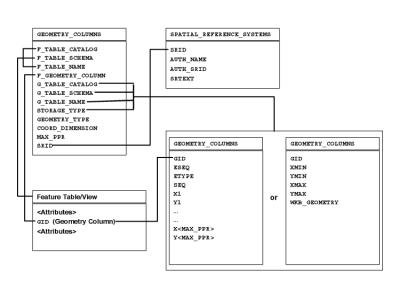
Fig. 5. General scheme for the OpenGIS specification
The goal of the OpenGis specification is to create a standard SQL scheme to support the storage, recover, query and updating the geo-spatial characteristics [13].
Our application implements the model that has been described in the last section. The principal goal of our model is to help and to support the making decision process around the volcano problem. The data modeling is trying to reflect the real structure and function of the data. The access to data is another very important component of our application. This module was designed to read and to manage the OpenGIS specification. The application was designed to access data in an internet environment. A servlet [2] interface which can read from the database was implemented. The Queries component is the core of this module. It is related to the Class component and the External Class component. The first one manages a set of queries that have been proposed by an expert. In this case the expert is the manager of the Plan Operativo Popocatépetl office. The second component supports the query process with a set of classes which manage the 9-intersections OpenGIS protocol [8]. When a query needs a spatial query the Class component calls this component. Finally the Queries component access the database. In fact all the data is retrieved from the database and processed by the Class, Queries and External Class components. The figure 6 shows the general architecture of our application which includes the database and the components to process the queries.
Fig. 6. General Architecture
The application includes a servlet because of three important reasons:
With a servlet we can put together JAVA statements with HTML statements and manage different processes during the creation of the final HTML code. We created different type of code segments to be able to develop some important activities like obtaining all the information that we needed from the database in an automatic process. Also we had to think about the multiple data structure capable to keep all the global database format. We remember that the OpenGIS specification used in the database is matched with structures used inside our application.
The most important component to execute the queries is Class. It represents the OpenGIS hierarchy. The basic geometric objects point, linestring and polygon support all the specification. These basic objects can be extended to represent more complicated geometric objects. They are also used to represent real objects like roads, towns or counties. The figure 7 shows the general hierarchy of the classes.
Fig. 7. Class Hierarchy of our application to access the Geographic Database
Each class in our design matchs a component in the database, models a spatial object and has a set of parameters to describe more in detail the real spatial object. An object can be represented by more than one geometry. For instance a county can be represented by a polygon but in another scale the county can be modeled by a point.
The spatial queries are a combination of spatial and non spatial data. Our application executes this type of query by joining the spatial with non spatial data. The geographic database includes spatial keys which permit to relate both types of data. The query can be processed by different ways. However, at the actual state of our application, the non spatial data are processed first, and after the spatial data are searched and located to describe a localizable area. It seems that another method could be more useful and with a better performance. This method process first the spatial query, and after it looks for the non spatial data. However this is work of another research that we have in process [1]. The next section will show some examples of queries and the interfaces that we have implemented to access the database.
The tests made by our application were suggested by the expert. The queries give simple answers to the decision makers questions. These people need to collect data from several sources and this type of application allows them to ask the application and then to interpret the result. For instance a possible question is: how many people in towns we have to take out from 15 kilometers around the crater ?. We have to go to the descriptive table, and check the number of people that have to be evacuated. Then get the number that identifies the town with it's geographical representation and get all the points. Get the centroid and calculate the distance, and so on with all the towns that are inside the wished radio. Figure 8 shows the interface that the expert uses to interact with our application.
A second question is: given a town, how many people have to be evacuated ? We have to go to the descriptive table again, and create a new town object getting all it's information from the data base and then show the results. Figure 9 shows the results in the servlet interface implemented for our application.We have to say that the people who's going to maintain the database is very important because this database could be as big as they want. The region related to the volcano has been classified in 6 roads of evacuation. At the actual state of our application the database contains 2 roads of evacuation. We work with the people responsible of this information and we will include the rest of the data. We think that the application will be very useful for the expert who participates in the decision making process.
This paper presented a geographic data model and an application for the Popocatépetl volcano problem. The first step was to understand and to identify the decision making process. At this moment the data needed for this process were also identified. The geographic data model included the relation between spatial and non spatial data. This model was built by using the OpenGIS specification. This specification proposes a representation to manage geographic data. Our application implemented in a relational database the geographic data model.
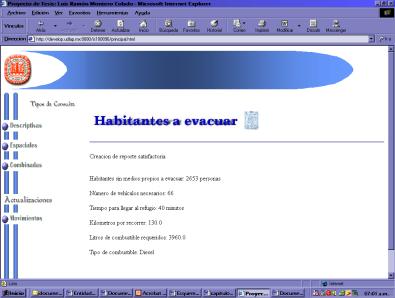
Fig. 8. Number of people to evacuate to 15 km from the crater
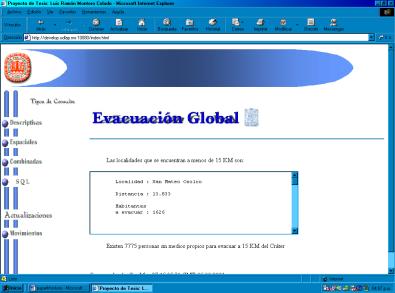
Fig. 9. Number of people to evacuate for a given town
An application which uses spatial and non spatial queries was also implemented and several queries proposed by the expert were included. We think that the geographic model take advantage of the experience of the group and combine the OpenGIS specification and the data model proposed by [7]. The construction of the application included new technologies like Java Servlets.
Actually the group work in an extension to manage 2D and 3D geographic in a standard format [16] proposed by the OpenGIS consortium. The consortium has proposed a map service by using its Abstract Specification and GML (Geographic Markup Language). GML is a language developed as an extension of XML (eXtended Markup Language) and it can represent and exchange in 2D and 3D formats. Another option to handle 3D data is managed by the World Wide Web Consortium. This initiative is built to support the interoperability in an internet context. This consortium is the creator and the principal promoter of XML and all the technologies related to this language. In fact, there is a very close work between OpenGIS and W3C in the context of GML. However W3C manages two other specifications which seem to be also good solutions to represent and to model 3D spatial data in a standard format. The first of these specifications is SVG (Scalable Vector Graphics) which principal objective is to manage vector data with good quality and accuracy. The second specification is X3D which is equivalent to VRML (Virtual Reality Modeling Language) but with the difference that X3D is an extension of XML. Both specifications VRML and X3D allow the management of 3D data documents. In particular, our proposal is to work with GML to retrieve the data and after the results of a query can be presented by using SVG or X3D. XSL (eXtended Stylesheet Language) is a technology which allows the translation between XML formats. We start to work with our cartography in shp format to translate into SVG and X3D. The first test changes 2D spatial coordinates to SVG and VRML. An example to visualize the Popocatépetl 3D model is shown in the figure 10.
Fig. 10. 3D Popocatépetl Volcano Model
Other types of analysis will be included to estimate alternative evacuation [14] roads and analysis with a more sophisticated tool of queries [1]. Another tool to include in our project will allow us to identify differences between two or more towns closed to Popocatépetl volcano [5].
[1] Aragón Pacheco S. Modelado de consultas espaciales y no espaciales. Reporte Interno CENTIA. Universidad de las Américas-Puebla. December 2000.
[2] Bergsten H. Java Server Pages. O'Reilly, 2000.
[3] CENAPRED. Centro Nacional de Prevención de Desastres, www.cenapred.unam.mx. April 2001.
[4] García Ontiveros, F. Exportación de datos usando OpenGis. Tesis Licenciatura. Ingeniería en Sistemas Computacionales. Departamento de Ingeniería en Sistemas Computacionales, Escuela de Ingeniería, Universidad de las Américas-Puebla. February 2000.
[5] Gómez Solís H. Herramienta de análisis urbano en un GIS. Tesis Licenciatura. Ingeniería en Sistemas Computacionales. Departamento de Ingeniería en Sistemas Computacionales, Escuela de Ingeniería, Universidad de las Américas-Puebla. May 2001.
[6] Laurini R. Les bases de données en géomatique. Série Géomatique Hermes, 1994.
[7] Lbath A. Un environnement visuel pour la conception et la génération automatique d'applications géomatiques. Thèse de Doctorat. INSA de Lyon, France. November 1997.
[8] Loranca Mateos, O. Consultas espaciales en una arquitectura de componentes GIS. Tesis Maestría. Ciencias con Especialidad en Ingeniería en Sistemas Computacionales. Departamento de Ingeniería en Sistemas Computacionales, Escuela de Ingeniería, Universidad de las Américas-Puebla. October 2000.
[9] Loyo Ramos E. Prototipo de un SIG para el volcán Popocatépetl. Tesis Licenciatura. Ingeniería en Sistemas Computacionales. Departamento de Ingeniería en Sistemas Computacionales, Escuela de Ingeniería, Universidad de las Américas-Puebla. May 2000.
[10] Monmonier M. Cartographies of danger. September 1998.
[11] Montero Colado L. Herramienta de consulta para un SIG de relieves volcánicos. Tesis Licenciatura. Ingeniería en Sistemas Computacionales. Departamento de Ingeniería en Sistemas Computacionales, Escuela de Ingeniería, Universidad de las Américas-Puebla. May 2001.
[12] Morales Xique A. Modelado y construcción de una base de datos geográfica. Tesis Licenciatura. Ingeniería en Sistemas Computacionales. Departamento de Ingeniería en Sistemas Computacionales, Escuela de Ingeniería, Universidad de las Américas-Puebla. May 2001.
[13] OpenGIS Simple Features Specification For SQL. Revision 1.1. OpenGIS Project Document 99-049, Release Date: May 5, 1999. http://www.opengis.org.
[14] Posada Toledo N. Mecanismos de CBR para estimar rutas de evacuación. Reporte Interno CENTIA. Universidad de las Américas-Puebla. May 2001.
[15] Ramirez Limón J. Corrección y edición de cartografía de un SIG volcánico. Tesis Licenciatura. Ingeniería en Sistemas Computacionales. Departamento de Ingeniería en Sistemas Computacionales, Escuela de Ingeniería, Universidad de las Américas-Puebla. May 2001.
[16] Razo Rodríguez A. Formatos espaciales de datos en 2D y 3D para un SIG volcánico. Reporte Interno CENTIA. Universidad de las Américas-Puebla. May 2001.
[17] Sol D. Posada N. Object Oriented Database for a GIS. GIS and Remote Sensing. WIT Press, 2000.
[18] Sol D. Razo A. Loyo E. Natural Hazards in the Popocatépetl Volcano Zone. Workshop on Advanced Techniques for the Assessment of Natural Hazards in Mountain Areas. Innsbruck, Austria. June 2000.
[19] Vera Carrillo E. Herramienta de consulta y visualización en un SIG volcánico. Tesis Licenciatura. Ingeniería en Sistemas Computacionales. Departamento de Ingeniería en Sistemas Computacionales, Escuela de Ingeniería, Universidad de las Américas-Puebla. December 2000.