Michael Byrne, Rob Coman, Sky Harrison, Eric Lehmer, and Jim Quinn
The California Department of Health Services (DHS) is responsible for mapping and completing Drinking Water Source Assessments for 18,000 active public drinking water sources in California. Using Microsoft Visual Fox Proâ, Trimble Pathfinder Officeâ, Microsoft Visual Basicâ and Esri ArcIMSâ, the Information Center for the Environment (ICE) at UC Davis has put in place tools to map source locations, delineate source water protection zones and identify possible contaminating activities for all public drinking water sources in California. Completed assessments are expected for all sources by spring 2003.
In 1996 the US Federal government reauthorized the Safe Drinking Water Act (US EPA 1997). The reauthorized legislation required each state to assess drinking water sources. In 1997, the California Department of Health Services (DHS), the permitting agency for drinking water in California, began implementation of its Drinking Water Source Assessment Program (DWSAP). The Information Center for the Environment (ICE) at the University of California Davis was chosen to put in place a Geographic Information System and database infrastructure to provide DHS with the tools necessary for a DWSAP.
DHS requires an assessment to include five elements (CA DHS 1997). First, an accurate map of all the drinking water sources in the State. Second, a delineation of the protection zones for all sources. Third, an identification of all Possible Contaminating Activities (PCA’s) considered potential origins of contamination to a source. Fourth, a determination of which PCA a source is most vulnerable. Fifth, the availability of all the assessments performed to the public.
An accurate assessment of the drinking water resources in California is cumbersome to say the least. There are approximately 18,000 active public drinking water sources in California (PICME 2001). Of these, approximately 16,500 are ground water sources, while the remaining 1,500 are surface water sources. No accurate map of all sources, either groundwater or surface water, exists. The location information that does exist, at best establishes within a single square mile, the source location (Dooher and Happel, 1999). In fact, while the California DHS is the permitting agency for drinking water wells, two other state agencies have programs with unclear jurisdictional overlap for well siting, digging, and maintenance. Competing agency politics and use of differing source identifiers complicates source locations further. Apart from other struggles, the current locations alone are not accurate enough to provide a consistent assessment.
California is a geologically diverse state. California has recent volcanic activity in the Cascades. The Sierra range is geologically young and still growing. California’s tectonic activity contains one triple conjunction and countless active faults. Moreover the soil conditions range from fractured rock in mountain regions to 40,000 feet of alluvium in the Central Valley (Mount 1995). While reasonable geologic maps exist, no consistent large-scale framework geologic, soil, or groundwater data set exists. Lacking such a data set makes identifying protection zones for all 18,000 sources in California extremely challenging.
California human geography complicates things even further. California’s population, urbanization, commercial industry, agriculture, and mining history all pose potential threats to clean safe drinking water. California’s population boasts over 34.4 million people (CA Department of Finance 2000), living in over 400 incorporated cities, and growing each year. California is the 6th largest economy in the world with industry including manufacturing, high tech, and textiles. California has over 70,000 farms totaling over 27,000,000 acres, which occupies nearly a third of the state (US Department of Agriculture 1997). Finally, while California’s history was established in mining, modern consequences from this industry have left over 30,000 abandoned mines dotted throughout the state (California Department of Conservation 2001). These diverse threats make up over 170 possible contaminating activities (PCA’s) to California’s drinking water.
The US Environmental Protection Agency has allocated $7,000,000 for California’s Drinking Source Water Assessment Program. Given the more than 18,000 sources, that is just over $300 a source for completion of the difficult task of a statewide assessment. Moreover, in order to complete all tasks, given the limited timeline, an average of no more than 4 hours per source can be allocated.
Given the constraints mentioned above, the tasks at hand seemed insurmountable. In order to succeed, DHS contracted with ICE to aid in the process. ICE has developed a series of tools, which will provide for a reasonable assessment of California’s drinking water in the allotted time, and on budget. Moreover, these tools will allow for a more consistent database and ensure data integrity of California’s drinking water. Finally ICE has facilitated a Data Advisory Committee (DAC) with members from other agencies to aid in the process. The DAC has proven to be instrumental in the program’s success. This paper describes the tools developed, outlines the current data developed and provides some discussion for the future direction for California’s Source Water Assessment.
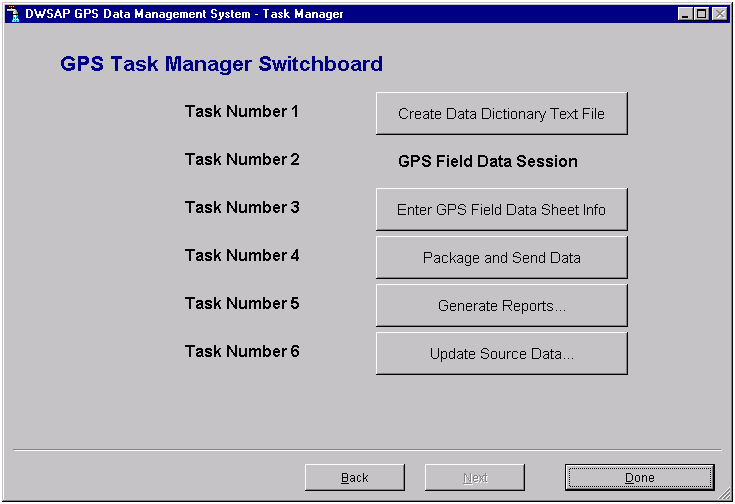
ICE has developed tools for each step in the assessment process. These tools have been distributed and are being used by field personnel in the California Department of Health Services and local agencies with jurisdictional authority (a.k.a. Local Primacy Agencies). Some tools have been distributed to private water agencies. This section describes each of the tools and the Data Advisory Committee.
The challenge presented in identifying source locations was four fold: 1) the current spatial accuracy for source information far exceeded the minimum +-25 feet required accuracy; 2) mapping needed to take place prior to assessments and within about a 2 year period; 3) to ensure project goals, a minimum of 50 people would be needed to map source locations; and 4) attribute data at the source needed to be collected.
To meet all of these challenges, ICE decided to build a thick client application to manage GPS data. The application communicated with Trimble Pathfinder Officeâ, stepped minimally trained employees through the process, and enforced data quality standards. We then provided post processing of location information through a central location to channel all data, and have the thick client retrieve post processed information from a master server and obtain new records to map.
ICE used Microsoft Visual FoxProâ to develop a thick client application to manage the GPS location identification. Each application contains a custom data set of each local district or agency’s source jurisdiction. The application is designed with a wizard look and feel to walk users through the process of: 1) creating a custom data dictionary; 2) identifying mapping success; 3) attribute and establish meta data; 4) upload meta data and rover files to a master data base; and 5) download post processed location data.
For the complete users guide to the GPS Data Management System, see http://swap.ice.ucdavis.edu/GPS/manual.html.
Image 1. GPS Data Management System Control screen.
The challenge presented in source water protection zone delineation was three fold: 1) No framework data exists to create protection zones based on soil, geology or relief; 2) consistent zone delineation methodology must be distributed to all personnel developing assessments (could be in the 100’s of staff); and 3) EPA requires high spatial accuracy map locations with significant ancillary data information.
A protection zone around a well can be defined in terms of its physical geography. Any area, which would immediately carry contamination to the source, is the protection zone. For surface water sources a protection zone is defined as the watershed above the source. While the same principle holds for ground water, a radial distance around the source is a more conservative approach to protection zone delineation. A fixed radius around each source can be calculated given a uniform equation (CA DHS 1997). The equation for the calculated fixed radius is:
_________
Rt = Ö Q t /P h H
where:
Rt = radius (in feet) for time period t Q = pumping capacity (ft3/year) t = time travel (years) 2, 5, or 10 P = 3.1416 h = soil effective porosity H = screened interval of well (in feet)
Using GIS technology coupled with an Internet application, we have put in place an application where local experts can define these parameters and the two, five and ten-year radius protection zones are created around a source.
To meet these demands ICE has used Esri’s ArcIMSâ to develop this mapping tool. The mapping tool contains all sources, tools for calculating the fixed radius protection zones with direction of groundwater flow, a seamless USGS Digital Raster Graphics 1:24000 quadrangle backdrop, and method for reporting calculate information. This is a thin client tool, requiring only browser software and Internet access for distribution.
Image 2. Sample output from the Mapping Tool.
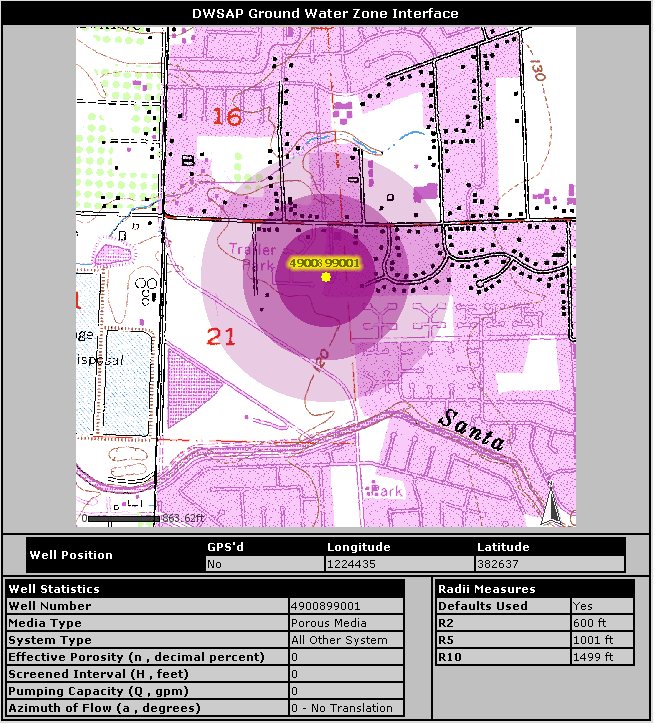
For the complete users guide to the Mapping Tool, see http://swap.ice.ucdavis.edu/instructions/mapping.html.
The challenges presented in actually performing all the assessments for California cannot be understated. Too many variables exist to adequately give it justice. At the center of these challenges is adequate funding, time and staff necessary to provide a consistent and useful assessment.
To meet these challenges, ICE has implemented another thick client application, called TurboSWAP, to manage source information, walk users through the assessment process, format minimum required reporting elements, communicate with a master server to post finished assessments, and obtain updated source information. TurboSWAP contains six major processes. First users are required to enter information necessary for protection zone delineation. Second users are required to enter information about source Physical Barrier Effectiveness. Third users are required to enter information about Possible Contaminating Activities (PCA’s). Fourth the ability to take the data entered in the first three steps and produce the vulnerability ranking for the source. Fifth the ability to generate the completed assessment report in a standard format. Finally users can create custom reports, and communicate with a master server to post and retrieve assessment information.
ICE used Microsoft Visual FoxProâ to develop a thick client application to manage the assessment information. Each application contains a custom data set of each local district or agency’s source jurisdiction. The application is designed with a wizard look and feel to walk users through the assessment process.
Image 3. TurboSWAP control screen.
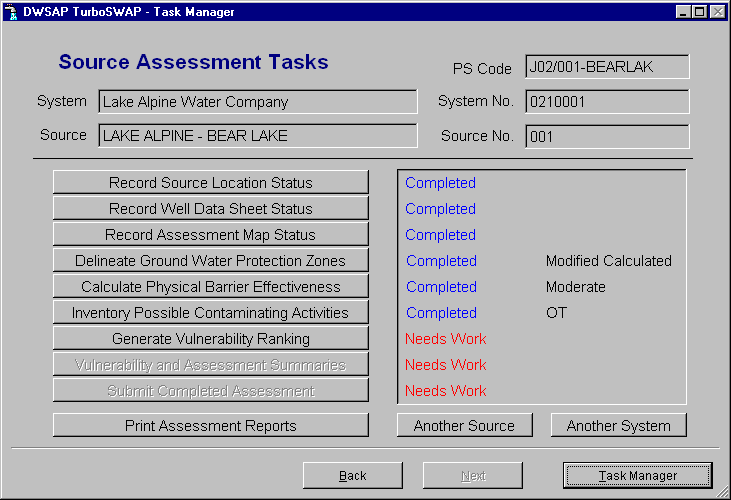
For the complete users guide to TurboSWAP, see http://swap.ice.ucdavis.edu/instructions/turbo-main.html.
Early in the program ICE helped facilitate and convene a Data Advisory Committee (DAC) to guide the assessment process. The challenges faced in guiding the process to develop California’s safe drinking water program included political and policy sensitivities, data ownership issues, and strong opinions on the best alternative for assessing vulnerability in the state. The process took two years to funnel the guiding principles outlined above, but has proven to be the best method. Collaborative framework for decisions, distributed database technology, and thin and thick client tools all were a result of long and arduous discussions. The DAC continues to guide the process. The DAC is made up of representatives from state and federal agencies that have jurisdictional authority over water resources management in the state. The DAC meets quarterly and each representative gives a presentation regarding application or data development, which can be shared to guide the Source Water Assessment Program. The DAC has and continues to be invaluable in completing the assessments for California.
The GPS Data Management System has been delivered to 21 Department of Health Services District Offices, 34 Local Primacy Agency offices and over 60 people have been trained in use of the software and Trimble GPS since August 2000.
Table 1. Source locations mapped using the GPS Data Management System as of June 18, 2001.
|
Type of Source |
Number GPS’d using the DMS |
|
Ground water (GW) |
2899 |
|
Purchased ground water |
3 |
|
Surface water (SW) |
68 |
|
Purchased surface water |
5 |
|
Ground water under direct influence of surface water |
11 |
|
Wellhead |
2 |
|
Other plant or facility |
1 |
|
Treatment plant |
24 |
|
EP surface water, permanent |
6 |
|
EP ground water, permanent |
45 |
|
EP ground water, non-permanent |
1 |
|
New Sources |
263 |
|
Total |
3328 |
TurboSWAP has been delivered to 21 DHS district offices, 34 Local Primacy Agency offices, and 42 special requests from private water vendors. Over 60 people have been trained in the software. The application has been in place since January 2001.
As of June 18, 2001, there have been 528 completed Source Water Assessments submitted using TurboSWAP since January 15, 2001. Average time for a complete assessment has been under 3 hours.
Table 2. Preliminary assessment results – Physical Barrier Effectiveness
|
Physical Barrier Effectiveness |
Number of Completed Assessments |
|
High |
13 |
|
Moderate |
334 |
|
Low |
179 |
|
Total |
526 |
Table 3. Preliminary assessment results – Protection Zone Distances (out of possible 528 assessments).
|
Protection Zone Radii |
Average Distance in Feet |
|
Zone A – 2 years |
1036 |
|
Zone B5 – 5 years |
1663 |
|
Zone B10 - years |
2395 |
Table 4. Preliminary assessment results – Most common PCA’s detected by Protection Zone (out of possible 528 assessments).
|
Zone |
Possible Contaminating Activity |
Number of assessments where source is vulnerable to activity |
|
Zone A |
Transportation corridors - Roads/ Streets |
446 |
| Wells – Water supply |
305 |
|
| Septic systems – low density (<1/acre) |
256 |
|
|
Zone B5 |
Transportation corridors - Roads/ Streets |
439 |
| Wells - Water supply |
247 |
|
| Septic systems - low density (<1/acre) |
231
|
|
|
Zone B10
|
Transportation corridors - Roads/ Streets |
428 |
| Septic systems - low density (<1/acre) |
251
|
|
|
Wells - Water supply |
244 |
|
|
Total |
528 |
For complete list of High-risk possible contaminating activity list in Zone A see Appendix A.
Discussion
The tools developed for the Drinking Source Water Assessment program have been an enormous success. Faced with signification technological, political, and logistical challenges, these tools will provide a mechanism for a reasonable vulnerability assessment of California’s public drinking water resource. Within less than 9 months of distribution, significant information on source location, protection delineation, and vulnerability ranking has been assembled.
Having a distributed data framework, master data server, and consistent thick client communication will provide significant improvements to the day-to-day operation of DHS and the safety of California’s drinking water. This data model allows for local expertise to funnel directly into DHS master data thus positively affecting policy decisions. Local information incorporated at the statewide level will undoubtedly be a positive addition to drinking water protection in California.
It is likely that a set of several possible contaminating activities will serve as the bulk of the reasons for vulnerability. Only through this system of thick and thin clients at the local level, and statewide assemblage of assessment information, will such a list be developed. With such a list a more refined approach to protecting California’s drinking water resources can be achieved.
The data assembled through this process will prove to be invaluable. Future projects using this data could research the following questions;
The tools developed by the Information Center for the Environment will have several effects. First source location, vulnerability assessments, and protection zones for all public drinking water sources will be developed in spite of the challenges facing the project. Data quality will reach new levels due to the stringent quality assurance and data flow mechanisms established. Vulnerability assessments will be provided based on local expert knowledge assembled in a systematic statewide framework and will positively affect policy for future public drinking water protection. Moreover, additional research into water quality for California is now possible due to the improved system.
All authors can be contacted at:
Information Center for the Environment
Department of Environmental Science and Policy
University of California Davis
1 Shields Ave
Davis CA, 95616
Michael Byrne msbyrne@ucdavis.edu
Rob Coman rmcoman@ucdavis.edu
Sky Harrison sky@ice.ucdavis.edu
Eric Lehmer eric@ice.ucdavis.edu
Jim Quinn jfquinn@ucdavis.edu
California Department of Conservation. Abandoned Mine Report. Database. Sacramento California: California Department of Conservation, 2001.
California Department of Finance. Sacramento California: State of California, 2000.
California Department of Health Services. “Drinking Water Source Assessment and Protection (DWSAP) Program.” Sacramento, California: California: California Department of Health Services, January 1999.
California Department of Health Services. "PICME." Database. Sacramento, California: California Department of Health Services, 2001.
Dooher, Brendan P, and Anne M Happel. Sacramento CA: University of California, Lawrence Livermore National Laboratory, 1999. UCRL-AR-134611.
Golding, Susan, Commission Chair. Sacramento CA: State of California, 2000.
Mount, Jeffrey F. California Rivers and Streams. Berkeley, California: University of California Press, 1995.
United States Department of Agriculture. 1997 Census Agriculture Highlights - California. 1997. Web Page. URL: http://www.nass.usda.gov/census/cencus97/highlights/ca.htm. 2001.
United States Environmental Protection Agency. Washington DC, 1997. EPA-816-R-97-009.
High Risk PCAs Reported in Zone A
|
Possible Contaminating Activity |
Number of Assessments Reported |
|
Septic systems - low density (<1/acre) (H in Zone A, otherwise L) |
256 |
|
Sewer collection systems (H, if in Zone A, otherwise L) |
181 |
|
Septic systems - high density (>1/acre) (VH if in Zone A, otherwise M) |
112 |
|
Wells - Agricultural/ Irrigation (H) |
89 |
|
Automobile- Gas stations (VH) |
75 |
|
Automobile- Repair shops (H) |
64 |
|
Agricultural Drainage (H in Zone A, otherwise M) |
53 |
|
Machine shops (H) |
45 |
|
Utility stations - maintenance areas (H) |
40 |
|
Grazing (> 5 large animals or equivalent per acre) (H in Zone A, otherwise M) |
38 |
|
Pesticide/fertilizer/ petroleum storage & transfer areas (H) |
38 |
|
Chemical/petroleum pipelines (H) |
37 |
|
Historic gas stations (VH) |
35 |
|
Recreational area - surface water source (H) |
27 |
|
Automobile- Body shops (H) |
26 |
|
Known Contaminant Plumes (VH) |
25 |
|
Military installations (VH) |
23 |
|
Chemical/petroleum processing/storage (VH) |
21 |
|
Illegal activities/ unauthorized dumping (H) |
21 |
|
Other Animal operations (H in Zone A, otherwise M) |
21 |
|
Fleet/truck/bus terminals (H) |
19 |
|
Underground storage tanks - Confirmed leaking tanks (VH) |
18 |
|
NPDES/WDR permitted discharges (H) |
17 |
|
Historic waste dumps/ landfills (VH) |
16 |
|
Injection wells/ dry wells/ sumps (VH) |
16 |
|
Dry cleaners (VH) |
14 |
|
Photo processing/printing (H) |
14 |
|
Junk/scrap/salvage yards (H) 1 |
13 |
|
Wastewater treatment plants (VH in Zone A, otherwise H) |
13 |
|
Home manufacturing (H) |
12 |
|
Lagoons / liquid wastes (H) |
12 |
|
Mining - Sand/Gravel (H) |
12 |
|
Railroad yards/ maintenance/ fueling areas (H) |
12 |
|
Furniture repair/ manufacturing (H) |
11 |
|
Farm machinery repair (H) |
10 |
|
Farm chemical distributor/ application service (H) |
8 |
|
Airports - Maintenance/ fueling areas (VH) |
6 |
|
Wood/pulp/paper processing and mills (H) |
6 |
|
Metal plating/ finishing/fabricating (VH) |
5 |
|
Mining operations - Historic (VH) |
5 |
|
Underground storage tanks - Not yet upgraded or registered tanks (H) |
5 |
|
Animal Feeding Operations as defined in federal regulation2 (VH in Zone A, otherwise H) |
4 |
|
Mining operations - Active (VH) |
4 |
|
Salt Water Intrusion (H) |
4 |
|
Boat services/repair/ refinishing (H) |
3 |
|
Landfills/dumps (VH) |
3 |
|
Lumber processing and manufacturing (H) |
3 |
|
Research laboratories (H) |
3 |
|
Underground storage tanks - Non-regulated tanks (tanks smaller than regulatory limit) (H) |
3 |
|
Plastics/synthetics producers (VH) |
2 |
|
Concentrated Animal Feeding Operations (CAFOs) as defined in federal regulation1 (VH in Zone A, otherwise H) |
1 |
|
Wood preserving/treating (H) |
1 |