Con Edison, the New York City power company, asked Ipsos-NPD to determine the value of the contents of refrigerators & freezers that might spoil if left un-refrigerated for 12 or more hours. The information assisted the New York State Public Utilities Commission in determining what the maximum claim should be in the case of a power outage that lasts 12 hours or more.
ArcView with data from Pcensus was used to develop a refrigerator contents model based on consumer expenditures for groceries at the local zip code level. The model has passed a statistical peer review and several legal proceedings.
On July 6, 1999, the Washington Heights section of Manhattan experienced an extended power outage during a period of time that New York was experiencing a heat wave. Because only Washington Heights lost power, it was speculated that Con Edison purposely turned off the power and diverted it to more upscale neighborhoods. A thorough investigation found that transmission lines not intended to support thousands of window air conditioners had become over-loaded and that Con Edison had done nothing wrong. Nevertheless, over 40,000 claims for perishable food were paid by Con Edison, the majority being for the $100 maximum allowed by law. Furthermore, a political response by neighborhood activists resulted in the following order by the Public Utility Commission to increase the maximum claim from $100 to $350:
Re: Case 99-E-0930 – Proceeding on Motion of the Commission to Investigate the July 6, 1999 Power Outage of Con Edison's Washington Heights Network
The Commission's June 22, 2000 Order Approving Tariff Amendments in the referenced proceeding directed Consolidated Edison Company of New York, Inc. ("Con Edison" or "the Company") to file a proposal designed to address the administrative and practical difficulties involved in compensating consumers for spoilage of food and perishable merchandise resulting from a power outage as defined in the tariff.
In accordance with the Commission's May 26, 2000 Order in this proceeding, Con Edison will increase the compensation to residential users for actual losses up to $350.
Hon. Janet Deixler
Secretary
New York State
Department of Public Service
Three Empire State Plaza
Albany, New York 12223
Con Edison's claim experience would suggest that this change would cost the utility over 15 million dollars per year. However, Con Edison was certain that the Commission would change the ruling if they were provided with two pieces of evidence:
1. Most claimants ask for the maximum allowed regardless of actual losses.
2. The perishable content of an average refrigerator in New York City & Westchester County is much less than $350.
The proof of #1 was the record of actual claims which were most often for the maximum allowable $100. However, most claims may be for $100 because the perishable contents of refrigerators might exceed $100. By answering #2, both issues would be resolved.
Con Edison turned to Ipsos-NPD to answer the following questions:
- Can Ipsos-NPD determine the value of the contents of a refrigerator & freezer that might spoil if left un-refrigerated for 12 or more hours (average value of perishable refrigerator/freezer contents)?
Yes … Use zip code level consumer expenditure data to calculate the average value.
- How much does this average vary across the Con Edison service area?
Calculate how much the average value varies from house to house (e.g. based on household composition, income, type of dwelling) across the Con Edison service area.
- What range of values would include 99% of all refrigerators & freezers in the Con Edison service area?
Expand the evaluation to cover the entire Con Edison service area and apply a statistical confidence interval to the estimates.
The Con Edison research was based on three components: two provided the information required to make an informed opinion of the value of the contents of a refrigerator that might spoil if left un-refrigerated for 12 or more hours, and the third offered validation of the finding.
1. A thorough analysis of the existing claims database and estimation of the claims distribution, including tests of normality.
2. Development of a model based on Consumer Expenditures (BLS) & Weekly Consumption of specific food categories (USDA) – extended to the zip code level with specific modeling of the Washington Heights zip codes.
3. Further validation of the value of the contents of the typical Washington Heights refrigerator / freezer based on average frozen food expenditures (American Frozen Food Institute – IRI data).
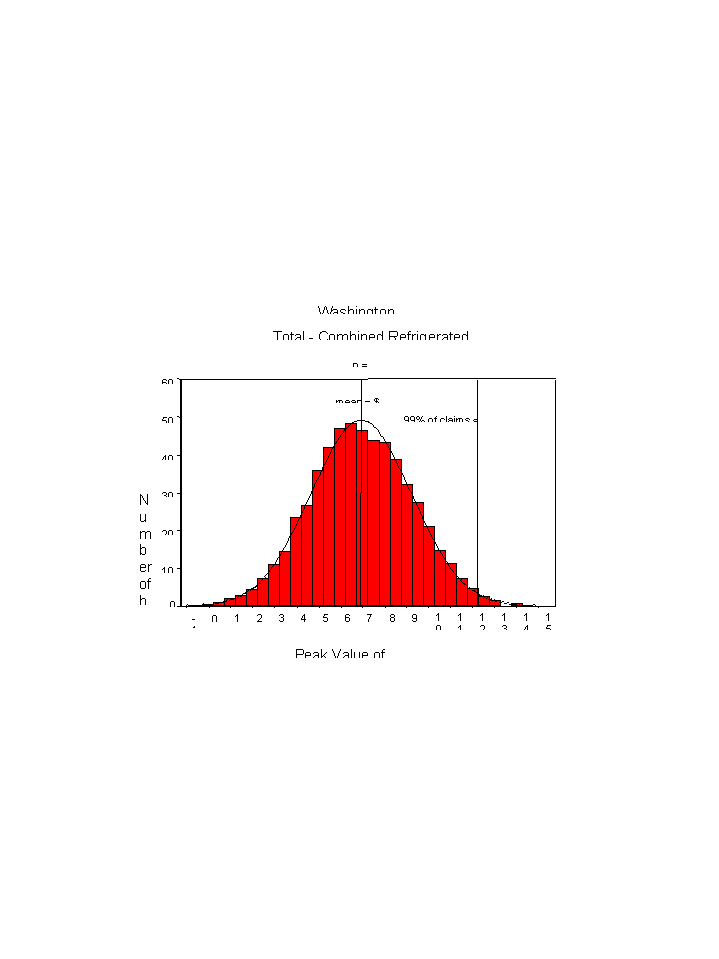
The first point is a simple statistical procedure that was completed to determine how much variance existed in the previous claim data. The variance is used to calculate a confidence interval around the mean (average perishable contents) and provide a range of values that would include 99% of all refrigerators & freezers in a given zip code.
The focus of this paper will be on the second point that uses zip code level expenditure data. To complete this research, Ipsos-NPD used data provided by Tetrad who licenses both AGS & Claritas data. Tetrad explains:
The 1999 Consumer Expenditure database covers most major household expenditures in a multi-level hierarchical classification. Expenditures can be expressed either as aggregate expenditure or per household expenditure for any geographic level from the block group to national. The major categories represented are:
- Total Expenditure
- Food and Beverages
- Shelter
- Utilities
- Household Operations
- Household Furnishings/Equipment
- Apparel
- Transportation
- Health Care
- Entertainment
- Personal Care
- Reading
- Education
- Tobacco Products
- Miscellaneous Expenses
- Cash Contributions
- Personal Insurance
- GiftsMost of these categories include two or three levels of sub-category detail. For example, a typical classification for an item in the food group is:
TOTAL Total Expenditure
FB Food and Beverage
FB1 Food at Home
FB102 Dairy Products
FB10201 CheeseThis structure permits ready analysis of expenditures at any level of detail and between levels of detail. It is possible to analyze any individual category within the context of its parent category (e.g., cheese expenditures as a share of total dairy product expenditures or total food at home expenditures.)
How the data was used will be explained in detail in the following section. In general, the amount spent at the zip code level for each category of food (e.g., FB10201 Cheese) was summarized as follows:
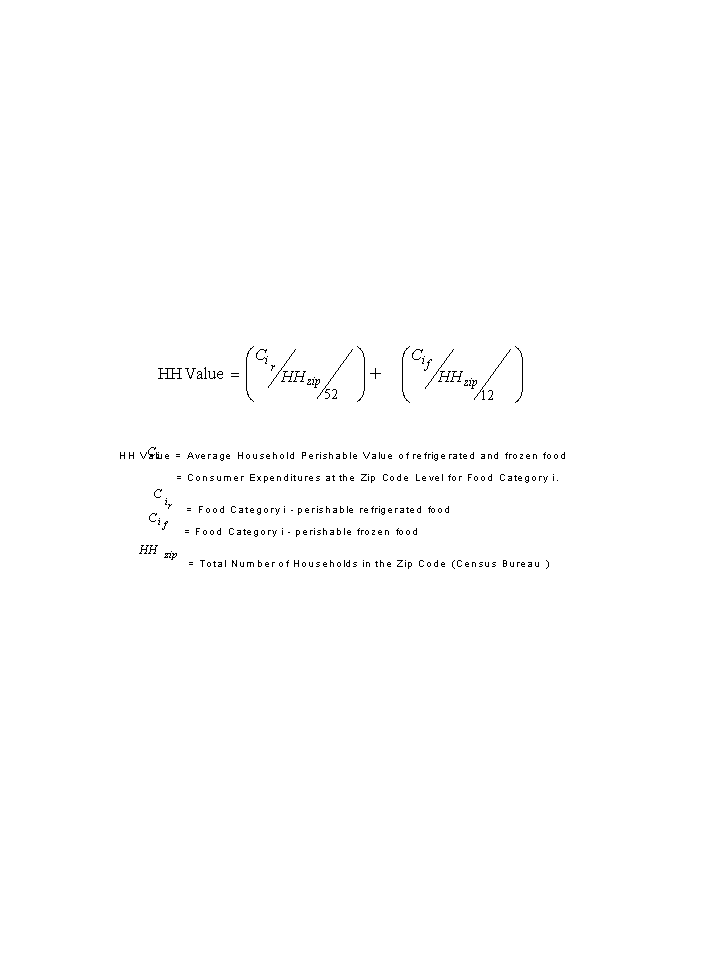
To further confirm the consumer expenditures and as a logic check, the expenditures were cross verified using USDA per capita consumption data from the U.S. Department of Agriculture, Agricultural Research Service 1997 Data tables: Results from USDA's 1994-96 Continuing Survey of Food Intakes by Individuals and 1994-96 Diet and Health Knowledge Survey.
A concern is that the greatest value of perishable food is in frozen food, both because of the expense of the food and because it is easily ruined (e.g., ice cream melts). If the freezer contents of the freezers in the Washington Heights zip codes are comparable to national freezer contents and if consumption patterns are similar, the zip code level data should match the data provided by the American Frozen Food Institute (IRI data).
The Department of Energy reported in The 1997 Residential Energy Consumption Survey (RECS) that, "The 19 years covered by the RECS have seen continuous and large increases in appliance use in U.S. households … The percentage of households using a stand-alone freezer has remained essentially unchanged over the past two decades." Ownership of freezers in the Mid-Atlantic Census Region, 27.2% of households, was not much lower than the national average of 33%. A possible explanation is that the Mid-Atlantic includes New York State with only 21% ownership. The low New York State average is no doubt caused by the number of households living in multi-family housing units of more than 5 units. The percentage of households that own freezers in 5 or more unit buildings, according to the RECS, is too small a number to provide reliable data. Because Washington Heights is predominately 5 or more unit buildings, it is fair to conclude that very few households in Washington Heights own a freezer.
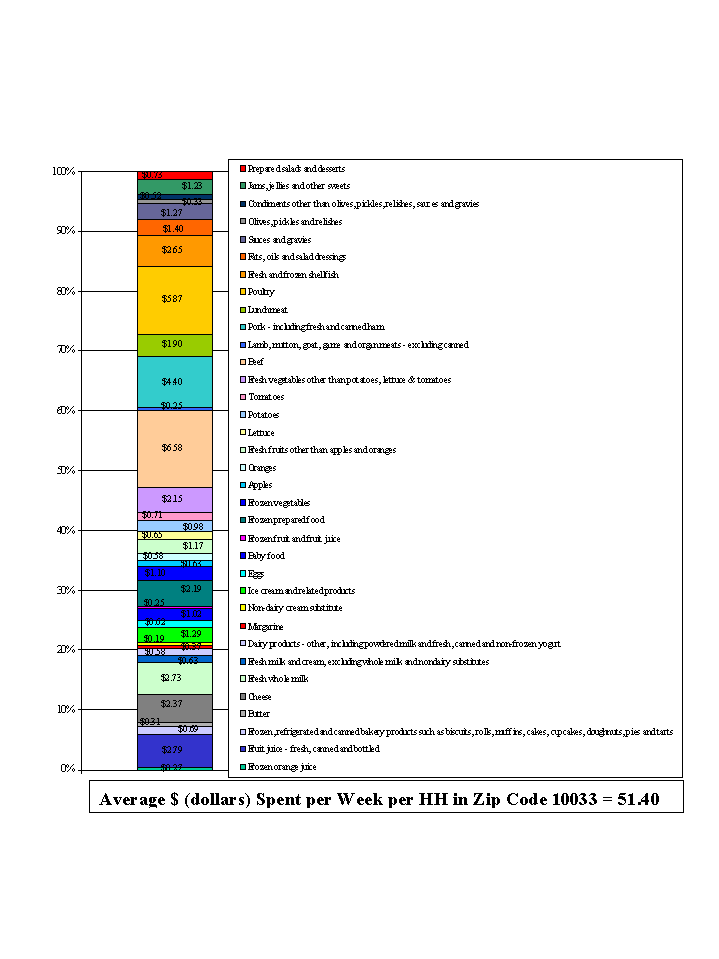
For example, summing the amount spent for each different category of food would indicate that the average (conservative estimate) amount in a refrigerator in zip code 10033 (Washington Heights) would be $ 51.40.
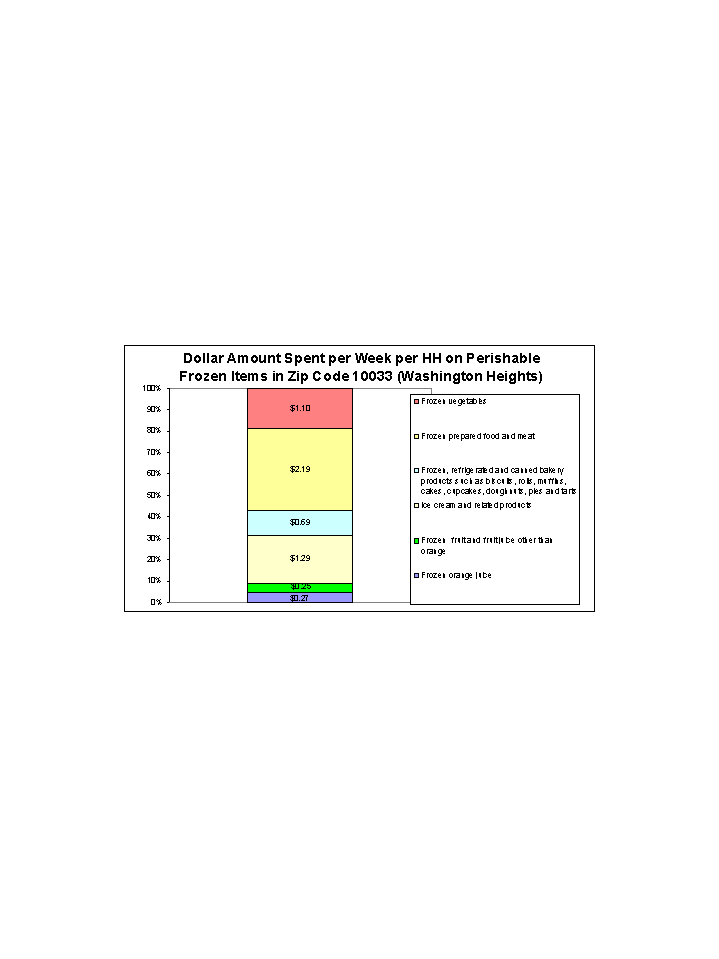
When the amount of frozen food was added to the refrigerator sum the total is $ 69.40.
When confidence intervals are applied to the $ 69.40 mean, it can be said that 99% of households in Washington Heights have less than $ 122.00 worth of perishable food in their refrigerators & freezers.
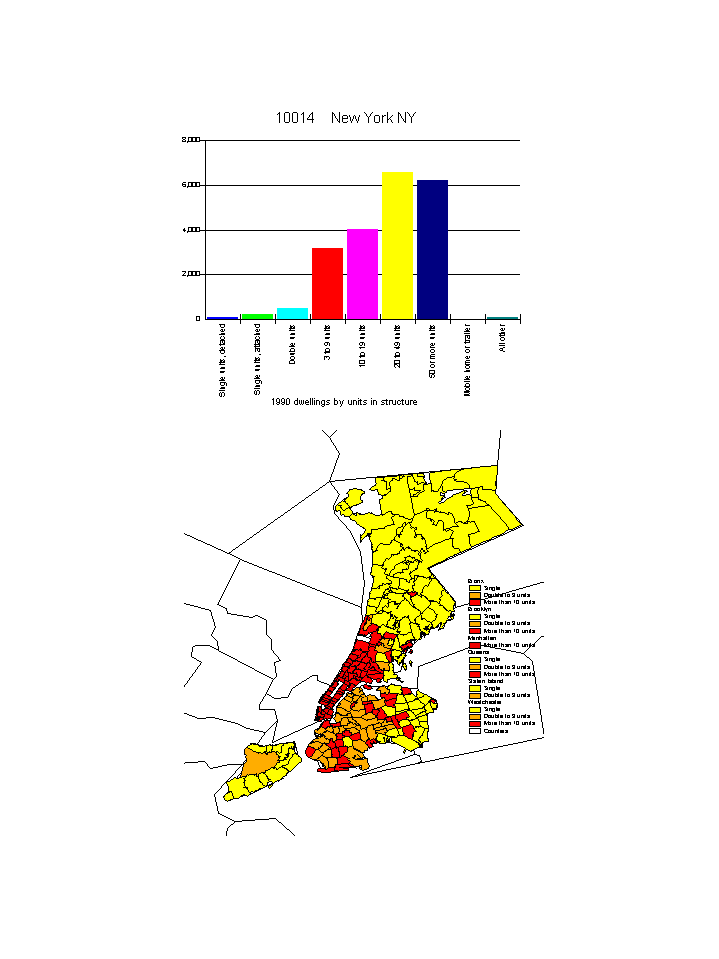
With this finding suggesting that $350 is an unrealistic claim limit, Con Edison asked Ipsos-NPD to review the entire Con Edison service area. It is unnecessary to model every zip code in the Con Edison service area if it is determined that various zip codes have the same value of perishable refrigerator/freezer contents. Based on other research, it was determined that three demographic characteristics might have an influence: type of dwelling (single family - apartment building), size of household, and income. A sample of zip codes could then be selected from all of the combinations of these demographic variables.
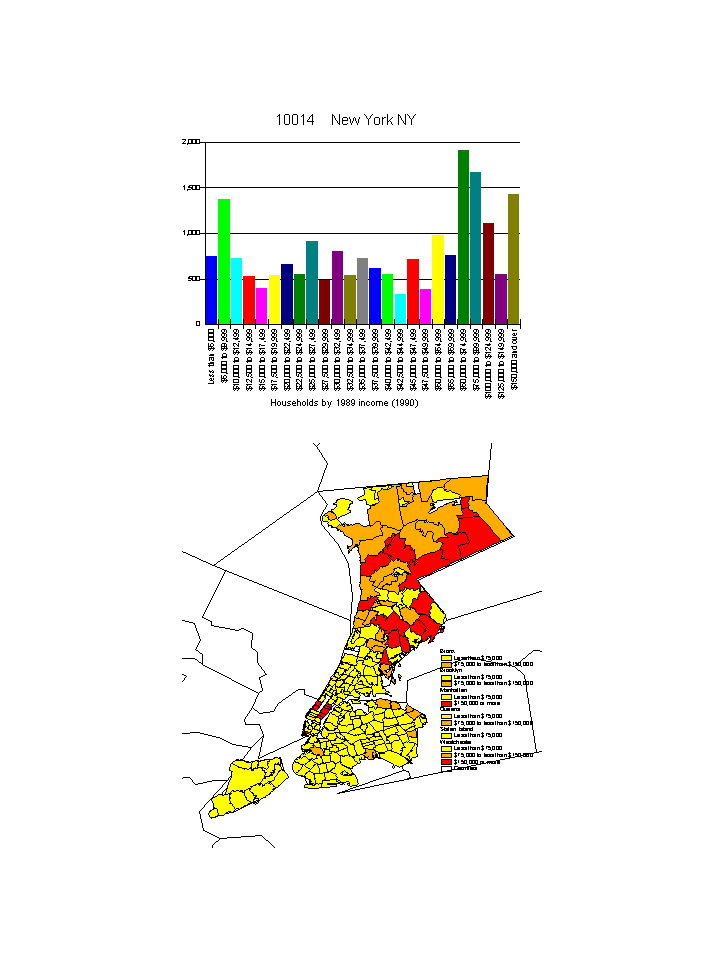
Like household type, the income distribution was expected to have an effect on the quantity of perishable food. However, it turns out that a household income is not a predictor of the value of perishable food a family has in their refrigerator / freezer.
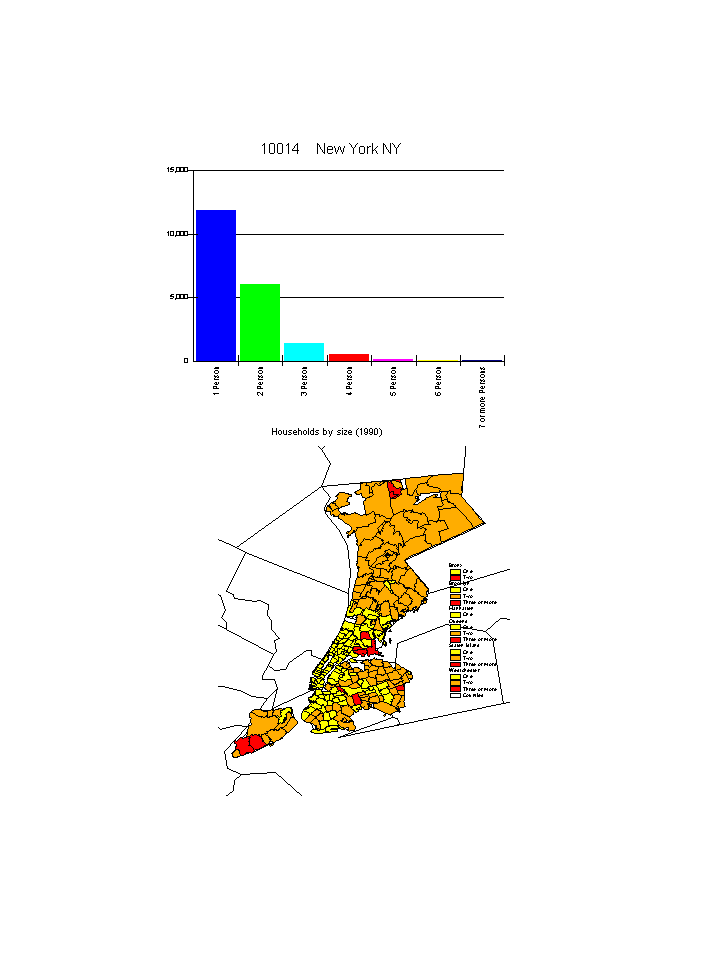
Like household type and income, the size of a family was expected to have an effect on the quantity of perishable food. This was confirmed.
The following tables show the combinations of the three demographic variables present in the Con Edison Service area. Ipsos-NPD was asked to randomly select zip codes from each category to model like the Washington Heights model previously presented:
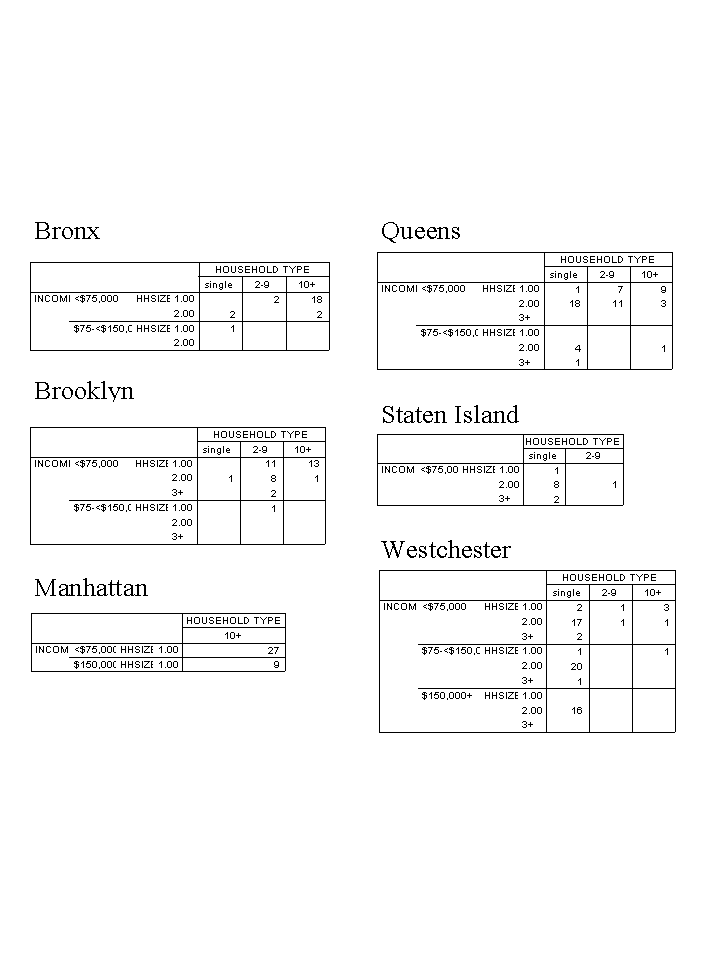
Zip codes were selected from each area and for each combination of demographic variable. It was found that type of dwelling and size of household had an effect on perishable contents but income or the area did not. The following map identifies the modeled zip codes.
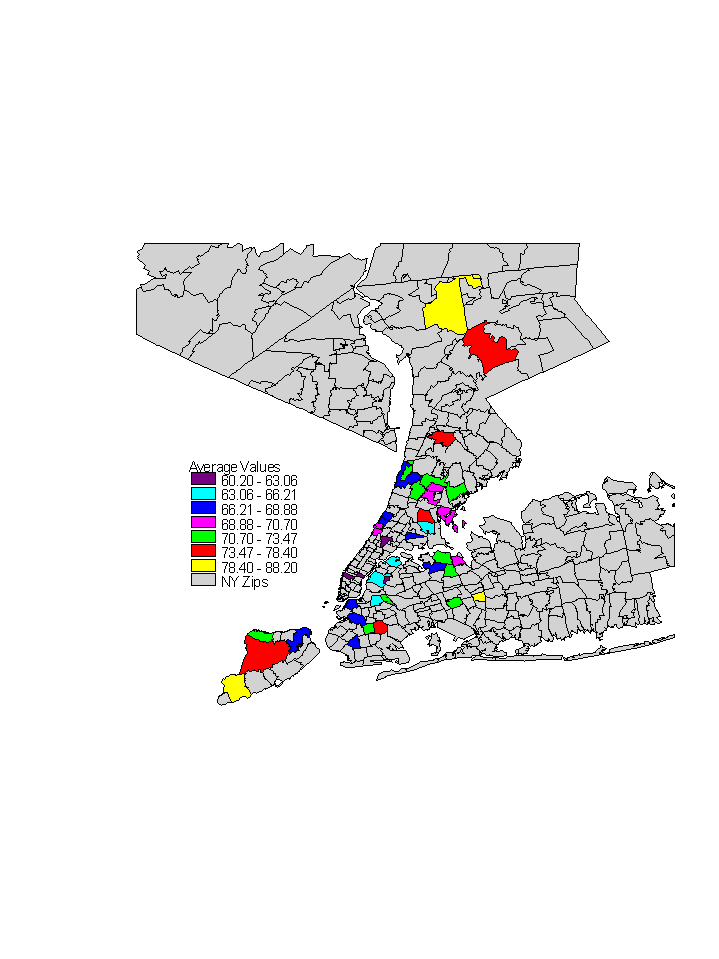
Because the variance did not change across the three areas we reviewed (Manhattan, Queens and Westchester County), Con Edison reached the conclusion that a total service area confidence interval could be calculated.
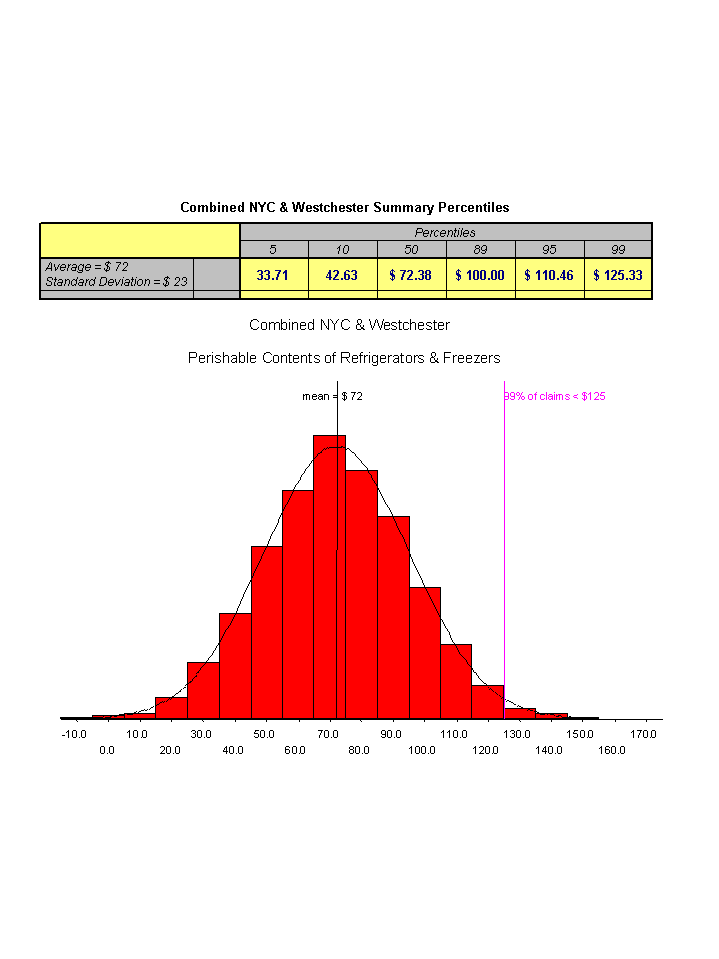
Con Edison asked Ipsos-NPD to answer three questions:
Can Ipsos-NPD determine the value of the contents of a refrigerator and freezer that might spoil if left un-refrigerated for 12 or more hours (average value of perishable refrigerator contents)?
$72.00
How much does this average vary across the Con Edison service area?
The standard deviation = $23.00
What range of values would include 99% of all refrigerators and freezers in the Con Edison service area?
99% of the refrigerators and freezers in the Con Edison service area contain more than $19.00 and less than $125.00 worth of perishable food
The Public Utilities Commission reduced the maximum allowable claim from the proposed $350 to $125.
Julie McCormick
Senior Project Director
Ipsos-NPD, Inc.
100 Charles Lindbergh Blvd.
Uniondale, NY 11553
(516) 507-3523
(516) 507-3334
julie_mccormick@ipsos-npd.com