Title:
Putting Information in its Place: Integrating GIS with Educational Technologies
Authors:
William G. Guthe, GIS and Remote Sensing Analyst, and
Kirk Alexander, Managing Director, Educational Technologies Center, Princeton University
Abstract:
ааа Princeton's Educational Technologies Center (ETC) provides consultation and development services to faculty who wish to use web-based technologies for teaching and research.а Virtually every academic discipline involves locational analysis in some way. ETC uses GIS to spatially enable existing databases, build a georeferenced framework to which new data may be added, and drive interactive displays of two- and three-dimensional surfaces.а The paper will discuss how GIS data sets interact with other object-oriented databases managed by ETC, and how ETC uses GIS with other web-based tools to provide its audiences a variety of ways to explore information.
ааааааааааа Recent technological changes have profoundly affected instruction and research at universities.а The ease with which students and faculty can communicate and access information over the Internet, the explosion of Web-based applications, and the heightened expectations of students who have grown up using this technology, all require universities to better manage information, make that information more accessible and visually appealing, and develop new ways to present and explore the information.
ааааааааааа PrincetonТs Educational Technologies Center (ETC) was formed last year to offer consultation and development services for faculty who wish to use customized instructional technologies for their teaching and/or research.а GIS has been included as an important resource for faculty in curriculum development, interactive learning and class presentations.а It also can support other ongoing ETC projects.а This paper will describe ETCТs efforts to spatially enable existing databases, to develop a georeferenced framework to which digitized data may be added, to incorporate GIS data collection in the field, and to create interactive displays of two- and three-dimensional surfaces.
Spatially enabling existing databases: The Almagest example and Walks in Rome
In any discipline, educators will identify significant features and how these features interact.аа For example, an art historian may wish to illustrate how artistic styles originate in a particular place and are transmitted to other places.а Managing these interactions can become a challenge.
ETCТsа Almagest is an Oracle networked database that describes the objects, places and people related to slides that are used in Art History and other classes as course related resources. Images and their identifying information are delivered across the Internet using standard web browsers. In spite of all the complexity, simple slide databases are supported in a simple manner. Due to its flexible structure, Almagest can be used to manage information in courses ranging from Theories of Housing and Urbanism, to the Biology of Organisms, and Renaissance Architecture.
Interlinked sets of tables support more complex uses of the database.а Currently Almagest includes a collection of database tables for describing:
аааа Constructs/Artifacts (objects, places, buildings etc.)
аааа Agents (people, organizations)
аааа Locations (places, countries)
аааа Images(multimedia) and Directories holding them
аааа Documents (untyped, can be external to database)
аааа Small Documents (typed, 2000 char or less)
аааа Attributes for any of the above -- materials, styles, etc.
аааа Maps
аааа Glossary
аааа Bibliography
аааа Courses
At present, locations are generally defined as a text string identifying the city or region in which an object is found.а Maps are stored as images without georeferencing. GIS plays its primary role in Almagest by fitting map images to a coordinate system, and by specifying an objectТs location in projected coordinates.
GIS has immediate utility to Almagest in managing historic maps.а Such maps are an invaluable source of information on urban growth, architecture, and changing perspectives of a city.а By georeferencing the maps to a common projection system, specific areas can be compared over time.а Maps of Rome from the 1600s, 1700s, and 1800s were georeferenced using a scanned map from the Atlas of Romeа (Novelli, 1992) as a base.а ERDAS Imagine 8.4 Image Geometric Correction software was used to register the Atlas of Rome image, and then to reference the historic maps to this image.
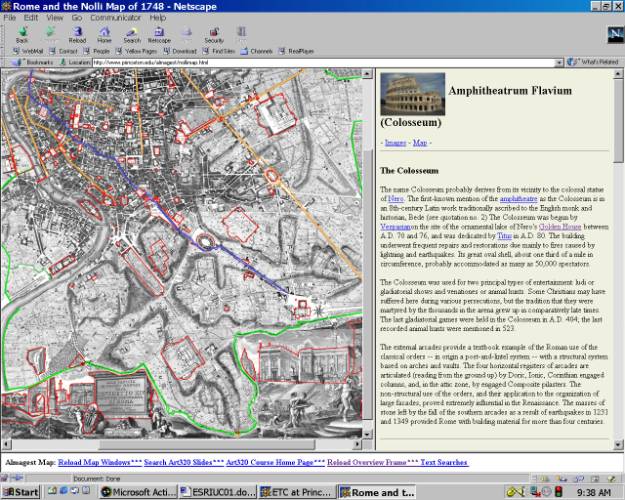
Once the maps are georeferenced, features displayed on the maps can be assigned projected coordinates.а These projected coordinates can enhance sophisticated applications.а For example, when the user opens ETCТs current Walks in Rome application, an image of the 1748 Nolli map of Rome is displayed.а Monuments, roads and other features are outlined, and by clicking on a feature the user can access the Almagest database to explore images, documents, agents (persons or organizations related to the feature) or other information.аа Figure 1 illustrates the results of choosing the Colosseum for display.а Because the location of features is defined locally, rather than in a projected coordinate system, there is little ability to find features identified on other maps using a different local system.а By storing the coordinates in a projected system, ETC can manage these features spatially and display them quickly using on-the-fly projection in ArcMap.а To the end user, the Walks in Rome application may function as it always has; but more versatility has been built into the application.
The ArcInfo 8.1 GENERATE command was used to convert the outlined features described within the HTML file itself to polygons with local coordinates.а TRANSFORM was then used to place the polygons in the same georeferenced locations as the underlying Nolli map image. аIdentifiers were added to the coverageТs INFO table to serve as keys for linking to other Oracle tables in Almagest.а Figure 2 displays the georeferenced Nolli map and the generated ArcInfo coverage.а This coverage will be converted into an ArcSDE Oracle file to take advantage of the spatial and relational database queries available when all data are stored in the same relational data base management system (RDBMS).а
ETC staff will investigate how the ArcSDE format provides new functions to the Walks in Rome application.а Proximity analysis, networks and other ArcSDE spatial functions may be incorporated within the Walks in Rome application.
Developing a georeferenced framework to store newly digitized features
Faculty often uses maps and drawings to show specific buildings, landscapes and sites.а Usually these pictures are available only on paper or as slides; ETC staff scans these documents and then generates lines using Adobe Illustrator, Flash or other products.а For example, ETC staff has generated detailed drawings of historic gardens at Stowe in England.а
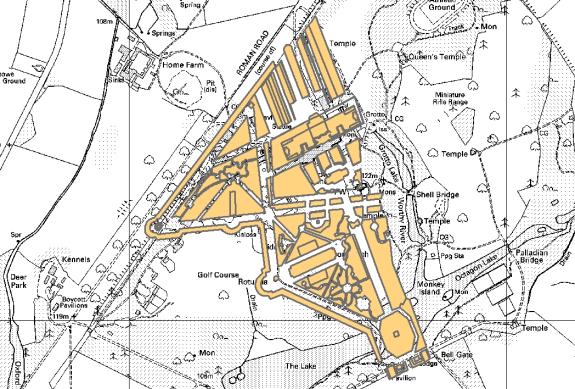
These drawings are specific to the application for which they were built, and are not georeferenced.а Another professor wishing to extract the garden configuration would not find them by their locations.а By georeferencing and storing the line drawing within a GIS, this work becomes immediately available in its correct spatial context.а Almagest and similar databases then become spatial catalogs of available drawings.а Figure 3 is an example of a drawing of Stowe garden generated in Flash, and georeferenced to the Ordnance Survey 1:10,000 raster image.
ETC staff currently exports the line drawings as DXF files directly from Flash.а The DXF files then can be georeferenced using world files in ArcView, or using the TRANSFORM and ADJUST commands in ArcInfo.а Conversely, GIS data are imported into the graphic designs made by ETC staff.а We are exploring using MAPublisher to serve as a bridge between GIS and graphics software packages.
As drawings become spatially enabled and archived within an RDBMS, ETC staff will need to document the sources of the original data and the steps taken to georeference the drawings.а Federal Geographic Data Committee metadata standards may be appropriate for some of this documentation, but there likely will be other issues beyond FGDC standards which will need to be documented.
In some cases, professors have requested support in incorporating GIS exercises into their classes.а Princeton University Library staff has introduced GIS to new users for some time; training in GIS analysis techniques is being developed.
On-site GIS data collection using Global Positioning System (GPS) receivers and handheld personal computers is a new skill to be incorporated in conservation biology classes and elsewhere.а ETC staff is developing field exercises using ArcPad and handheld devices.а Students will learn how to record data in the field, compile their records into existing GIS data sets, and how to post their revised data to a shared server.
Reference:
Novelli, Italo (editor), 1992.а Atlas of Rome, Marsilio Publishers, NY, NY.