
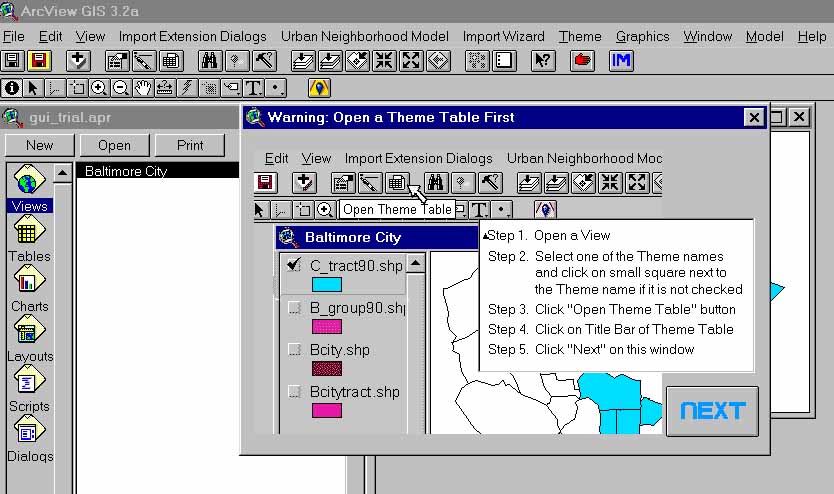
Figure 1. Opening the Urban Neighborhood Model Dialog
The graphical user interface (GUI) for an urban model is developed to allow users to run a neural network model on historical census data for Baltimore, Maryland, from 1970-1990. Users can select and prioritize the data categories (fields) to be used in the model. An artificial neural network will use the extracted data to make projections, which will be exported to the user in the form of tables and maps. Avenue scripts perform the core functions of the GUI--user query, data export (to the model), data import (from the model), and data display
The GIS Lab at Morgan State University, Civil Engineering Department received a grant from the National Transportation Center to conduct research on building a computer-based Urban Model application that has the capabilities of making socio-economic projections for geographical regions based on Census tract data from 1970, '80, and '90. To make this task possible, it was first necessary to build a database for use in ArcViewTM containing all of the Census information from these different years. As information from successive years was added to the database, it became unmanageably large and daunting to a user who has not watched it grow from its inception. To make a computer application that will be sufficiently user-friendly to a new user, it is necessary to truncate the data set appreciably. However, it is desirable to allow all of the data to exist so that the user has some degree of flexibility as to which geographic region they wish to perform analysis on and what data they choose to use for their analysis.
The underlying programming language of ArcView allows one to write scripts to automate this data extraction process and to present these procedures to a user via a customized graphical user interface (GUI). The sequence of procedures becomes an application that can run via the basic ArcView platform.
A select region of Baltimore City called Hampden/Remington was chosen initially as a test bed for the analysis. This neighborhood alone has a database several hundred fields long and consists of roughly 24 census tracts. When an end user runs an analysis and builds a model it is preferable to only use a limited geographic area and an equally limited number of fields of information as provided in the Census tract information. To facilitate this, a series of scripts were written that would allow the user to select an intersection of fields and rows of information thereby truncating the dataset to a manageable size. ArcView Geographic Information Systems (GIS) software produced by Environmental Systems Research Institute (Esri) is the software that is used for the model generation. ArcView is the industry standard in GIS software and is designed with a great amount of flexibility in so much as that the software allows users to modify and extend its original functionality by means of the object oriented programming language Avenued. Avenue allows users to view and modify the system scripts that control the functions of the graphical user interfaces, thus being able to customize them and create new dialogs specifically designed for the unique needs of the user. Several such system scripts were implemented in the process of completing this project.
When a user is ready to perform an analysis, they first must go to the menu bar at the top of the main window and select Urban Neighborhood Model (UNM) and then Open from the drop down list of options as shown in Figure 1.
At this point the UNM Dialog opens and the user is instructed to make a table the active document before proceeding. The standard ArcView GUI changes in accordance with the type of active document. With a typical project, document types will include views, tables, charts, and layouts. Thus, the menu and sub-menu items for a table are quite different from those for a view. A VIEW document contains the visual representation of the geographic area included in the SHAPEFILE. Views may contain several themes, each of which has an accompanying database of information that is displayed in a TABLE. The table of desired information can be opened by clicking once on the THEME tab in the table of contents in the left portion of the view window and then selecting the Open Theme Table icon from the menu bar at the top of the main window.
The primary function of the IMPORT wizard is to facilitate the extraction of relevant (to the user for the current application) data from the full database. The user chooses a limited area of interest by specifying records (census tracts) and a limited scope by specifying relevant data fields (columns) and the wizard extracts only the data that is at the intersection of these rows and columns.
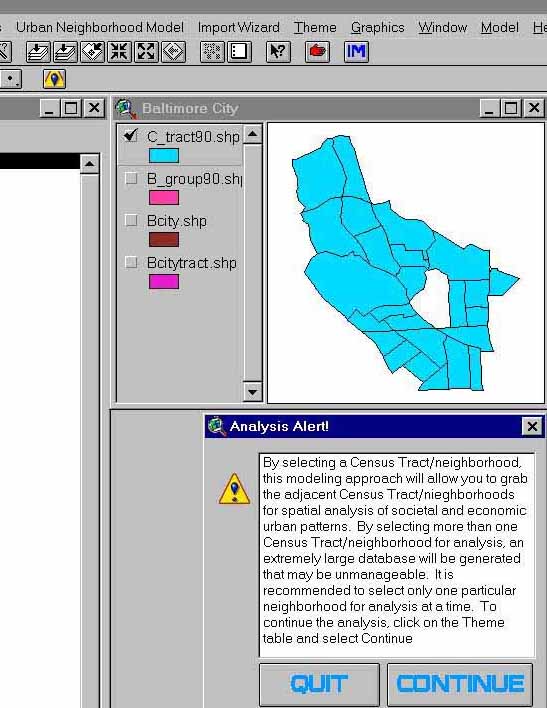
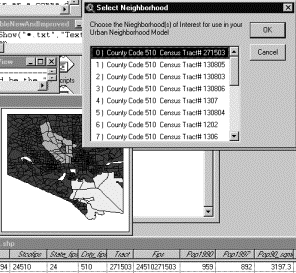
After the table containing the data that will be used for the analysis is activated by clicking anywhere on it, the NEXT button is pressed on the UNM Dialog window. The first option presented to the user is to select a geographical area of interest to be used for the analysis. One or more areas of interest may be selected. Since surrounding areas influence the socio-economic outcome of any region, a buffer is placed around the regions chosen in the dialog box. Each region listed in the dialog box represents one polygon, which corresponds to a Census tract. This first step allows the enormous data set associated with all of Baltimore City to be truncated to contain data relevant to the current study only.
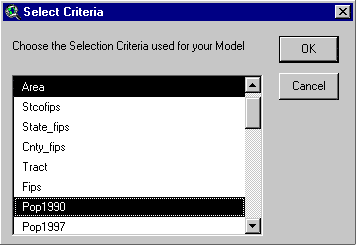
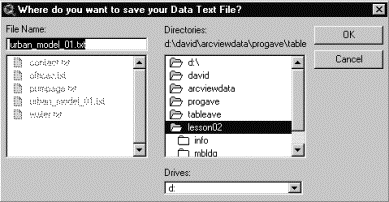
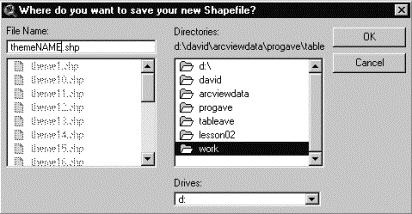
As previously noted, hundreds of fields of data are provided for the user to select from. Based on the type of analysis to be done, certain data fields may be more pertinent than others, and some may be deemed to be completely trivial to the outcome of the analysis. Selecting only relevant fields of attribute data make the analysis data-set more manageable by orders of magnitude. For example, the analysis of a neigborhood may involve only about 10-12 census tracts whereas the database for the entire city of Baltimore contains 203 census tracts. After the data set has been truncated, the user is prompted to save their new data set as a TEXT FILE that will be used externally for the analysis. Actually, behind the scenes ArcView is exporting the tabular data (from the new table containing only the truncated data) as a text file since ASCII TEXT files are very portable between different computer programs and platforms. Not only is it the intent to allow the user to perform a numerical analysis, but also a graphical representation of the results is helpful as well in quickly seeing the trends that develop. For this reason, a new shapefile is created containing only the regions of interest and their neighboring polygons that were selected in the buffering process explained earlier. Once again, the user is allowed to name and save the shapefile according to their wishes.
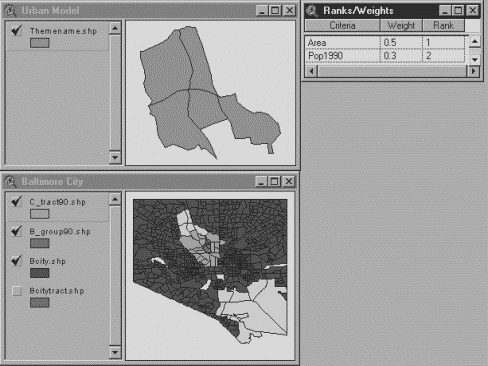
After the new files have been named, the only thing that is left is to assign relative weights to the fields that were selected. In the version of the model being used currently, these relative weights are assigned by the user to indicate priorities. These weights or ranks are sent to the Neural Network Module to be incorporated into the network architecture. A new table is generated containing the ranks/weights accompanying each field. For each field chosen in the final data set, the user may enter ranks/weights that will be used by the computer program that will do the numerical analysis.
After ranks/weights are entered for each of the fields, the front-end portion of the UNM is complete and all of the new documents that have been created during the aforementioned processes. The new shapefile consists of the region extracted from the original shapefile (Baltimore City) and can be seen in Figure 8. The new table containing the user-selected ranks appears and may be edited if necessary. The data set for the new shapefile has been exported in text format for numerical analysis.
At this time an external application (an .exe file implementing the Neural Network algorithm in MATLAB's programming language) is used to make the projections based on the trend data and the results will be imported into ArcView as a table and joined to the existing table for the UNM and results may be graphically viewed.
The current project serves as the premier project for the newly established Center for Spatial Research at the School of Engineering at Morgan State University. During this first year, a project with local flavor was chosen. By working through the various parts of this project, the hardware network and the software platform were set up, data was collected and various ideas related to modeling were introduced and analyzed.
From this point forward, the research team is well-equipped to apply these methodologies to other research areas. A second generation model will simulate behavior of a neighborhood (which is simply a cluster of census tracts) by automatically detecting primary and secondary neighbor tracts.