Mass Transit GIS
Milwaukee Downtown Transit Connector Study
Background
In 1999 the Wisconsin Center District completed construction of the new Midwest Express Center, downtown Milwaukee’s convention and meeting center. The District recognized the value of linking their new Wisconsin Center District facilities with hotels, restaurants, entertainment districts and other attractions within and surrounding downtown in order to enhance its marketability to conventions and visitors. The Wisconsin Center District found great partners in the City of Milwaukee, Milwaukee County, and the Metropolitan Milwaukee Association of Commerce. The partners shared a vision for making downtown Milwaukee a more vibrant, active and exciting place to live, work, shop, and play. They shared the goals of increasing the city's vitality by encouraging downtown residential development, enhancing economic development opportunities, and providing for ease of movement of downtown workers, visitors, tourists, shoppers, residents, and students in and around downtown.
To achieve these mutual goals and to provide high-quality public transit linkage of the major activity centers within and surrounding downtown Milwaukee, the Wisconsin Center District applied for and received Federal Transit Administration funding for analysis and evaluation of potential downtown transit systems that would provide the desired linkage.
Transit improvement in the study area could help realize goals and objectives. A series of goals and objectives for the Milwaukee Downtown Transit Connector Study has been established by the study Steering Committee to provide a basis for evaluating various transit options. The goals and objectives reflect the unique goals of a downtown transit connector service. Furthermore, the proposed goals and objectives are expected to emphasize important differences among transit technologies. These goals include:
Goal #1 - Improve transit mobility to and between key residential, employment, and activity centers in the study area.
Goal #2 - Enhance the downtown environment in attracting conventions, tourists, commerce, and residents.
Goal #3 - Increase transit utilization to and within the Downtown.
Goal #4 - Support and enhance Downtown economic development.
Goal #5 - Preserve and protect the environment.
Goal #6 - Develop a downtown transit connector system that is economical and efficient.
Project Description
The Milwaukee Downtown Transit Connector Study has been implemented with the objective of studying alternative transit improvements within the Milwaukee Downtown study area and preparing a Supplemental Draft Environmental Impact Statement. A study team was developed and kicked off its efforts in the Spring of 2000. HNTB Corporation leads the study team that is exploring and evaluating a variety of transit service alternatives. These alternatives begin with maintaining the status quo and move towards exploring new and innovative technology. The evaluation centers on three distinct investment levels as outlined below:
1. No Build: This alternative basically determines what the effect would be if only existing transportation elements and funded elements included in the regional transportation plan were utilized.
2. Transportation System Management: This alternative is defined as a package of low- to moderate-cost improvements designed to make more efficient use of existing transportation systems to accomplish the project goals.
3. Build Alternatives: This alternative will explore the more cost intensive transit system improvements and include a mix of technology, destination and alignment options and necessary maintenance facilities. Possible technologies that will be considered include bus on exclusive right-of-way, fixed guideway light rail, and aerial suspended transit system.
Study activities include land use and development opportunities, transit engineering and operational studies, traffic and transportation impact analysis, environmental impact studies and community outreach and involvement.
Early on in the study, GIS was considered to be used as a data collection tool, analysis and decision making tool, and display tool for the build alternative analyses. Because of the cost of developing a GIS system for the study, it was a "hard sell". However, GIS was recognized as the tool that would most effectively analyze the build alternatives and the environmental impacts.
A linkage study identified the methodology and recommendations associated with identifying key destinations in the project area and the potential build alignments and transportation systems management (TSM) options necessary to connect those destinations. The creation of the land use database is the first step in identifying the land uses that should be considered for linking by the proposed Connector system. The project team determined that the best tool for this purpose was the creation of a GIS database.
GIS Component
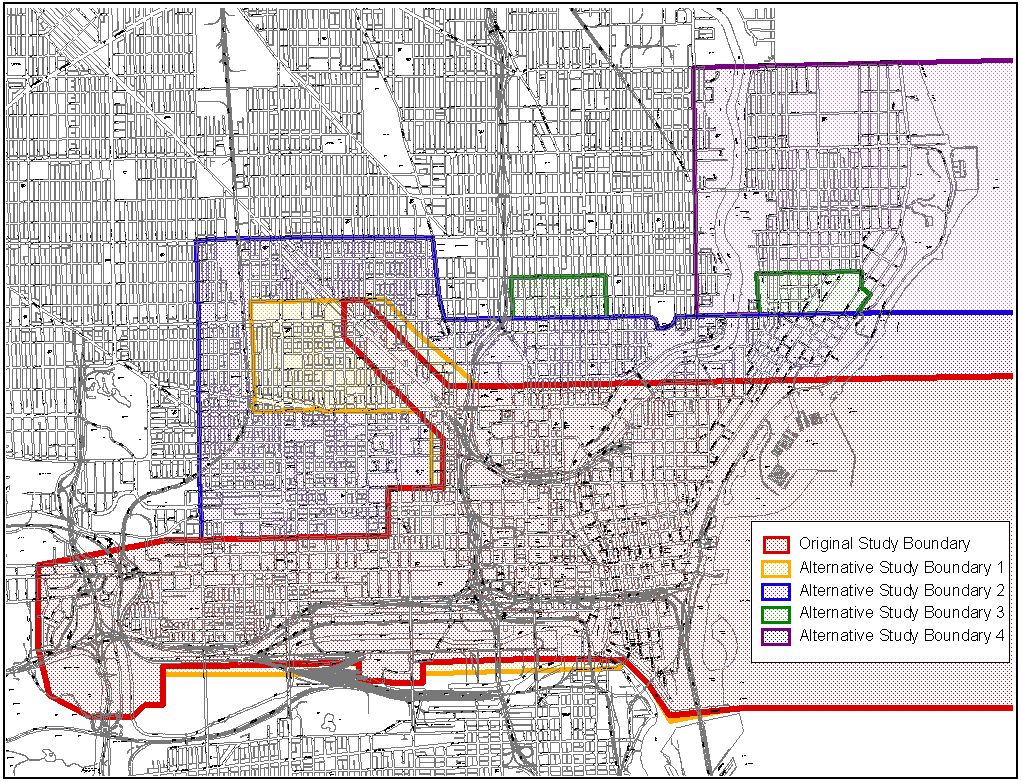
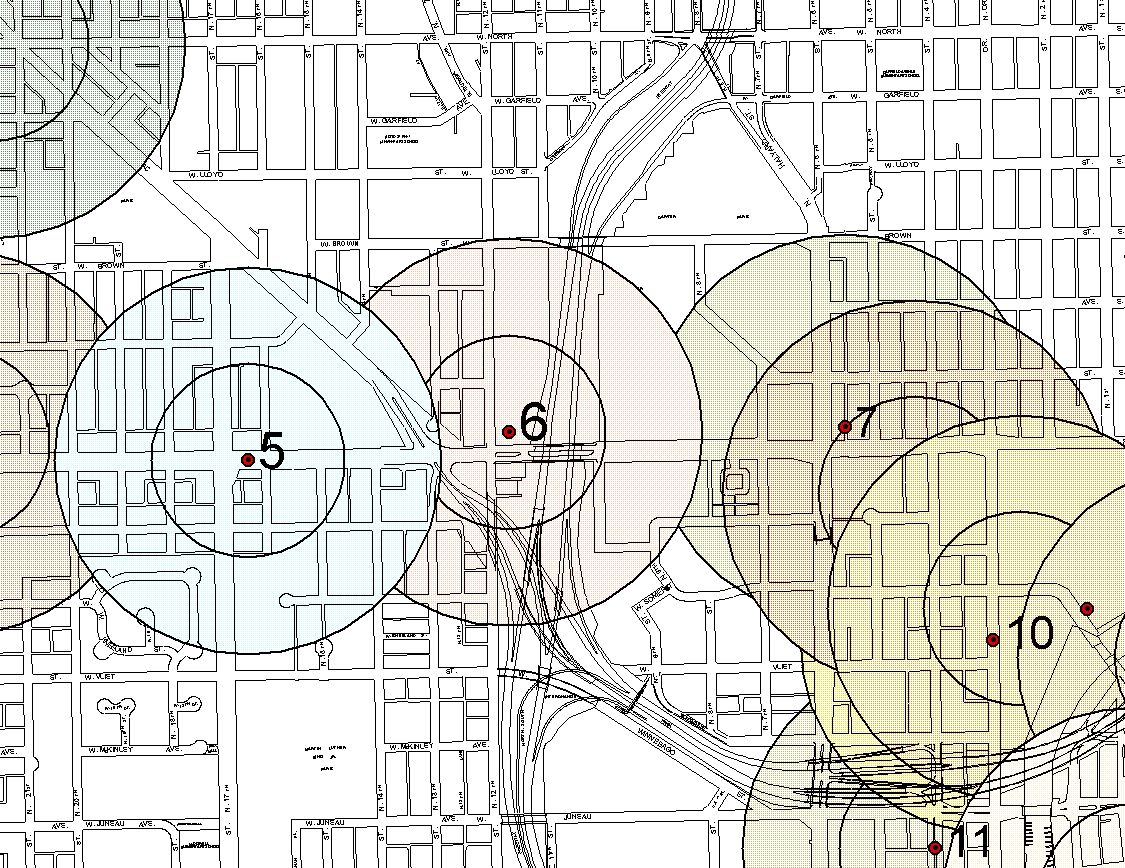
A first step in the study process was to identify the boundaries of the study area with input from the community and the project sponsors. In initial discussions with the members of the Project Steering Committee, it was determined that the study should include the downtown core. Throughout the study process, this study area continued to expand as destinations were identified. The expansion of the study area is shown in Figure 1.
Figure 1 – Expansion of Study Area Boundaries
Source: City of Milwaukee and HNTB Corporation
The initial GIS task was the preparation of a base map for the project area. The original street base was obtained from the City of Milwaukee. This mapping included street rights-of-way, building footprints, and parcel delineation from MicroStation files. The parcel mapping became the first layer for the project database by converting the MicroStation files to ArcView shape files.
The use of GIS technology was selected to provide the project with the most cost-effective as well as technologically advanced means by which to develop and analyze alternatives. A GIS system has the ability to tie specific data to map features. This allows the use of both visual information on a base map and statistical information from a database, such as data from a specific parcel or census tract. In this case, the data collected was tied to specific parcels and later aggregated to larger geographic units such as blocks, key locations, and combinations of potential routes through spatial analysis. These techniques will be described in greater detail in succeeding sections of this report.
Several layers of information were placed upon the original street and parcel base. The project team was able to obtain land use and property data from the City of Milwaukee property files for the entire project area. This data source, called MPROP, provided the team with land use, zoning, and property information from the City Assessor and Building Inspection offices. Within ArcView the MPROP database was joined with a parcel map provided by the City using the tax IDs. From the base MPROP data the team developed new and expanded upon the existing data to meet the study goals. GIS allowed the team to review information for each parcel and use that information in determining where alignments should be located and where stations or stops could be most effective in serving the downtown.
While the MPROP data was useful, it was determined that more detailed information was necessary in the core downtown area because a large number of the buildings in the downtown core are located on several parcels. The GIS team built a building data layer and developed a database to associate the detailed information for the core downtown area. The team verified data through field checks, entered the data into a database and then joined the database with the polygon of the building footprint.
The resulting database is a compilation of land use, zoning and economic data on individual properties combined with specific information on buildings in the downtown core. Information has been compiled on the number of residential units, an estimate of office employment, the number of public off-street parking spaces, number of hotel rooms, and the number of visitors expected annually to the various attractions and tourism/convention venues.
The following information was developed for the project area database. Table 1 lists the types of data collected for the downtown core area.
Table 1
DATA BASE ELEMENTS FOR DOWNTOWN CORE PROJECT AREA
|
Data Element |
Characteristics |
|
Building Number |
Each building was assigned an identifying number by the project staff. |
|
Address |
The numerical address of each parcel. |
|
Street Name |
The street the property is on. |
|
Building Name |
If applicable. |
|
Land Use |
By category as determined by the project staff. |
|
Stories |
The number of stories, or building height, for each building. |
|
Redevelopment Potential |
An assessment of whether or not the parcel or building is likely to be a candidate for redevelopment by 2020. |
|
Attraction |
Whether or not the parcel or building is a visitor attraction. |
|
Land Use |
Category determined by field verification/primary use. |
|
Square Footage |
The square footage within the building footprint. |
|
Office Employees |
An estimate of the number of employees in office buildings. |
|
Attendance |
Estimated number of attendees for attractions, if available. |
|
Capacity |
Seating capacity for entertainment and convention venues, if available. |
|
Parking |
Number of off-street parking spaces within ramps and surface lots available to public use. |
Source: HNTB Corporation
The following types of data have been collected from City of Milwaukee MPROP data files and can be used with the downtown core as well as in the surrounding neighborhoods.
Table 2
MPROP DATA BASE ELEMENTS FOR THE DOWNTOWN CORE
AND SURROUNDING NEIGHBORHOOD AREAS
|
Data Element |
Characteristics |
|
Tax Key |
The City tax key number for each parcel. |
|
Owner 1 |
The primary property owner as listed in the file. |
|
Address |
The address of the property. |
|
Zoning |
The zoning classification according the City zoning code. |
|
Land Use |
The land use code from the MPROP files using federal SIC codes. |
|
Land Use Group |
This reflects a grouping of like land uses; i.e. several classifications of commercial uses. |
|
HNTB Land Use |
The land use code given by project staff to be compatible with project definitions. |
|
Sq. feet |
The square footage of the parcel. |
|
Acres |
The acreage of the parcel. |
|
C-A-Total |
The total current assessed values for both land and improvements on the parcel. |
|
Attendance |
Estimated number of attendees for attractions, if available. |
|
Capacity |
Seating capacity for entertainment and convention venues, if available. |
Source: City of Milwaukee and HNTB Corporation
Table 3 illustrates an example of the database and the types of information included. Information can be developed for any single parcel in the project area or for any grouping of parcels. This can facilitate the analysis of each individual station site considered as well as assist in the analysis of impacts for any alignment or route considered including "what if" scenarios.
Table 3
EXAMPLE OF LAND USE DATABASE
|
ADDRESS |
ST_NM |
LAND_USE |
STORIES |
OFFICE_EMP |
TOTAL_ATTE |
PARKING |
ROOMS |
|
710 |
plankinton |
16 |
13 |
0 |
150000 |
0 |
0 |
|
750 |
plankinton |
14 |
8 |
0 |
0 |
501 |
0 |
|
761 |
plankinton |
13 |
6 |
0 |
0 |
0 |
0 |
|
161 |
wisconsin av |
5 |
7 |
0 |
0 |
0 |
0 |
|
161 |
wisconsin av |
5 |
7 |
0 |
0 |
0 |
0 |
|
310 |
wisconsin av |
7 |
14 |
3141 |
0 |
0 |
0 |
|
275 |
wisconsin av |
7 |
3 |
2744 |
0 |
0 |
0 |
|
615 |
plankinton |
14 |
6 |
0 |
0 |
600 |
0 |
|
615 |
plankinton |
14 |
6 |
0 |
0 |
1200 |
0 |
|
137 |
wells st |
7 |
3 |
60 |
0 |
0 |
0 |
|
101 |
wells st |
6 |
2 |
23 |
0 |
0 |
0 |
|
117 |
wells st |
4 |
6 |
0 |
0 |
0 |
0 |
|
1001 |
wisconsin st |
14 |
|
0 |
0 |
262 |
0 |
|
1122 |
cass st |
3 |
|
0 |
0 |
0 |
0 |
|
836 |
broadway st |
14 |
2 |
0 |
0 |
0 |
0 |
|
836 |
broadway st |
14 |
1 |
0 |
0 |
744 |
0 |
|
111 |
kilbourn ave |
6 |
28 |
3711 |
0 |
200 |
0 |
|
108 |
wells st |
16 |
2 |
0 |
185132 |
0 |
0 |
|
144 |
wells st |
16 |
2 |
0 |
0 |
0 |
0 |
|
139 |
kilbourn ave |
15 |
10 |
0 |
0 |
603 |
221 |
|
763 |
milwaukee st |
7 |
3 |
55 |
0 |
0 |
0 |
Source: HNTB Corporation
The creation of the database described above allows the study team to undertake specific reviews and analyses of individual parcels or groups of parcels within the project area. In addition, the use of this information within a GIS system allows each of these factors or combinations of factors to be mapped. This visual representation allows both the study team and the public to better understand the data and its implications under any of the study alternatives.
Figure 2 is an example of how information from the database can be used graphically to provide the study team with important information. In its review of potential redevelopment sites, a table was created showing vacant parcels and surface parking lots (often in a holding use for future development opportunities) in the downtown core area. This data did not include parcels with other existing land uses that might be redeveloped at some future time. While interesting in itself, that information becomes much more dramatic and understandable when mapped. Figure 2 depicts these potential development and redevelopment areas.
Figure 2 – Potential Development and Redevelopment Areas
Source: City of Milwaukee and HNTB Corporation
This type of graphic analysis can be prepared for a variety of factors and combinations of factors.
Preparation of Existing Land Use Base
The preparation of an accurate depiction of existing land uses in the project area was one of the most important of the early analysis tasks. As noted in the previous section, the study team was able to start with a good mapping base provided by the City of Milwaukee and then modified to fit the project area and the type of project. The MPROP data files, referred to in the previous section, were then added to the mapping file to create an initial map of land uses based upon the various classifications used by the City. Those classifications were then refined, combined and simplified to be more useful to the analyses necessary for this study. Those classifications are shown in Table 4.
Table 4
EXISTING LAND USE CLASSIFICATIONS
|
Land Use Category |
|
Single Family Residential |
|
Two Family Residential |
|
Multi-Family Residential |
|
Commercial/Residential |
|
Entertainment |
|
Commercial |
|
Commercial/Mixed |
|
Commercial/Office |
|
Office |
|
Office/Residential |
|
Hotel |
|
Industrial |
|
Public |
|
Vacant |
|
Commercial/Vacant |
|
Parking |
|
Commercial Parking |
|
Parks and Open Space |
Source: HNTB Corporation
The MPROP files depict land use over the entire parcel. As mentioned previously, while useful in many parts of the study area, especially in those neighborhoods surrounding the downtown core, there was a need for more detailed building information in the downtown core where various alternative routes would be evaluated. This area extends from Marquette University and the I-43 corridor on the west, to the lakefront on the east, from Walnut Street on the north and to the Menomonee River on the south.
Within this area, the study team conducted a field inventory to verify the information found in the electronic files. Additional information on specific businesses, building heights, attendance and capacity for entertainment venues, number of off-street public parking spaces, and number of hotel rooms, was collected as part of that effort and added to the database.
This information was combined to create the existing land use base. This is shown in Figure 3.
Figure 3 – Existing Land Use
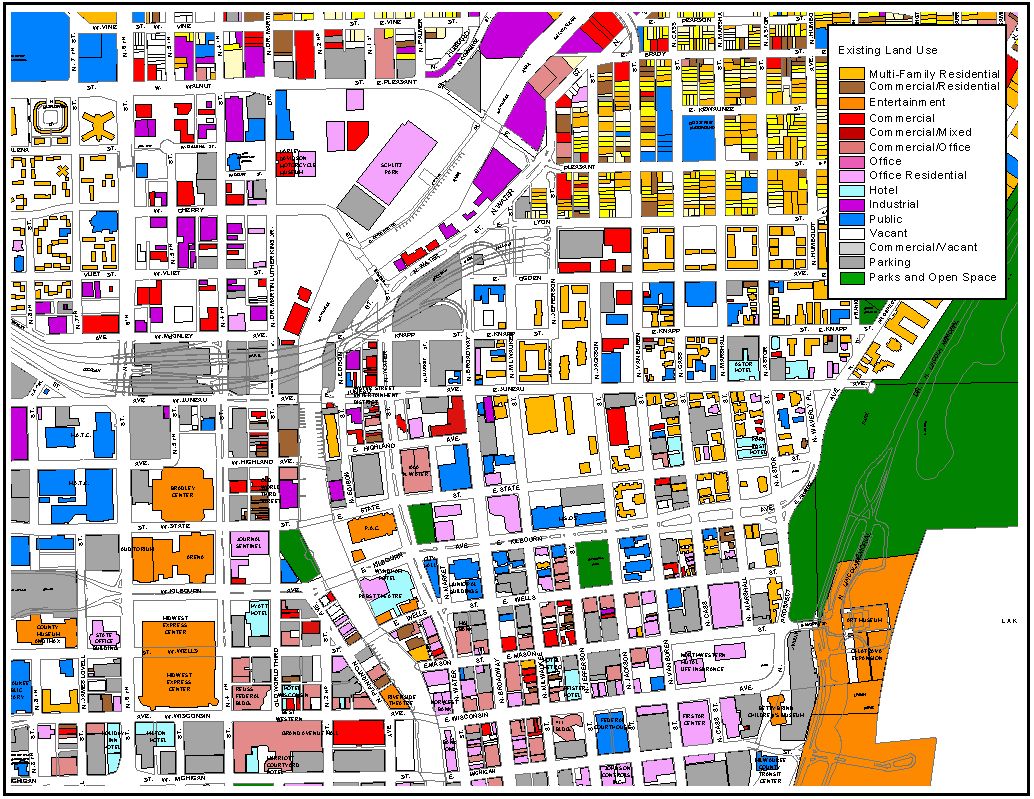
Source: City of Milwaukee and HNTB Corporation
Land Use and Key Elements Base Data
Utilizing the GIS, the land use base data was analyzed both with data queries and spatial analyses. In order to compare future alternatives, a base data table for the study area was prepared. This base data table consists of the existing land use and the key elements to analyze both build alignments and station locations.
Table 3 shows the base data for the project area. The existing land uses, attendance of entertainment venues, and number of hotel rooms are available for the entire project area. The number of office employees and number of off-street public parking spaces are available only within the downtown core area. Also, when using the data for analysis, the study team has used national standards to determine the occupancy of both the hotel rooms and office employees. Occupancy total for the hotels was calculated at 60% and offices at 84%. These percentages are considered typical throughout transit studies.
In addition to the base data table, other tables were developed for listing the hotels and entertainment venues. Table 5 shows the summary of hotels within the project area and the number of rooms. The number of hotel rooms within the project area is 3,168. With an occupancy rate of 60%, the project area has a total of over 688,000 hotel rooms occupied throughout the year.
Table 5
HOTEL SUMMARY
|
Building Name |
Number |
Number of Rooms |
|
Courtyard by Marriott |
1 |
169 |
|
No Data |
3 |
- |
|
The Ambassador |
1 |
121 |
|
Astor Hotel |
1 |
97 |
|
Best Western Inn Towne Hotel |
1 |
96 |
|
County Clare |
1 |
31 |
|
Holiday Inn |
1 |
246 |
|
Hotel Metro |
1 |
65 |
|
Hotel Wisconsin |
1 |
173 |
|
Howard Johnson Inn & Suites |
1 |
108 |
|
Hyatt Regency Hotel |
1 |
484 |
|
Knickerbocker On The Lake |
1 |
100 |
|
Milwaukee Hilton |
1 |
554 |
|
Park East Hotel |
1 |
159 |
|
Pfister Hotel |
1 |
309 |
|
Ramada Inn |
1 |
155 |
|
The Plaza |
1 |
80 |
|
Wyndham Hotel / Milwaukee Center |
1 |
221 |
|
Total |
20 |
3,168 |
Source: Greater Milwaukee Convention & Visitors Bureau and HNTB Corporation
A second table, Table 6, shows the names, available attendance totals for 1999 and available capacity of the entertainment venue. As shown, the total attendance within the project area has been estimated at over 13.5 million.
From this base data and additional tables from the base data, future build alternatives and stations can be analyzed to determine if the residential, commercial, office, entertainment, and visitor related land uses are being served by transit connections.
Table 6
ENTERTAINMENT SITE SUMMARY
|
Name |
Count |
Attendance Totals-1999 |
Capacity |
|
Miller Park |
1 |
1,700,000 |
- |
|
Potawatomi |
1 |
4,000,000 |
- |
|
Summerfest Grounds |
1 |
1,501,715 |
- |
|
Betty Brinn Children’s Museum |
1 |
131,595 |
- |
|
Bradley Center |
1 |
2,000,000 |
- |
|
Broadway Theater Company |
1 |
- |
454 |
|
Calatrava Expansion |
1 |
- |
- |
|
Empire Building/Riverside Theatre |
1 |
150,000 |
2,500 |
|
Marcus Center For The Performing Arts |
1 |
686,309 |
- |
|
Midwest Express Center |
1 |
543,701 |
- |
|
Milwaukee Art Museum |
1 |
165,000 |
- |
|
Milwaukee Auditorium |
1 |
400,000 |
6,120 |
|
Milwaukee Public Museum |
1 |
1,141,000 |
- |
|
Milwaukee Repertory Theater |
1 |
185,132 |
1,034 |
|
Peck Pavilion |
1 |
425,000 |
400 |
|
The Pabst Theater |
1 |
- |
2,550 |
|
US Cellular Arena |
1 |
543,701 |
12,700 |
|
Total |
17 |
13,573,153 |
25,758 |
Source: Greater Milwaukee Convention & Visitors Bureau and HNTB Corporation
Demographics
Additionally, the study team used the 1990 Census data to determine environmental justice information for the study area. The data was developed by block group to not only calculate the estimated population but to address low and moderate income and minority areas.
Development of Year 2020 Future Land Use Scenarios
The Connector Study is looking at a downtown transportation system that will provide transit connections through the year 2020. To facilitate that effort, it is important to know with some degree of probability what the land use will be in the project area at that time. One of the tasks in the study is the preparation of a projected land use scenario for the year 2020.
This scenario is based in large part on the recently adopted Downtown Plan prepared by the City of Milwaukee. This Plan referred to a number of catalytic projects that would help to transform parts of the downtown over the next twenty years. These projects and recommended policies are at the heart of the Year 2020 Land Use Scenario.
In addition to the recommendations in the Plan, the study team reviewed existing land uses, especially those areas that were vacant, under, used, or where it seemed likely uses could change over the next two decades. Recommendations were then made for the types of new developments that could be realized on these parcels. Those recommendations were made based upon the underlying recommendations of the Downtown Plan even if there was no identified catalytic project for the site.
Once land uses were defined, more specific assumptions were made about building size, numbers of residential units or potential employees. In addition, the annual attendance projected for the entertainment venues and the number of hotel rooms used per year was added to the database. That information was then transferred to the ridership and operations projections for the year 2020. Therefore, the Year 2020 Land Use Scenario directly effected future projections and conclusions about the success of the proposed system. Future land use scenarios were developed and verified in cooperation with the City of Milwaukee Department of City Development.
The Year 2020 Land Use Scenario is shown in Figure 4.
Figure 4 – 2020 Land Use Scenario
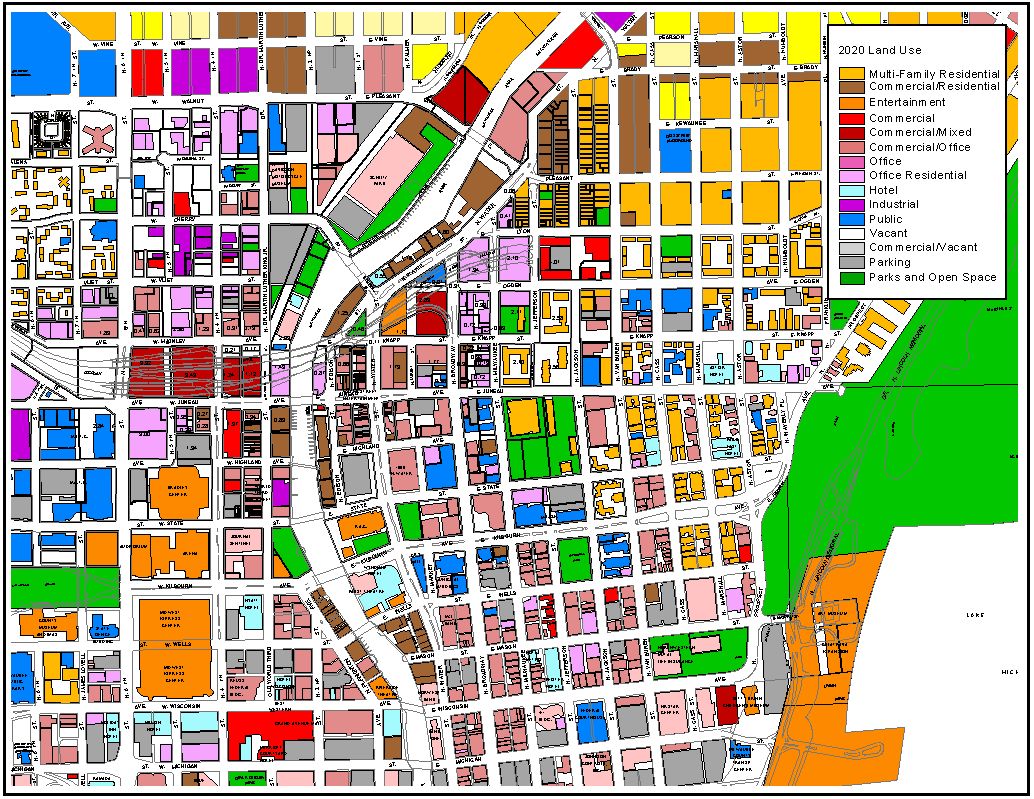
Source: City of Milwaukee and HNTB Corporation
As with the existing land use, 2020 land use is divided into the land use by building with in the downtown core and by block for the remaining portion of the study area. The land use categories are the same, however the data was compiled differently. Instead of assigning land use by parcel in the outlying neighborhoods, the data was compiled by block.
The 2020 attendance and capacity numbers within the database were projected using data from the Greater Milwaukee Convention Visitors Bureau and known expansions with existing and proposed entertainment sites.
The number of office employees data is by building that is within the CBD. The 2020 office employees were calculated by the total sq. footage of the building multiplied by the number of office stories and divided by 275 sq. foot per employee. The square footage per employee was derived from architectural standards. The number of employees were calculated at an 83% occupancy rate.
Hotels were a separate 2020 land use category in which a large number of the visitors to the entertainment site will stay in downtown Milwaukee. The number of hotel rooms should be calculated at a 60% occupancy rate. City of Milwaukee planners were able to assist with future hotel locations and number of hotel rooms.
Land use information for 2020 parking is a combination of the public and private off-street parking ramps and surface lots. The data for the land use portion of the study only includes the number of parking spaces for the public or where the public can park. Many of the surface lots, as planned in the Milwaukee Downtown Plan, have been redeveloped as other land uses. However, several new parking ramps for public use have been proposed for 2020. These parking spaces were calculated by the sq. feet of the footprint, multiplied by the number of stories, and divided by 350 sq. feet per parking space.
Projected Population
The 2020 population figures for the study have been produced by developing the 2020 land use and applying the number of persons per household (residential unit) to derive the projected population. As previously mentioned, the 2020 land use was developed by building within the CBD. The outlying neighborhoods 2020 land use was produced using blocks instead of parcels. The number of residential units were calculated by block from the parcel data. To project the future number of residential units within the blocks, information was collected from the City’s planners and neighborhood plans. The type of land use provided the number of units, or in the case of multi-family, an average number of residential units for the area was developed. The number of units was then multiplied by 2.25 persons per household for the entire study area.
Methodology
Study Area Assessment
To properly analyze the alternatives, the entire study area needed to be assessed. As shown in Figure 1, the study area size nearly doubled throughout the study process. As the study area was expanded, the existing and 2020 land use data was built upon, as was the census data. Through the study process the team summarized the study area for baseline data and for comparison to the alternatives.
From the databases developed for the existing and 2020 land use and their associated attributes, tabular summaries were produced for all team groups to use in comparing alternatives. These summaries included the number of residential units, total population, number of persons in attendance per year at entertainment venues, number of hotel rooms occupied per year, number of office employees within the downtown core, and the number of parking spaces within the downtown core. The assessments of the transit alignments were then compared with the total assessment (entire study area), which produced a final percentage of land uses within each alignment to determine service factors.
Percentages were used to assess the overall changes from existing land use to 2020 land use and their attributes. This assisted in the establishment of the study area for the 2020 land use and their associated attributes. From this process the planned land use was assessed and categorized as a "build out" scenario, meaning all developable land and development potential is built upon. The study team adjusted for the "build out" using assumptions to produce a realistic 2020 scenario for the downtown core. Some areas were defined as "build out" according to factors such as economic development, planning initiatives, and prospective redevelopment plans. As for areas where the team and City Planners believed that growth would not "build out" by 2020, a percentage of vacant land was calculated for land use that provided more reliable projections.
As the study progressed, the ridership team utilized the study area data to assess ridership activity. As a result, the ridership team realized that the existing and 2020 information projected from other studies was substantially lower than the data associated with the GIS scenario. The team decided that the GIS data would be useful in adjusting the potential ridership on the transit system.
Building and Analyzing Alternative Transit Alignments
One of the first planning and GIS tasks undertaken as part of the Milwaukee Connector study was the determination of those sites and areas which should be "connected" by any new transit service in the downtown. A quick look at the study area indicates there are many potential destinations in the project area. Any system ultimately constructed would be limited in the area it could serve and the number of places it could stop. One of the key decisions that needed to be made is which of those destinations will be directly served by the proposed system and which will not. To assist the project team and the Steering Committee in making those decisions, a series of criteria were developed by which to compare potential station stops with one another.
The following criteria were selected for use in determining key destinations. They are not listed in any order of priority. Criteria were not weighted and were considered as relatively equal considerations. They are as follows:
Excluding engineering criteria, all of the evaluation criteria listed above were developed within the GIS database.
In addition to the criteria, the study team and the steering committee identified multiple destinations to provide linkages through a transit system. From both the criteria and destinations, the initial build alternative alignments were developed and digitized into the GIS.
A build alignment is a combination of one or more routes with stations strategically located for the highest potential for ridership and economic development.
The downtown core required locating the stations in closer proximity to one another, whereas in the outlying residential neighborhoods the stations were located at a greater walking distance.
For each build alignment, the station locations were buffered with a reasonable walking distance from the station node. This is shown in Figure 5. The first distance buffered from the station is a 1/8-mile walking distance, and the outer buffer distance represents a ˝-mile walking distance.
Figure 5 – Buffering Station Locations
Source: City of Milwaukee and HNTB Corporation
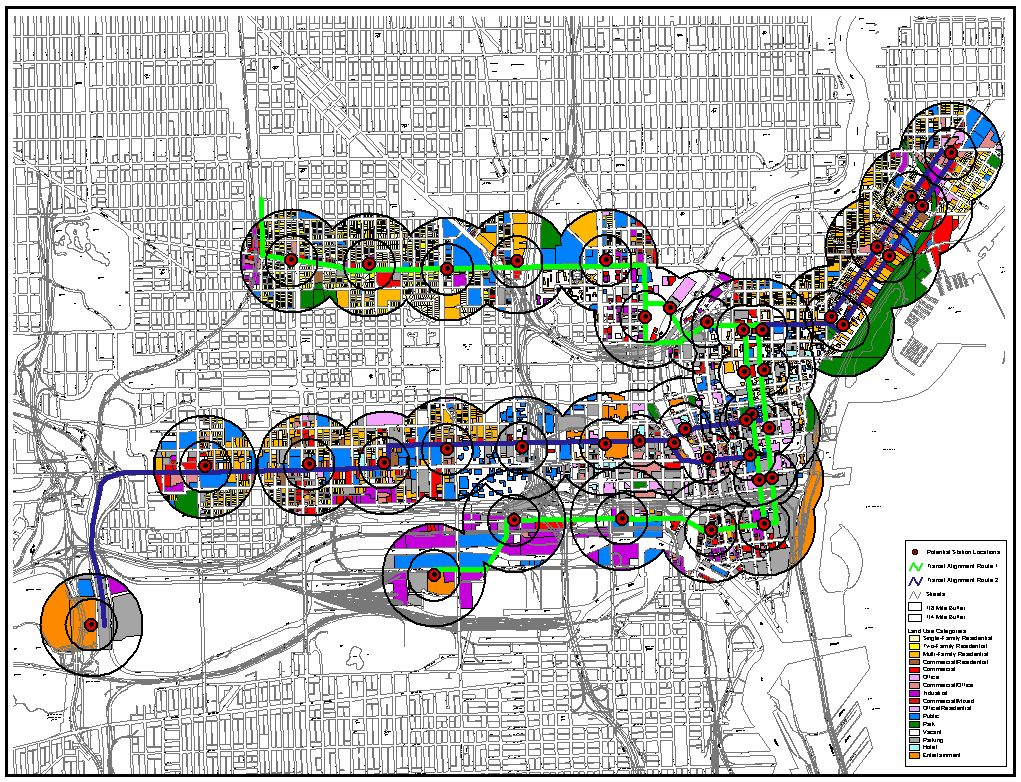
An overlay process was then used to analyze the information within each build alignment as shown in Figure 6. Initially, the analysis was by route to assess the total impact of the alignment within and 1/8 and ˝ mile.
Figure 6 – Buffering Station Locations By Build Alignment
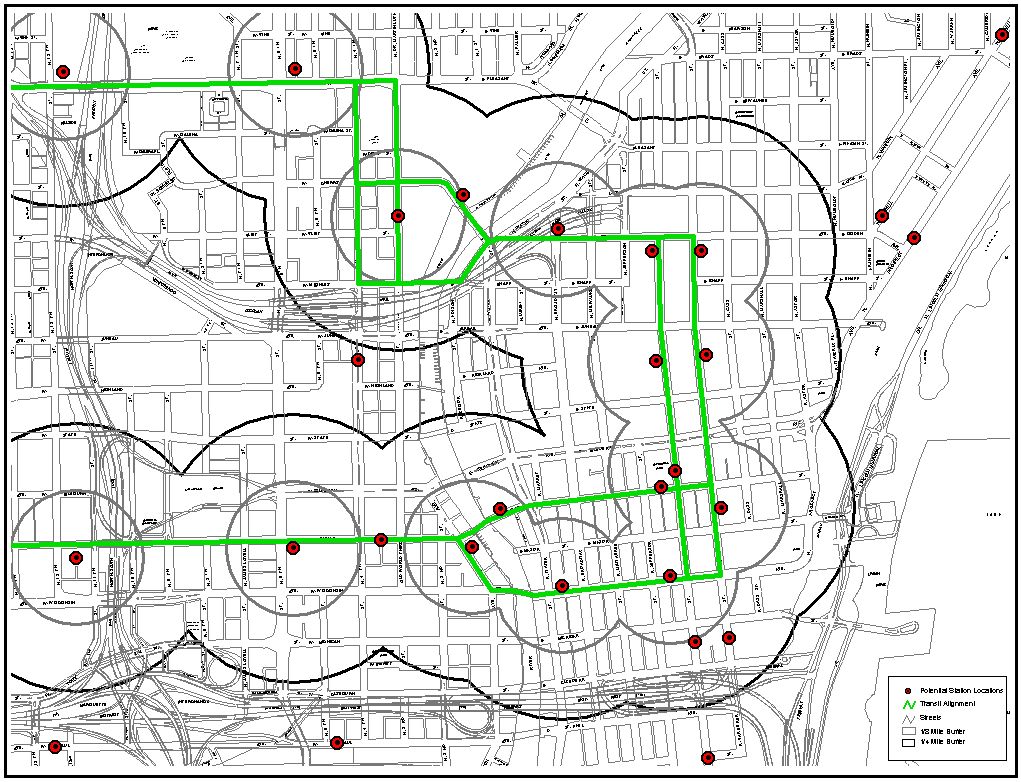
Source: City of Milwaukee and HNTB Corporation
After viewing the results from the first overlay process, the team decided that the process needed to be revised for the results that they needed, which was to properly analyze all alternatives. First of all, out of the initial three build alignments, two of the build alignments had two separate routes. The team needed information on the entire build alignment and each separate route without duplicating data. The team also decided that an analysis should be processed to show the potential for each and every station. The following definitions explain each overlay process to provide the data that the team needed to accurately assess each build alignment, route, and station location.
Figure 7 – Station Buffer with Land Use
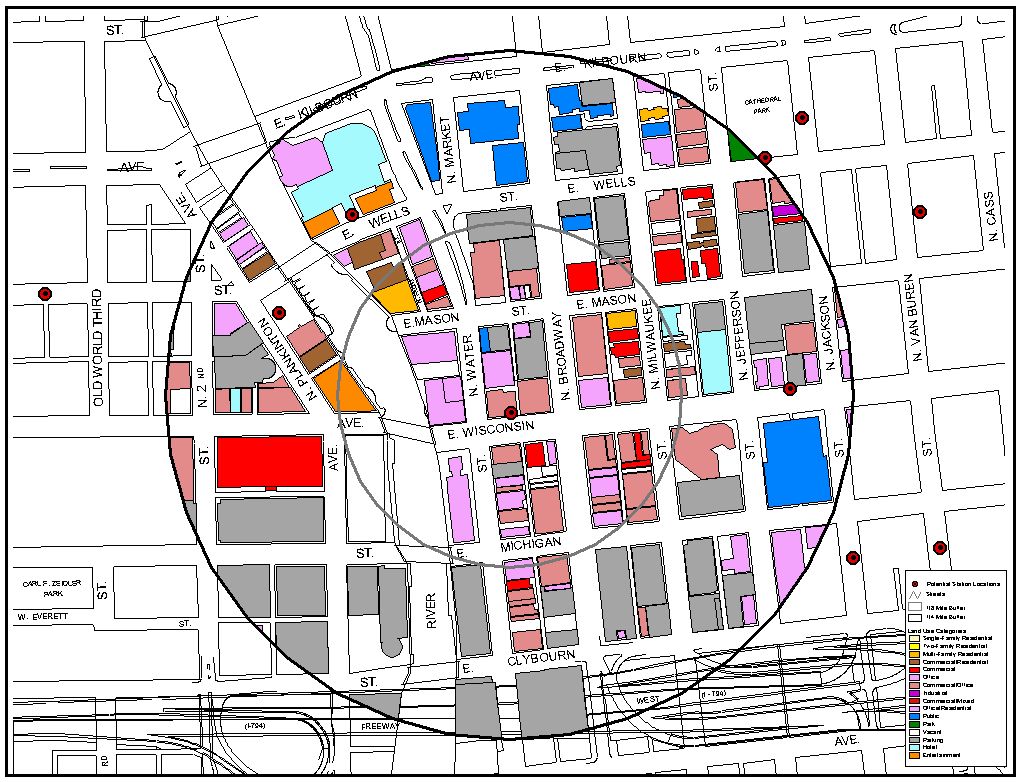
Source: City of Milwaukee and HNTB Corporation
Figure 8 – Land Use Within A Route
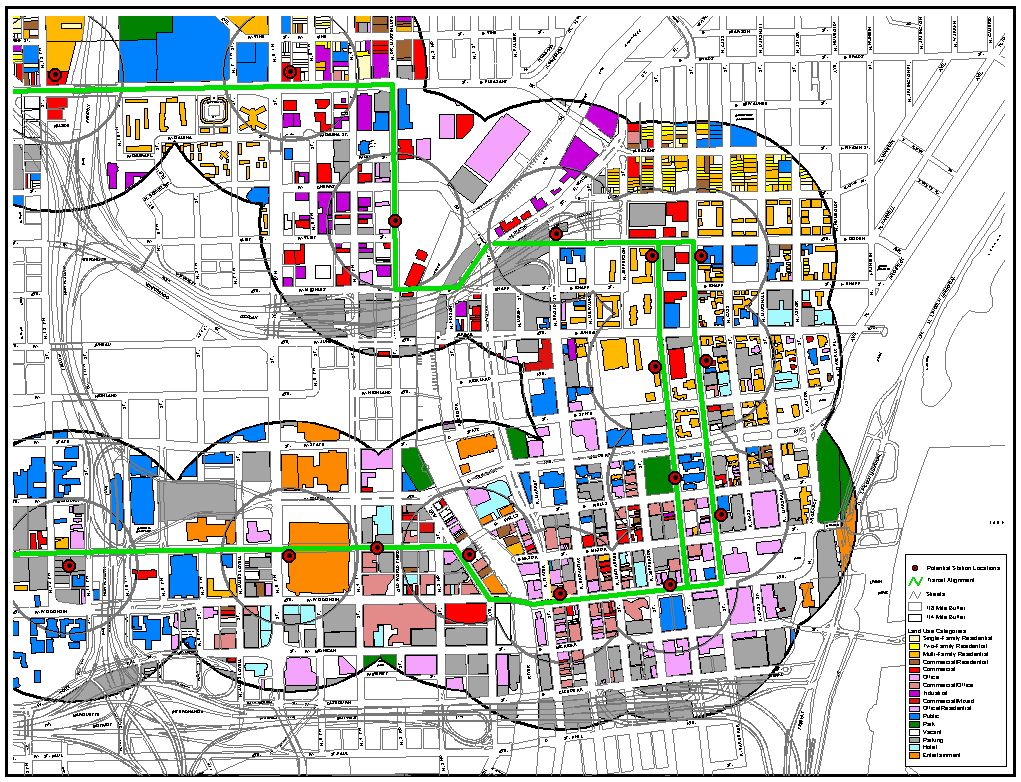
Source: City of Milwaukee and HNTB Corporation
Figure 9 – Land Use within A Build Alignment
Source: City of Milwaukee and HNTB Corporation
Ridership Analysis
The GIS was utilized to assess the existing and potential ridership for the connector system. As mentioned previously, the ridership team realized that the information projected from other studies were substantially lower than the data associated with the 2020 scenario developed with the GIS. Ridership is developed through a modeling program using existing or projected land uses, population, retail and office employment, and other generators. The data contained within the studies land use was used to adjust the 2020 scenario for ridership. By overlaying the Traffic Analysis Zones (TAZ), used in the modeling, with the land use, 2020 ridership figures were developed.
Lessons Learned
Special thanks to the Study Project Team and Client for their input into this paper.