
Danielle Hartman and Luca Liberti
PRESENTED AT THE TWENTY-FIRST ANNUAL Esri USER CONFERENCE
July 9-13, 2001
Abstract:
Brooklyn, New York has 2.5 million people and thousands of restaurants, featuring virtually any cuisine in the world. For the Brooklyn Chamber of Commerce, CommunityCartography developed MapObjects-based internet applications to enable people to find restaurants and other information about their communities. Ease of use was essential to our design strategy. We focused on creating pages that were simple for the average internet user to easily navigate, and dealt with many issues of web design that become critical when GIS is served on the internet. iBrooklyn.com includes map pages for property data, transportation, census data, and administrative districts as well as restaurants.
Introduction:
The Brooklyn Chamber of Commerce has launched a new web site at iBrooklyn.com featuring information about their many business and community activities. CommunityCartography developed web pages for the Brooklyn Eats restaurant guide, a Business Directory, and a Brooklyn Atlas. The project manager at the Chamber of Commerce guided the development of the site design with an emphasis on ease-of-use and using feedback from informal demonstrations.
|
|
The Brooklyn Chamber of Commerce was founded in 1918, and is the largest Chamber of Commerce in New York City. It is a private, non-profit business membership association primarily made up of small businesses. The Chamber of Commerce supports economic development and promotes cultural activities throughout Brooklyn. |
|
|
CommunityCartography, Inc. was started in 1998 to provide GIS solutions for the New York City community. CommunityCartography is affiliated with HydroQual, Inc. (an Esri Business Partner), and the two companies share employees and other resources. We have established a spatial data warehouse that contains digital maps and databases for real estate, community facilities, electoral districts, census data, and more. Much of our data comes from public sources, but is often in a format difficult for the average person to access--data comes on 9-track tapes or mainframe cartridges, or paper maps. We make this data available as custom-designed maps, data on CD-ROM, and through GIS applications on the internet. The web applications developed for the Brooklyn Chamber of Commerce were designed to provide businesses and residents of Brooklyn access to much of this data in the easiest way possible. |
 |
HydroQual, Inc., the parent company of CommunityCartography, is an environmental engineering and science firm in northern New Jersey. HydroQual's range of environmental services include the issues of water quality, floatables pollution, ecological risk assessment, watershed management, water and wastewater treatment, hazardous waste management, and permitting. HydroQual employs a variety of sophisticated and state-of-the-art computer tools including GIS for data management, mathematical model development, and statistical and graphical analyses. |
Why we used MapObjects:
The map pages at iBrooklyn.com were developed using MapObjects 2.0 (© Esri), 2.0 (© Esri), and Visual Basic 6.0 (© Microsoft). Data was created and edited in ArcView 3.2 (© Esri). Map images are converted to GIF files using CopyCom (© Eckler Software), a DLL control that uses RLE compression. CommunityCartography hosts the map pages, while the remainder of the iBrooklyn.com site is hosted by an off-site ISP. The CommunityCartography server configuration consists of two Windows NT machines, with one as the web server and the second as the map server.
Although ArcIMS 3.0 had just been released as the iBrooklyn.com project was in the planning stages, we decided to use for several reasons. ArcIMS was a new product with an unknown learning curve, whereas we had developed pages in MapObjects before for our own web site at ComCarto.com. We were working under a tight deadline and didn’t want to get sidetracked learning a new product if that meant diverting attention away from customizing the site. Because we were designing for a general audience who didn’t need advanced GIS functions on their web site, we opted for the simpler MapObjects implementation.
Designing the map applications:
The map pages at iBrooklyn.com were designed for a general internet audience, assuming visitors to the site had no knowledge or experience with GIS tools or terminology. We started with a template we had used at ComCarto.com which utilized a moderately complicated design including radio buttons to choose the active layer and current tool, and check boxes to turn layers on and off. Each map application for iBrooklyn.com was customized to include only the tools necessary for the user to extract the most useful information.
Throughout the development process, many versions of the map pages were tested by employees and guests at the Chamber of Commerce. The feedback from these valuable sessions, along with informal comments from various visitors to the site, was used to determine what level of functionality to give each page. We found that many features that gave the user control over how information was displayed came across as confusing. Too much information was distracting rather than helpful. A few individuals wanted to remove virtually all of the tools, which would eliminate the advantage of using an interactive GIS application rather than static images. Through this ongoing feedback process, we managed to find a strong balance between making the pages user-friendly while retaining the most useful functions.
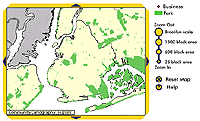 |
The primary design simplification was to have only an identify tool available when clicking on the map image. Thus there is no page where a tool must be selected before performing a function. To navigate around the map, we created pan buttons to frame the map image. A column of zoom buttons off to the side offer quick zooms to preset scales plus fine-scale intermediates. Appropriate maximum and minimum scales were set for each page, limiting the extent of fine-scale zooming. |
The map applications were designed to be stateless. A set of variables is passed with each map request that includes what information is displayed, the view extent, and the function that is being called. If the user has performed a search, that information will be retrieved again unless they choose to clear the selection or perform a new search. This was you can zoom and pan around the map without losing the selected set.
On certain pages the user can choose the active layer to identify. On these pages, if the map image remains the same, the program uses the same map image instead of generating a new image to be downloaded. While the map images are relatively small GIF files, this is a noticeable improvement in speed when using a modem connection.
The iBrooklyn.com web site was designed by another company while the content and map applications were still being developed. The site design is heavily dependant on frames, with site navigation tools on the top, left, and right edges of the screen. This gave us only the center panel to work with, of a preset width.
Because of the site’s large top frame, most users cannot see the full map image on their monitor without scrolling the center frame. This scrolling becomes tedious when navigating around the map, so we wanted to encourage users to utilize the full-screen option on their browser. We had the web designer add "maximize" and "minimize" buttons on their frameset for the map pages that automatically switch the browser to full screen mode. Because the frameset was already performing a browser check, they were able to easily add this feature into their code.
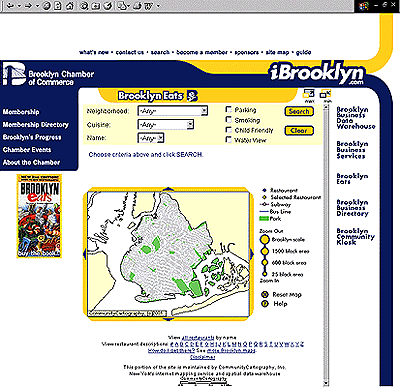 |
The center map frames were designed with the tools for user input on the top of each page, then the map image, followed by any search or identify results at the bottom. Even in full-screen mode, it is not always apparent when a search has yielded results. For this reason, we added a section on each page above the map that displays feedback to the user based on their previous action. Initially it informs them of the functions they can perform on the page. If they identified a feature, it tells them if any information was found. If they performed a search, it will tell them how many results were found, and if there were no results, it asks the user to try again with a different approach. |
Designing annotation themes that were readable at various scales was a time consuming process. Because the basemap we used (Bytes of the Big Apple, the tax basemap from the NYC Department of City Planning) does not align well with the street centerline file, we could not use the street layer to display labels with standard Esri labeling functions. Instead, we have an annotation layer of short line segments that we use for labeling streets with this tax basemap. We created two new annotation layers—one of major roads, and one labeling every-other block. By switching between these three annotation layers, legible street names appear at every scale. Considering the amount of time spent on creating these extra annotation layers, we may have been better off registering the street centerline to the basemap to use at all scales.
 |
Brooklyn Eats: Brooklyn Eats is a restaurant guide published yearly by the Brooklyn Chamber of Commerce. The first map application we designed was for Brooklyn Eats, in preparation of the 4th Annual Food, Wine & Beer Tasting Festival on October 12, 2000. The iBrooklyn.com web site was officially launched at a press conference at the beginning of this event, which had nearly one thousand enthusiastic attendees. |
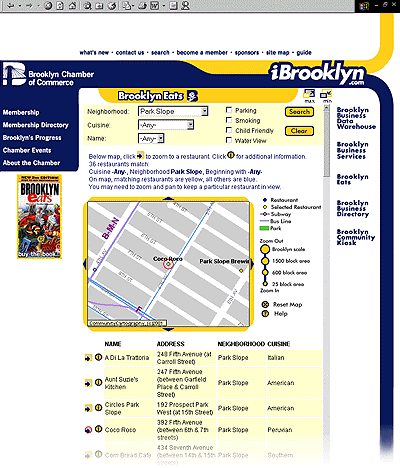
We geocoded the Brooklyn Eats database using our Parcel Address Dictionary (© CommunityCartography) to place the restaurants as points on the appropriate tax lots. The user can click on any restaurant on the map to identify it, and the information will appear in a table below showing name, address, neighborhood, and cuisine. A link to a separate page gives more information including hours of operation, price ranges, and closest subway. On this page, all restaurants are displayed as blue points to encourage users of the site to explore new restaurants. Restaurant labels are shown at the closest zoom levels, and subway lines are also labeled to provide context.
The Brooklyn Eats page contains a query function where users can search for restaurants by cuisine, neighborhood, and special characteristics such as parking, smoking, waterfront view, and child friendly. The project manager also requested that users be able to search by restaurant name, but because of the high chance of spelling errors, we implemented a search by first letter of the restaurant name instead.
Search results are displayed in a table below the map, containing the same information as the identify results. The map view automatically zooms to the extent of the selected restaurants, which are highlighted in yellow on the map. If there are multiple matches, the user can investigate individual restaurants and not loose their selected set. To zoom into a particular restaurant from the results table, the user can click on the “go there” button and the map will zoom to the restaurant selected. On the map, this chosen restaurant is circled in red, while the remainder of the restaurants matching the search criteria continue to appear as yellow points. In the table below, the selected entry is has a red “go there” button to stand out amongst the search results list.
In the original design, we had included a drop-down menu that allowed the user to choose which data layer to identify—restaurants, subway lines, subway stations, or bus routes. Even with the default choice set to the restaurant layer, during early site testing this was determined to be too confusing and was eliminated from the page. Another function that was rejected after testing was to have the map zoom to a feature after the user identified it. The change in scale was unexpected and disorienting for some users.
Business Directory:
The Business Directory contains the current members of the Brooklyn Chamber of Commerce and is searchable by company name, contact name, category, and subcategory. Additional information on each member includes a description, company name, address, phone number, email, and links to the company’s homepage. The membership data on the map server is updated on a monthly basis.
With over 200 business categories and subcategories to choose from, we decided to implement two drop-down menus where the subcategory is dynamically refreshed when a category is chosen. This way we avoided the problem of the user having to scroll through one long drop-down menu or have them guess at the proper key words to type into a search text box.
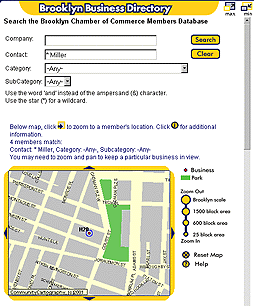 |
Businesses are displayed as red points and labeled with an alphanumeric code. With many businesses close together, and sometimes even in the same building, there are often points overlapping each other even when zoomed in. This close proximity, combined with long company names, would make more descriptive labels unreadable. Points are drawn on the map using a filter method instead of using colors to differentiate search results as done on the Brooklyn Eats page. This cleans up the look of the map, and ensures you cannot identify a hidden point that doesn’t match the search criteria. |
Most of the members are in New York City, with three-quarters of them located in Brooklyn. Approximately five percent of the members are elsewhere in the Mid-Atlantic region, with a few as far away as California and Louisiana. Because this site only includes detailed data for New York City, we cannot use the same zoom levels for all search results. We devised three geographic categories to control how far in a user can zoom depending on the location. Users can zoom to street level for Brooklyn addresses and to neighborhood level for the rest of New York City, where there is enough additional information to provide context. In southern New Jersey or California, for example, zooming in this close would give you a view with a point surrounded by nothing—so the zoom is limited to an approximate state scale. When a search returns multiple results, the map view is constrained by these geographic categories. The "go there" button must be used to zoom in closer to a particular point, which is then circled in blue.
Some members do not wish to be physically located on the map, and list only a P.O. box for their mailing address. Because these businesses still need to appear in search results, they are placed on the map beyond the maximum view extent. The results table does not include the "go there" button for these records.
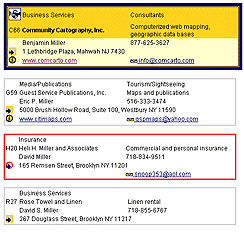 |
Certain members of the Chamber of Commerce have enhanced listings in the Business Directory. These members contribute extra services to the Chamber of Commerce, or pay a small fee to have their listing stand out in the search results. The project manager did not want to have premium members listed on the top of the page, but for them to remain alphabetical. Instead, two enhancement levels were designed to highlight these members with a colored frame and an icon depicting their business category. |
Brooklyn Atlas:
|
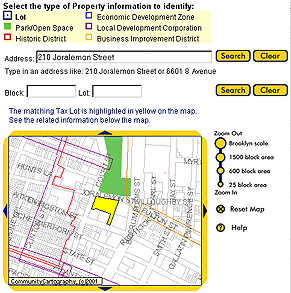
The Brooklyn Atlas consists of four pages containing maps for property data, administrative districts, transportation networks, and census data. Unlike the Brooklyn Eats and Business Directory pages, these Atlas maps have multiple data layers that can be identified. The user can change the active layer by clicking on its legend symbol which appears above the map. These legend graphics are form elements, so the page is resubmitted automatically when one is selected--a "refresh map" button is not necessary. The Property map page shows tax lots, parks, historic districts, business districts, and economic development zones. Users can query and identify tax lots to find property information including the owner, zoning, land use, and building class. Properties may be found either by street address or by block and lot number. Currently this is the only online resource to find all of this information on one easy-to-use page. |
 |
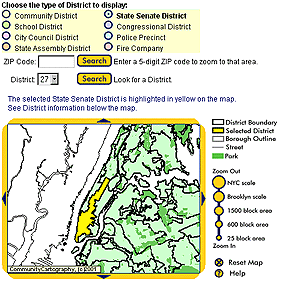 |
The Administrative Districts page displays maps of community districts, school districts, City Council districts, State Assembly districts, State Senate districts, Congressional districts, police precincts, and fire companies. This is the only page of the Atlas that includes data for all five boroughs of New York City. During testing we discovered that some users wanted to search by district number to find data without needing to know what part of the City to navigate to. We added a reverse look-up using a drop-down menu that changes depending on the active data layer. You can also search by zip code for a quick zoom to a particular neighborhood. Identifying or searching for a district displays the representative’s name, address, and contact information in a table below the map. |
|
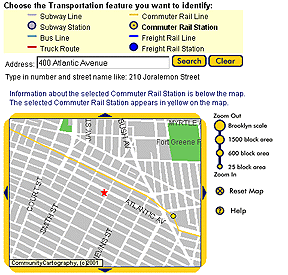
The Transportation page displays maps of subway lines and stations, bus routes, truck routes, commuter rail lines and stations, and freight rail lines and stations. To keep the map uncluttered, each line and station pair is displayed one at a time. You can search for an address to zoom to a particular location, which is indicated by a red star. Identifying a feature displays the route or station information below the map. |
 |
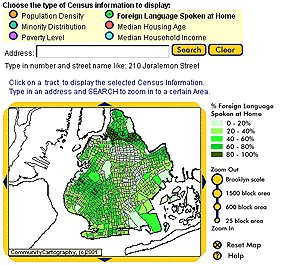 |
The Census page displays eight different thematic census maps at the tract level. These give information on population density, racial distribution, percent below the poverty level, languages spoken at home, housing ages, and median household income. This page also features an address search to help you quickly find the area you are interested in. It took some trial-and-error effort to design effective color ramps for these themes because of a documented bug in the bitmap exporter, before we began using the GIF converter. |
Searching for an address was found to be a desired feature on all Atlas pages, especially for users not familiar with the City’s geography. Our early site testing showed us that users wanted to be able to quickly find a location without having to zoom and pan around the map. The Atlas uses different kinds of geocoding methods depending on the map page. The Property page allows users to look up information on a particular tax lot. Geocoding to the street centerline would only give an approximate location, which is not accurate enough to locate a particular tax lot. On this page, searching for an address connects to an address lookup table with an SQL query to find the corresponding tax lot number. Then the tax lot number is found in the taxlot basemap shapefile and highlighted on the map with the data displayed below.
We added a geocoding function to the Transportation and Census pages using the street centerline file. This provided accurate enough locations since tax lots are not shown on these pages. On the Administrative Districts page, each data layer includes all five boroughs of New York City. Geocoding a street address citywide would require first selecting which of the five separate street centerline layers to use. Due to deadline constraints, we opted to use a zip code search on this page instead, since we already had a citywide zip code layer. Citywide street address geocoding will be added to future versions of the Administrative Districts page.
Improving site performance:
Although we found to be generally very stable, it would randomly shut down a map service, a documented problem for MO IMS 2.0. To get around this issue, we reconfigured the code so we didn’t have to use Administrator. We wanted an easy way to restart a map application if there was a problem, as our budget did not allow for round-the-clock service. We attempted to make the map applications into NT services using srvany.exe but were unsuccessful. Instead, we modified the MapObjects code to include the necessary configuration settings, and each map service was compiled as an executable program.
We installed the program A1Monitor Network Monitor (© A1Tech) to check each web page periodically, and restart an executable if a page became unavailable. Along with this, we installed a Windows NT utility to automatically login after the machine reboots. If there is an unrecoverable error, the map server can be rebooted and all map applications and the monitor will load automatically from the startup folder. The combination of making the map services into executables and using A1Monitor to restart them has proved to work very well.
Future developments:
The map applications at iBrooklyn.com were developed under a tight deadline for the initial launch date. We have several planned enhancements to the existing pages, plus a new page featuring many datasets now unavailable anywhere online.
We are planning to offer a Premium data page similar in design to the Property page, where users can view detailed information from a variety of data layers. In-depth information will be available from the real estate table, along with additional owner information, city-owned property data, mortgages and deeds sold in the previous year, building permits and violations, and community facilities data. Subscriptions to members of the Brooklyn Chamber of Commerce and others will be available for a small monthly fee. We will use ArcIMS 3.1 to take advantage of the restricted access features.
Now that a more accurate basemap is becoming available for New York City, we will update our data sets to align with the new basemap. This NYCMap is accurate to within 1-2 feet, and will allow us to use a street centerline to generate clean street labels at any scale.
One suggested change that the Brooklyn Chamber of Commerce is considering is to add a "hide map" feature for quicker searching. On pages such as the Business Directory where location is not the focal point, some users would prefer to have a simple search interface and not have to wait for the map image to download.
On the Brooklyn Eats page is a link to the Transportation map page along with the other Atlas pages. We could enhance this link so that the "How do I get there?" link passes the address of the selected restaurant to the Transportation map application. This would work the same as a search for an address on the Transportation page, bringing the view to the restaurant’s neighborhood and marking its location with a red star. From this map the closest transportation features could be identified.
Another possible addition to the Brooklyn Eats page is to add enhanced listings, similar to the Business Directory. Featured restaurants could be highlighted in the same way, with icons showing characteristics such as parking, water-view, or child-friendly.
Conclusions:
This project posed some interesting challenges in designing internet mapping applications. We found that in seeking to simplify the site’s design, we had to implement more complex technical solutions. The customizations we designed weren’t difficult to program, but they took considerable planning and testing to arrive at.
The feedback gained from many rounds of testing enabled us to streamline a sequence of GIS functions to a great extent. A search produces the map that is most useful to the user with the least number of intermediate steps, and brings them the results that they expect to see. Creating the "go there" button to highlight one record from a selected set helped non-GIS users to see the relationship between the map and the table.
Initial reaction to the web site has been very favorable. We expect to see an even greater response when the advertising campaign begins this fall.
Author Information:
Danielle Hartman is the Spatial Data Manager for CommunityCartography, Inc. (affiliated with HydroQual, Inc., an Esri Business Partner). She is responsible for producing maps, spatial queries, and internet applications for CommunityCartography and HydroQual clients. She graduated from Swarthmore College with a degree in Biology and Environmental Science.
Luca Liberti works as Engineer II at HydroQual, Inc. He is mainly involved in water quality modeling and participates in many programming projects. He was responsible for the Visual Basic code development for the iBrooklyn.com web site. He graduated from University of Rome 'La Sapienza' with a Master's degree in Environmental Engineering.
Danielle Hartman