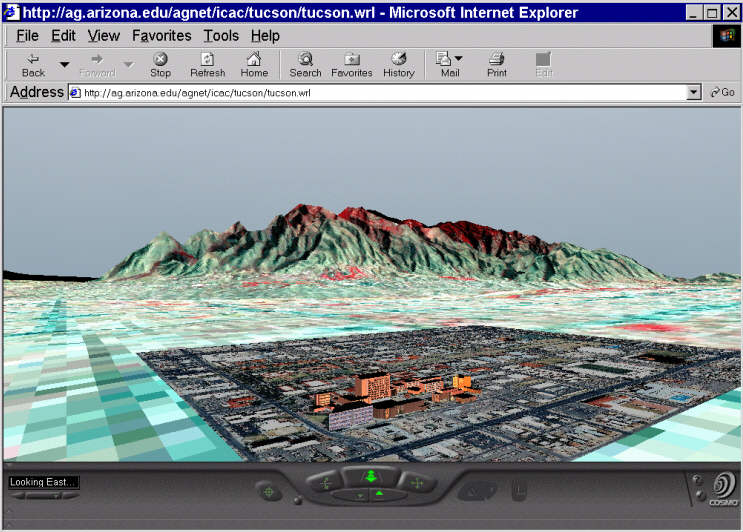
Figure 5: Part of Tucson in a VRML
The City of Tucson, Pima County, and University of Arizona are building educational GIS applications that extend beyond the typical domain of IT experts. These applications, using real-world data are aimed at informal K-12 and public education venues. With them users will learn GIS while they track neighborhood sustainability, beautification, desirable places to live and so on. They will also make use of an extensive set of on-line orthophotos and multispectral data. The goal is to induce these non-technical users into learning a complex technology while they do useful things.
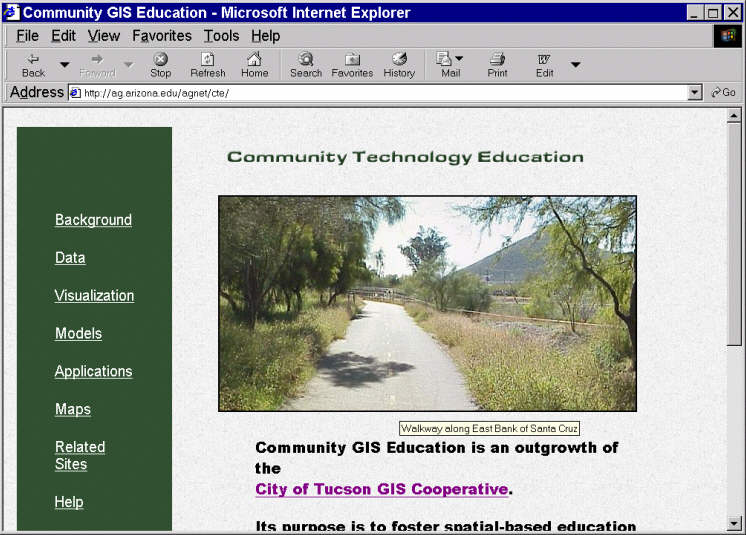
The Community Technology Education (CTE - http://ag.arizona.edu/agnet/cte) project grew out of collaborations between several users of GIS data in the Tucson basin. The primary users of spatial data in the Tucson city government, Pima County and the University of Arizona participate in a GIS collaborative organization (http://www.ci.tucson.az.us/gis/html/cooperative.html) one of whose goals is to spread the use of GIS data and technology into the community. CTE has taken on this task with educational projects extended into informal K12 and public education venues.
CTE began meeting several months ago, and now draws a large list of participating agencies to its monthly meetings, including the Public Library, Tucson Clean and Beautiful, Trees for Tucson, Tucson Sustainable Neighborhoods Association, Tucson Pima Arts Council and many other community organizations. Collectively, these organizations play host to several after-school programs for teenagers, some of whom are at-risk youth. Neighborhood associations are also a target audience for CTE. Finally, a new formal GIS education program is being developed at Pima Community College and CTE will feed content to that.
CTE is driven by local data. Arizona in general and Tucson in particular have a long history of working with spatial data. There is a lot of expertise among local agencies and a lot of GIS data available to the public. However, non-technical users are faced with a daunting challenge trying to cross the technology gap and make their own use of this data. To this end, CTE has tried to find ways to make this complex technology more palatable to the non-technical. One way to do this is to provide local data that is both recognizable and pertinent to real-world uses by groups and individuals.
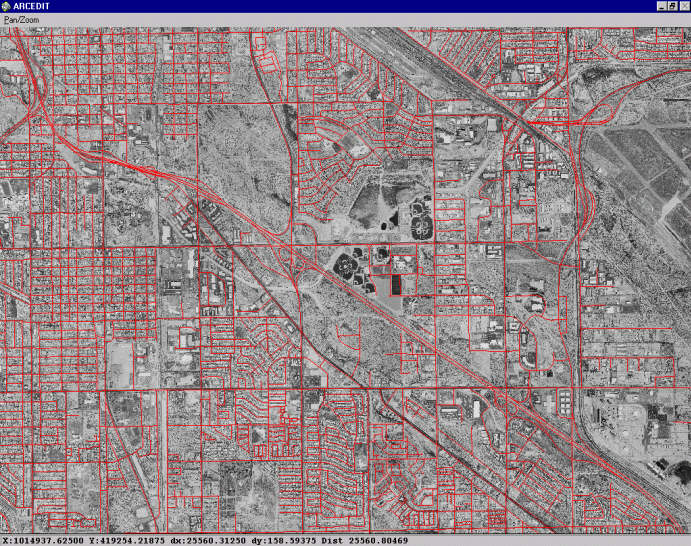
The heart of the data that feeds CTE is the Pima County GIS Library (http://www.dot.co.pima.az.us/gis/data). The GIS Library contains over 400 layers of local data, and is jointly maintained by Pima County and the City of Tucson, with input from a multitude of local jurisdictions, agencies, and organizations. Most of it is physical data, including streets, parcels, zoning, floodplains, etc. It also includes a set of orthophotos to 1 foot resolution, infrared, and elevation data.
Data from the University includes more social and demographic data, as well as natural resource data. There is also a complete sent of satellite imagery, digital ortho quads and more elevation data at the University's remote sensing archive at http://aria.arizona.edu/. Other data is gathered from the users themselves, including object attribute data, digital photography, GPS points, and field spectrometry to calibrate the aerial and satellite imagery.
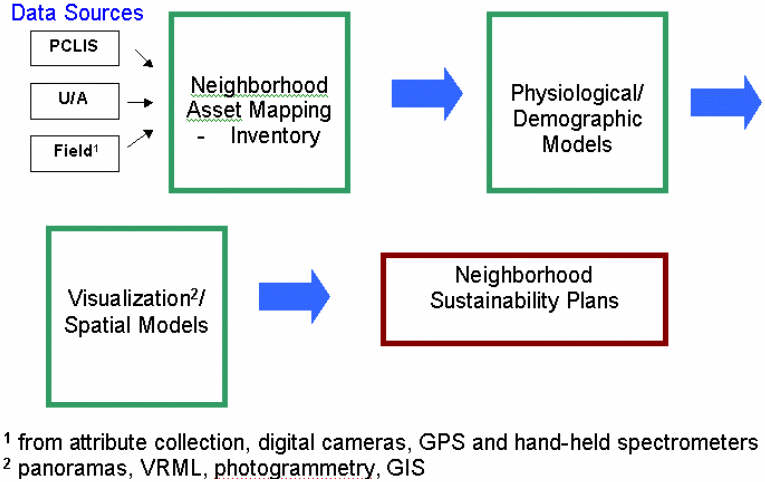
This data is fed to user applications - neighborhood resource assessments, models and visualizations from which neighborhood sustainability plans are derived. Then "what-if" scenarios can be devised with various suggestions, such as planting trees to beautify and cut down on carbon monoxide, adding streetlights to thwart crime, changing traffic flow to accommodate some safety concern, etc.
Data from the University includes more social and demographic data, as well as natural resource data. There is also a complete sent of satellite imagery, digital ortho quads and more elevation data at the University's remote sensing archive at http://aria.arizona.edu/. Other data is gathered from the users themselves, including object attribute data, digital photography, GPS points, and field spectrometry to calibrate the aerial and satellite imagery.
This project tries to take advantage of peer-to-peer and visualization technology principles, to reinforce the project's sustainability. Community education projects often fail because there is no hands-on involvement by the stakeholders in providing and shaping the data (Leitner). Typical examples of this are projects that extend large datasets to schools or the public that are unusable, except by very skilled technical users. These data are often constructed to satisfy IT managers' storage constraints, and very complex query building is required to use them. GIS queries are even more challenging.
Peer-to-peer applications follow a model that invites end users to collect and construct their own data (Oram). Some methods we will use to accomplish this are:
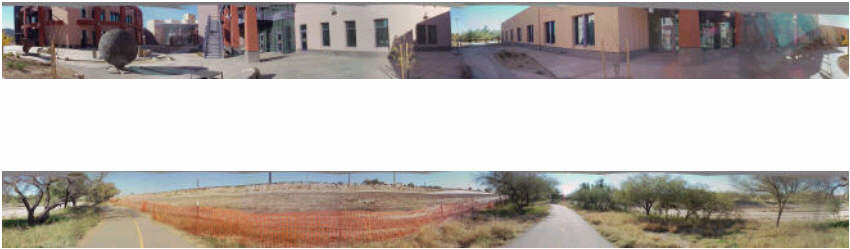
Figure 5: Part of Tucson in a VRML
Unsophisticated users can work with complex data when they have a visual interface. It also helps if they collect their own data - then they are drawn much more deeply into the project. We hope that we can eventually help seed a city-wide initiative, and a community data archive aggregated from independent neighborhood projects that can perhaps feed larger models.
This is a very simple module, intended to acquaint the non-technical user with basic GIS capabilities. The scavenger hunt at http://www.dsd.co.pima.az.us/gisday/Scav1.htm will be converted to ArcIMS so we can do more interactive spatial activities with it. It will be enhanced with more sites, and we will build panoramas for all the sites. Behind those panoramas we can hot-link to other information about the site. We can also add more spatial queries to the game, like buffering to find multiple sites, and routing between the sites. They can link to cultural objects and histories as well. (SWP, TUSD, ASM).
Technical skills acquired: finding locations, distance mapping and routing, buffering.
This module and the next one center on collecting inventories of neighborhood assets, building neighborhood profiles, and subsequently constructing plans for the neighborhood including rerouting traffic, reducing crime, and proposing beautification projects. (TPAC, TCB, TISC). As before, cultural data will play a role, helping to determine neighborhood locations of particular historical value, for example, and then linking those to data collections at the University. (SWP, TUSD, ASM)
As stated above, it is important for non-technical users to have tools they can use easily. Mapping and modeling a neighborhood with basic GIS is not trivial. Visualization can make that task a much easier one. To make this happen, the students/users themselves will create 3D mock-ups of their neighborhoods, which will integrate with databases in multiple locations. Users will begin by building 2D panoramas using digital cameras, and linking those panoramas to data sources. The panoramas themselves will be geo-referenced using GPS, to provide access to GIS data.
Beyond these simple visualizations, the project team will generate neighborhood virtual walk-throughs and fly-throughs using 3D modeling software. The latter will initially be generated from othrophotos, elevation maps, and algorithms generating Z-values on buildings based on number of stories and output to VRML. The VRML models will then be integrated with GIS (examples can be found at (http://ag.arizona.edu/agnet/vrml/). Later we will use photogrammetry-based products to build more realistic visualizations directly from digital photography. (EK)
Technical skills acquired: acquiring data, inventory, overlay, integrating GIS with other databases, image acquisition and manipulation, 3D, visualization.
In this module, users will learn how models work, and will be permitted to adjust the coefficients in a model. They will be asked to offer suggestions for improving the neighborhood, and to work out a cost/benefit analysis for these improvements.
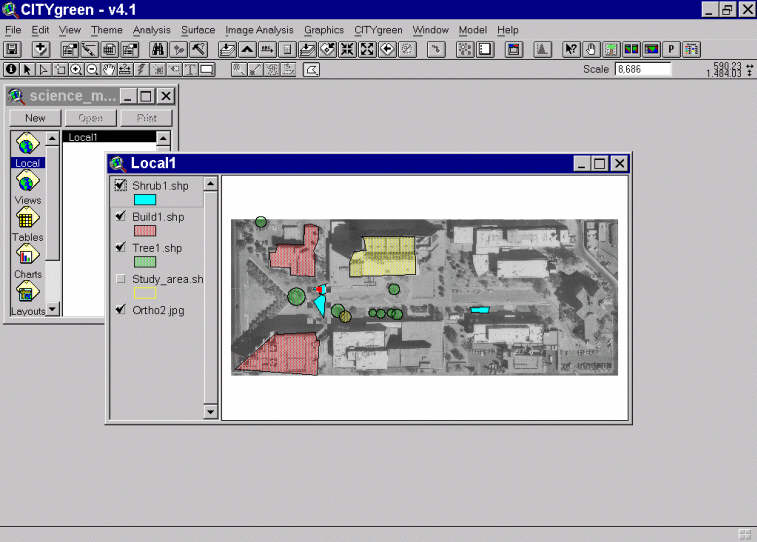
For example, a student working with a visualization of their neighborhood, makes a determination about where a tree might go. They log into the University for an image of the plant, size it and fit in their visualization. Or they find out about another panorama, where they can go and look at an in situ example of the tree. They collect attribute information regarding the existing vegetation base, and then run this determination through a model like City Green to calculate a cost/benefit analysis in terms of reduced carbon monoxide, effect on runoff, shade cooling, etc, of a new planting.
Next they get an image, maybe even a scalable 3D of the tree, and insert that into their visualization so they can get a better idea of how it will look. They can also run spatial models on it to determine viewing from different locations, how the tree might affect run-off, etc. Finally, they contact the Trees for Tucson program in the Tucson Clean and Beautiful organization and arrange for a tree.
Other examples include a neighborhood stress model, detecting and treating hot spots in park for more efficient watering, and monitoring wildcat dumping/flood control detection and control. The latter two examples include having the users work with satellite imagery, aerial photography, and hand-held spectrometers, with which they will again be collecting data, this time to calibrate what they find in the imagery. The stress model is a multi-variate model in which users can adjust the weight of different factors - crime, traffic, or population demographics, for example - to reach their own preferences. As a community, a neighborhood organization can use this ranking process to prioritize their budget.
Technical skills acquired: complex modeling.
Leitner, Helga, et al, "Modes of GIS Provision and their Appropriateness for Neighborhood Organizations: Examples from Minneapolis and St. Paul Minnesota, URISA Journal, Fall, 2000, p. 45 - 58.
Ed. Oram, Andy, Peer-To-Peer: Harnessing the Power of Disruptive Technologies, O'Reilly & Associates, Sebastopol, CA. 2001.
Robert MacArthur, robmac@ag.Arizona.edu
Senior Systems Analyst, University of Arizona
Tucson, AZ
Matt Rahr, matt@ag.arizona.edu
Student, University of Arizona
Tucson, AZ