PPL is leveraging its Electric Facilities Database (EFD) to determine placement of protective devices in the field. In an effort to reduce the frequency of outages, PPL is using its ArcStorm and Oracle database along with transformer and customer databases to determine where to optimally place fuses in the field. PPL is utilizing upstream device information and downstream customer information to determine conductor spans which best qualify for additional protective devices. The process targets single-phase laterals with a high number of customers that lack an upstream fuse protecting a three-phase recloser or sectionalizer. This paper discusses the process developed at PPL to support this need.
In an effort to reduce the frequency of outages, PPL is using its ArcStorm and Oracle databases along with transformer and customer databases to determine where to optimally place fuses in the field. Pennsylvania Power and Light is an electric utility with a service area of about ten thousand square meiles, located in the eastern third of Pennsylvania. PPL has approximately 1.3 million customers.
In May of 1999 PPL completed data conversion for the entire service area. The EFD has 1,000,000 poles, 375,000 transformers, 146,000 switches, 60,000 fuses, 33,000 miles of distribution and 5,200 miles of transmission conductor. There are 84 concurent database editors and designers maintain the data on a daily basis. The current environment is ArcStorm and Oracle.
The spatial data in PPL's EFD is stored in an ArcStorm database. PPL's EFD is a production database accessed by over 80 editors at any given time. The spatial extent of the data is approximately the eastern third of Pennsylvania. In order to minimize the impact to PPL's production database updates, the spatial data is extracted from ArcStorm into a single coverage. All primary circuits and devices are extracted along with poles. Additionally, Oracle records associated with the extracted features are exported and translated into INFO. This process ensures access to the entire dataset for processing without impacting other users of the EFD.
Once the spatial and tabular data is extracted from the EFD, then network analysis can begin. Network analysis provides information about the arc-node connectivity within a dataset. The first step is to create a network turntable. A turntable contains information regarding the relationship between nodes and their connected arcs. The diagram below shows a standard turntable created from ELEC.AAT.
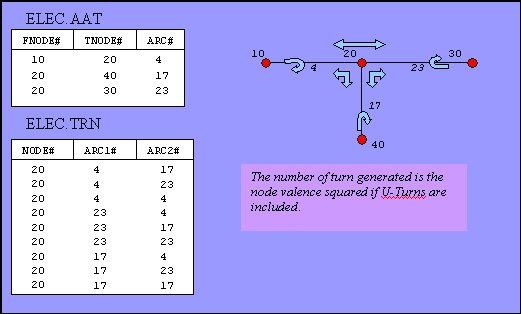
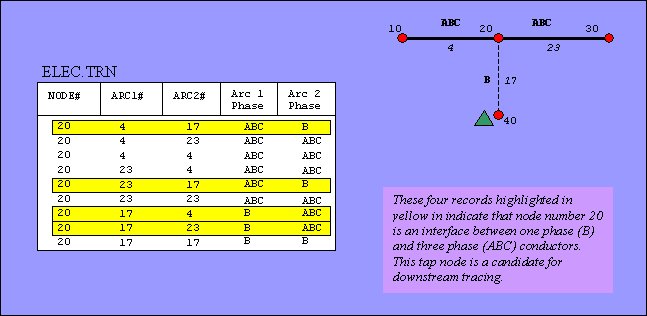
Arc attribution, such as, type and phasing, are joined onto the turntable. Node attribution, such as, related point type and node valence, are joined to the turntable. By joining information about the nodes and arcs onto the turntable, we can easily identify the locations where single and three phase circuits connect. These locations or nodes are called interface nodes. Interface nodes identify the location for downstream tracing.
In order to trace downstream from the interface nodes, all two and three phase primary circuits must be excluded from the trace. All protective devices, such as, reclosers, sectionalizers and fuses, must also be excluded from the trace.
A cursor is used to loop through each interface node to kick off the trace down the single-phase circuit or lateral. Laterals that are not protected by a fuse or other protective device will be traced, revealing candidate transformers. Each candidate transformer is correlated to an interface node identifier.
The supplying device of each candidate transformer is determined with the PPL table elec_supply.dat. The table originates in PPL's Power Delivery Management group and is used by PPL's Outage Management System. The table stores the unique identifier of each device as well as the unique identifier and device type of the upstream supplying device.
For each candidate transformer, if the upstream device is a fuse, then the lateral is protected. If the upstream device is a recloser, sectionalizer or feeder circuit breaker, then the lateral is unprotected.
In the event of an air brake switch or other normally closed switching device is the upstream device, then it is overlooked in order to find either a fuse, recloser, sectionalizer or feeder circuit breaker upstream from the candidate transformer. Customer Number The elec_supply.dat table also stores the number of customers fed by each device. This is critical information for analyzing candidate transformers. The transformers with the largest number of customers are prioritized for review by the operations unit. An example of the elec_supply.dat table is shown in the diagram below.
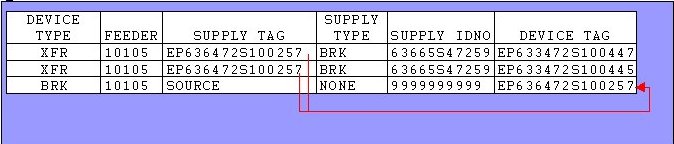
The third record is the supplying device for records 1 and 2.
A Microsoft Excel spreadsheet is the best method for reporting the transformers found on unprotected laterals. Each row in the spreadsheet is a transformer. The information attributed to each transformer includes but is not limited to type of transformer, number of customers, feeder, unique identifier, supplying device unique identifier and supplying device idno (a PPL assigned identifier). The number of effected customers is noted in order to help prioritize the device listing. The diagram below shows a sample report.
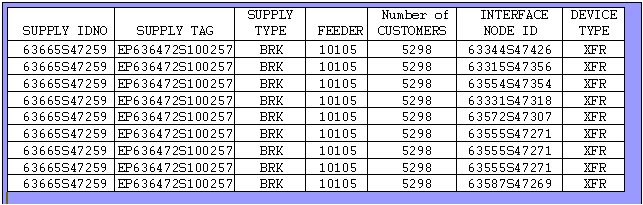
In this sample report, the feeder circuit breaker for feeder 10105 has nine transformers on seven different unprotected single-phase laterals. The INTERFACE NODE ID column notes the location of the interface pole where a potential fuse could be located.
PPL's Operations group uses this report, along with other information, to decide whether or not to add a protective fuse to a particular lateral. In some cases tree trimming may be a better alternative for preventing potential outages. Also, the report must be verified, as it may not reflect the data existing in the field. New facility development is always ahead of the EFD update cycle. Also, a data error may exist where a protective device is missing from the PPL EFD.
This project is unique in that it attempts to find locations of features that do not currently exist in the EFD. A prediction of feature locations is based on several types of spatial and tabular data processing. The program utilizes several modules of workstation ArcInfo and is controlled by Arc Macro Language (AML). The network turntable is created with the NETWORK module, and an INFO program adds the phasing information to create the enhanced network turntable. Downstream tracing uses Arcplot with the NETWORK trace command. An INFO cursor program is used to determine the upstream supplying device. The report output is managed by INFO.