Cal Poly Pomona is currently undertaking a project to develop a GIS-based system to determine the best runway orientation that controls the layout of airport facilities. This paper discusses the conceptual design and implementation of the system using ArcView and Avenue.The paper first investigates characteristics and patterns of wind data and FAA standards with regards to runway orientation. It then describes a GIS-based wind rose method that automates the determination of runway placement. The GIS-based wind rose method will significantly improve the current efforts of using "trial and error" and computation-intensive methods to determine runway alignment.
Determination of a runway orientation is a critical task in the planning and design of an airport.The direction of the runway controls the layout of the other airport facilities, such as passenger terminals, taxiways/apron configurations, circulation roads, and parking facilities.The current practice, which is recommended by the Federal Aviation Administration (FAA) and the International Civil Aviation Organization (ICAO), is to layout a runway in the direction of prevailing winds.In doing so, airport operations can allow aircraft to takeoff and land into the wind.According to FAA standards, runways should be oriented so that aircraft can takeoff and/or land at least 95 percent of the time without exceeding the allowable crosswinds (Wright 1998).
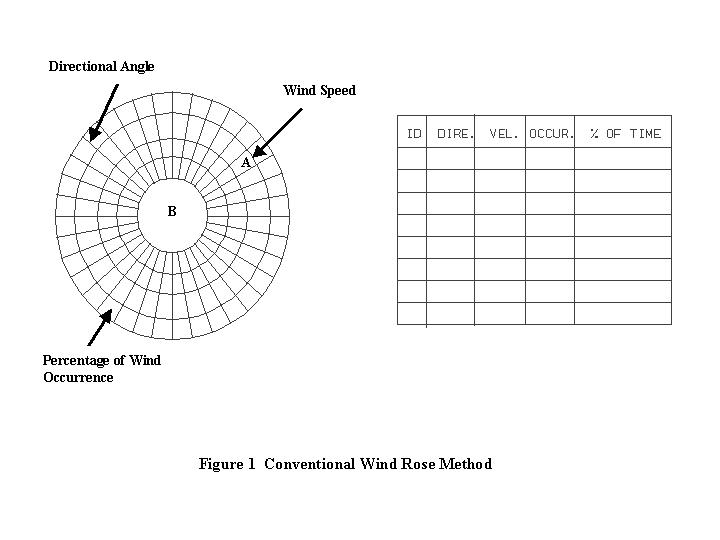
An approach often used in determining the runway orientation is called the wind rose method.The method uses a wind rose template to arrange velocity, direction, and frequency of wind occurrences within a certain period of time (normally 10 years or more). The wind rose template has a polar coordinate system that is made of circles and radial lines as shown in Figure 1. Circles on the template represent the wind speed, while the radial lines illustrate the angles or the wind blowing directions.Each cell bounded by two circle segments and two radial lines (see label A in the figure) stores the percentage of time that the winds correspond to a given direction and velocity range.The circle with label B in the figure represents the size of crosswinds the runway will experience during its operations. It is noted that wind data table and the wind rose template are not integrated dynamically in the current wind rose method.Wind occurrences and other information in the wind data table are pre-assigned to the wind rose template before the search for the optimal runway alignment is initiated.
On the wind rose a transparent runway template is placed to represent the proposed runway that accommodates the size and operating characteristics of aircraft.The template is rotated around the center of the wind rose in order to search for an optimal runway orientation. At each rotating angle, the total percentage of allowable crosswinds in the wind rose that are covered by the template is calculated, and a best angle that can give the maximum percentage of coverage is determined.
A challenging issue that makes the determination of the best runway alignment difficult is the partial coverage problem between the template and the wind rose. The partial coverage problem lies in the cases where the cells in the wind rose are partially covered by the runway template. In order to calculate the percentage of allowable winds in the partially covered cells, intensive geometric computations are needed.
There have been significant efforts undertaken to solve the partial coverage problem.A rudimentary practice was to use visual means to determine the percentage partially covered by the runway template. Clearly this approach is labor intensive and involves a “trial and error” process that cannot determine the optimal angle and alignment.The Federal Aviation Administration (FAA) developed a program as part of the Airport Design Software to help users determine the orientation of runways (FAA 1989).The program provides a spreadsheet template for the calculation of the percentage of wind coverage given inputs of wind data and runway direction specified by the user. The program is useful to automate the optimization process of runway orientation.However it does not consider the “partial coverage” issue and lacks graphical capabilities to allow users to determine the partial coverage and display the suitable alignment.
Recently Mousa and his colleagues have addressed the partial coverage issue by examining the geometric relationships between the runway template and the wind rose and solved the partial coverage problem by formulating a mathematical algorithm (Mousa 2000).The mathematical algorithm is proven to ensure an accurate procedure to calculate the optimal runway orientation. However, the method requires intensive geometric computations and is not flexible to different Airport Reference Codes (ARCs) that control the size of the runway templates.Additionally it does not have graphical capabilities to display the optimal wind coverage on the wind rose.
This paper presents a new method for the determination of airport runway orientation. The new method uses GIS technology and spatial database management tools to optimize the runway orientation based on given wind data and allowable crosswinds.The new method is then implemented into a system called Airport Runway Optimization (ARO).The ARO system significantly improves the current efforts of using “trial and error” and computation intensive methods for the optimization of runway orientation.
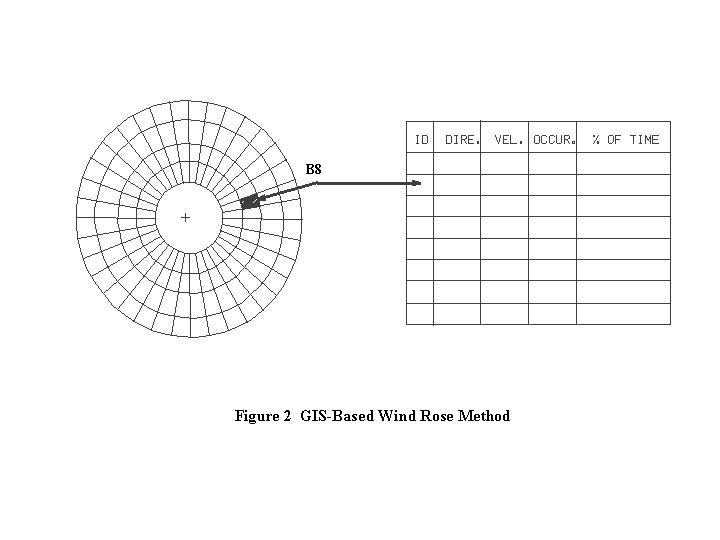
With the understanding of the limitations of the current wind rose method, this paper introduces a new type of wind rose method called the GIS-based wind rose method.The method defines a wind rose as a geographical representation of wind patterns (see Figure 2). It considers a wind rose as a GIS database (or a theme) in which each cell is handled as an independent polygon. A unique identifier is assigned to each polygon to represent the wind direction and wind speed range for the polygon. For example, the unique identifier of B8 in the shaded polygon indicates the wind speed range is 11–17 knots and the wind direction is 80 degrees in the polygon (see Figure 2)
The unique identifiers are critical to the GIS-based wind rose method because they are performed as interfaces to merge the GIS-based wind rose with wind data that are organized, stored, and managed in geo-relational databases. Figure 2 shows that the sectors or cells in the GIS-based wind rose are dynamically linked to a wind database.Each sector is joined with a record in the wind database. A record in the wind database contains the unique ID, wind direction, wind velocity, wind occurrence and percent of time within ten years.
Given the wind rose joined with the wind database, the GIS-based wind rose method defines a runway template as a spatial database (or a theme) and uses GIS spatial analysis functions to automate the optimization process of runway orientation. It places a runway template onto the GIS-based wind rose, rotates the runway template around the center of the wind rose, clip out for each rotating angle the sectors in the wind rose that are covered completely and partially by the runway template, and calculate the wind coverage of the clipped sectors. Additionally, the method keeps track of the results for each rotating angle and selects the best direction with the maximum wind coverage as the desirable runway orientation.
The GIS-based wind rose method takes advantages of GIS spatial analysis functions to deal with the partial coverage problem. By formulating the wind rose and runway templates as GIS themes, the new wind rose method avoids from intensive geometric computations involved in solving the partial coverage problem.
ARO SYSTEM
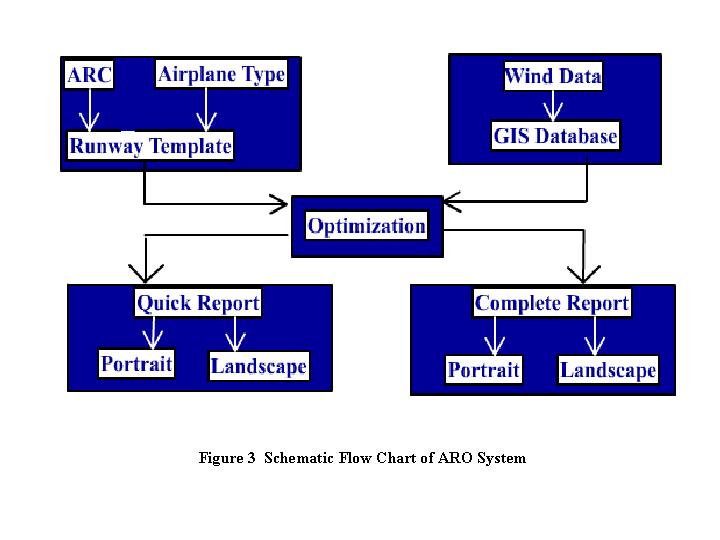
The GIS-based wind rose method is implemented in the ARO system. Figure 3 shows the conceptual framework of the ARO system. The ARO system contains four major modules.The first module is related to the selection of a runway template.The module supports the user to select a runway template based on the operational characteristics of aircraft or the airport reference code.The second module is the wind data management.This module provides users with a loading environment to allow a wind data file to be imported into the ARO system.The third module is the runway optimization.This module allows the user to choose the type of runway optimization processes and search for the optimal runway direction.The final module is the report.Two report options are available in this module for the user to print out the results.
ArcView GIS was chosen to implement the GIS-based wind rose method. There are a number of reasons for this selection.First, ArcView GIS is a very popular GIS software package widely used in transportation agencies.The ARO system developed in the ArcView GIS can be easily deployed in the transportation agencies. Second, ArcView GIS provides powerful spatial analysis tools such as overlay and clipping functions and database management facilities required by the wind rose method.Third, it has a powerful set of graphic capabilities that can allow airport designers to visualize the runway orientation in the optimization process.Fourth, it has a powerful scripting language Avenue that allows developers to customize the optimization process easily.
There are three phases required to determine an optimal runway orientation in the ARO system. The first phase is data input and validation check. In this phase a number of user-defined functions need to be executed to load and check the wind data and the runway type.Given the wind data and the runway type, the second phase starts the optimization functions and determines the optimal runway direction.Once the optimal runway direction is determined, the third phase generates reports that display the optimal runway direction.Detailed description of these three phases is discussed as follows:
User Interface of ARC System
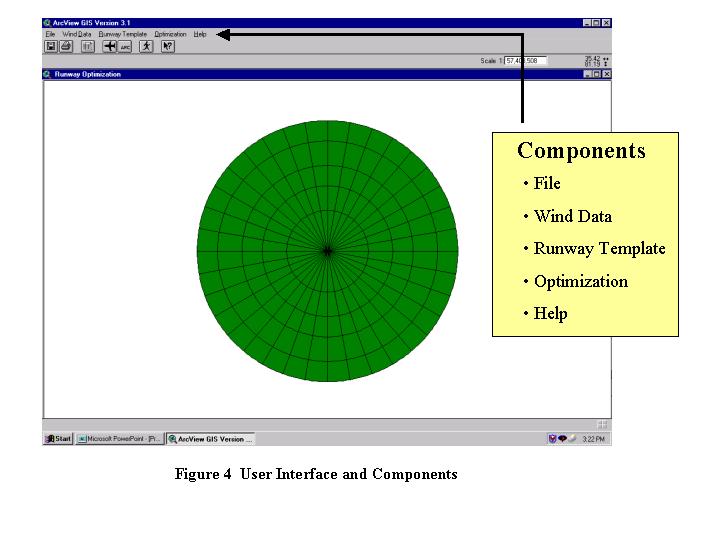
The user interface of the ARO system is shown in Figure 4.The first part of the user interface is the menu components.All the components, such as Runway Template, Wind Data, Optimization, Reports, and Help, are listed in the standard menu bar located at the top of the user interface.The second part of the interface is the wind rose template.The template has circles and radial lines to represent the wind speeds in knots and directions in angles.Before wind data are selected and loaded into the template, the polygons within the wind rose template do not have wind occurrences and percentages of time.
Importing Wind Data into the ARO System
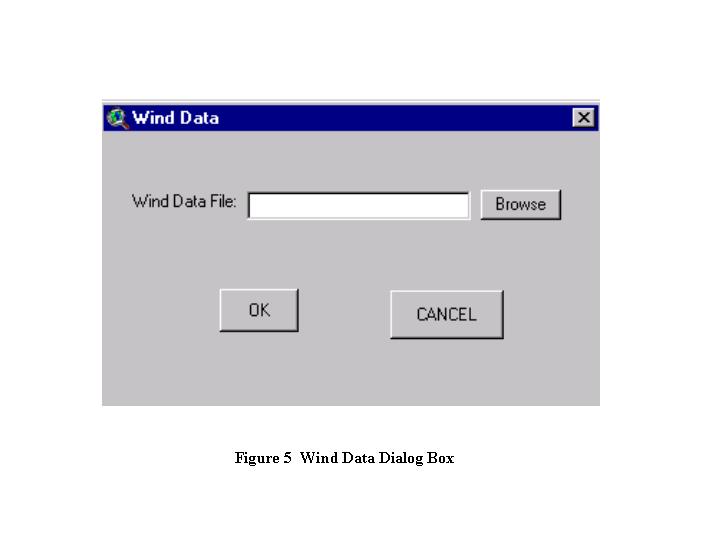
Wind data are vital to the GIS-based wind rose method because they provide the information about wind conditions in a selected area.Within the ARO system, the user is able to import specific wind data files by selecting the Wind Data menu at the top of the user interface, and clicking on the import option. The wind data dialog box appears to allow the user to import wind databases from outside of the ARO environment (see Figure 5). The ARO system then processes the data and loads them into the wind rose template.Each polygon within the wind rose is thus assigned with the wind occurrence and the percentage of time.
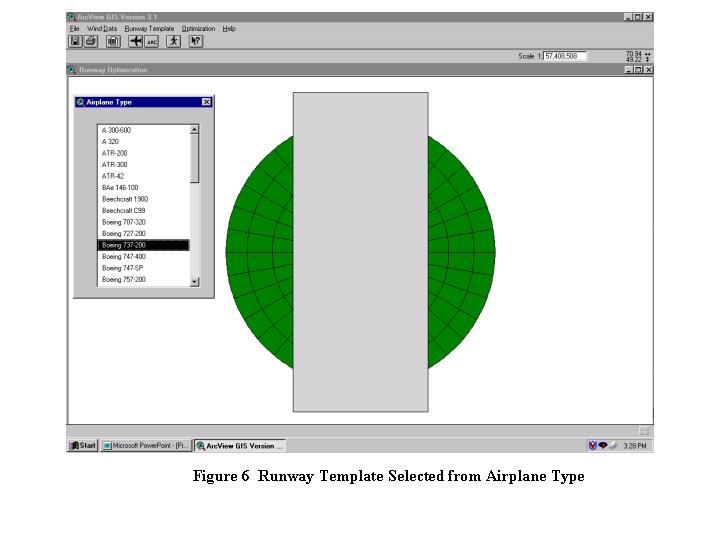
A runway type is needed for the determination of runway alignment because it controls which runway template should be used for the runway orientation. The ARO system allows users to select a runway type by specifying the design airplane type or the design airport reference code. For example, a Boeing 737-200 aircraft requires a runway that covers allowable crosswind speed of 16 knots.If a user selects Boeing 737-200 as the design airplane type, the ARO system will choose a runway template of 16 knots for later optimization of the runway direction.
There are four types
of runway templates available in the ARO system to cover allowable crosswind
speed of 10.5, 13, 16, and 20 knots. To select a runway template, the user
should select the Runway Type menu at the top of the user
interface and choose either item within the menu.Figure
6 shows the loading process to get the runway template for Boeing 737-200
into the ARO System.Figure
7 shows the process to load the runway template from a list of ARC
grouping numbers.
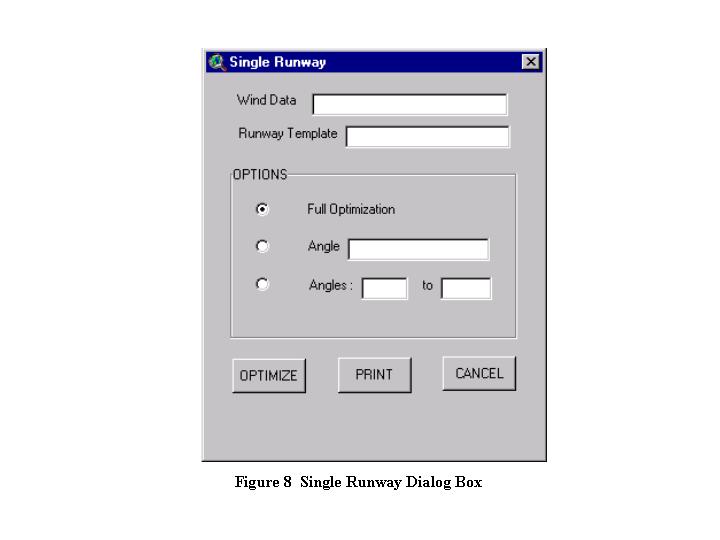
Once the wind data is loaded and the runway template is selected, the ARO system starts its search for the optimal runway orientation using the GIS-based wind rose method.At the execution phase, the ARO system rotates the runway template around the center of the wind rose and determines an optimal orientation for a runway. To start the optimization process, the user should select the Single Runway item in the Optimization menu in the menu bar.The single runway dialog box will appear with the currently selected input data (see Figure 8).The user has three options for optimization. The first option is “full optimization” which rotates the runway template 180 degrees around the center of the wind rose.The second option allows the user to key-in a specific angle to be optimized.The third option allows the user to define a search range.Figure 8 shows the third option with the search range from 10 to 80 degrees.
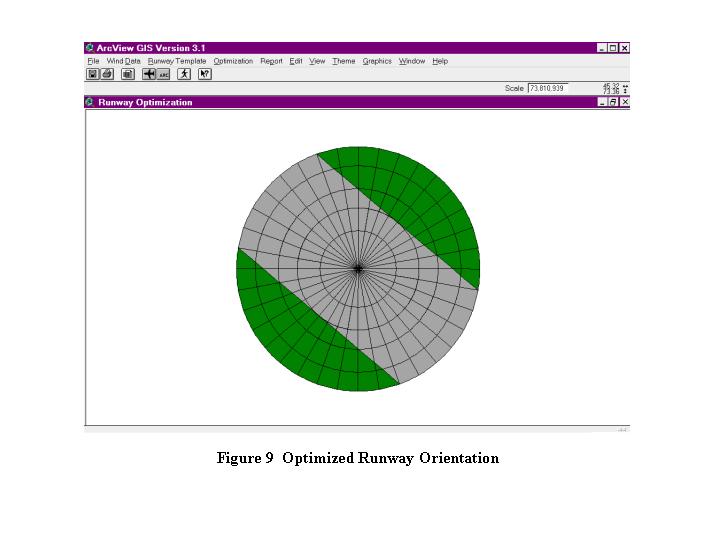
Once the Optimize button is clicked, the runway template rotates, the allowable crosswind coverage at each angle is calculated.When the final angle has been considered, the runway template returns to the angle with the maximum crosswind coverage.Figure 9 shows the optimal orientation given the data imported for an airport site.
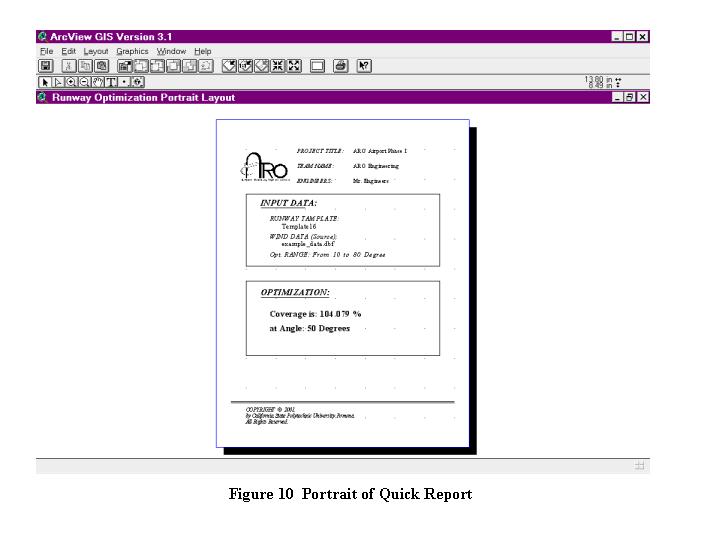
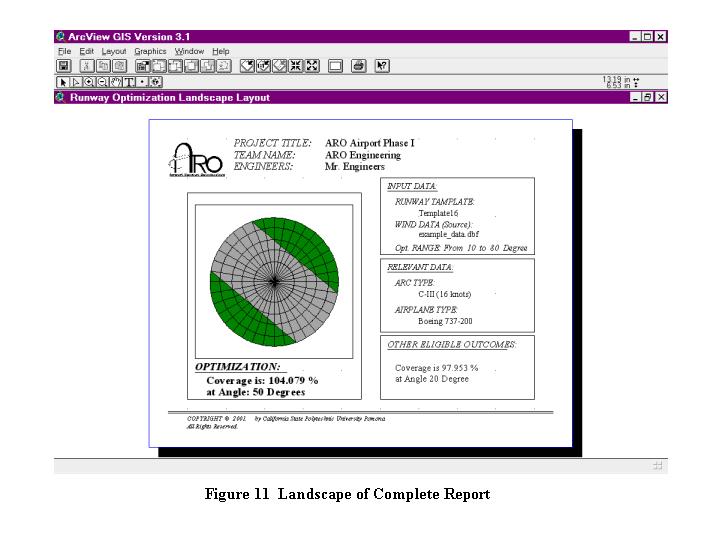
The ARO system allows the user to print the search results performed in the optimization process.The system provides two print functions: quick report and complete report. Both the functions can layout the results in landscape or portrait format. The quick report function provides the input data and the optimal runway orientation result.Figure 10 shows a quick report. The complete report function contains the information from the quick report plus the user interface in its final view and all the other eligible outcomes. Figure 11 shows a complete report.
This project presents a GIS-based wind rose method to determine the optimal orientation of a runway.This method is implemented into the ARO system in order to enhance the current wind rose method.The GIS-based method uses a set of user-defined GIS functions and the database management tools to successfully solve the partial coverage problem.The ARO system is proven to be effective and simple in calculating the optimal wind coverage and determining the best runway alignment.In addition, the ARO system has strong graphical capabilities to help users to visualize the true runway orientation.
Mousa, R.M. and Mumayiz, S.A. (2000).“Optimization of Runway Orientation,” Journal of Transportation Engineering, ASCE, Vol. 126, No. 3, 228-236.
Wright, P.H. and Ashford, N. (1998). Transportation Engineering: Planning and Design, 4th Ed., John Wiley & Sons, New York.
Department of Civil Engineering
California State Polytechnic University, Pomona
Pomona, CA 91768
Phone:
909-869-4312 Fax: 909-869-4342
Email:xjia@csupomona.edu, dfchung@hotmail.com, aljh88@earthlink.net, marco_petrilli@hotmail.com, litkat@aol.com