This paper presents the methods and technologies employed to share facilities management information across the web utilizing ArcIMS™ and Oracle® as the database. The presentation will describe how we are improving the distribution of facilities management information by utilizing a browser-based approach to access common information to satisfy a variety of uses. The web-based application in use today is a logical next step to facilitate dissemination of critical facilities information while assuring data integrity through implementation of controlled accessibility to various user groups.
CONTENTS
INTRODUCTION
DEFINING REQUIREMENTS FOR AN INTERNET GIS
THE DATA
THE LOAD
SYSTEM ARCHITECTURE
THE MAP SERVER
THE WEB SERVER
THE DATABASE
THE MIDDLE TIER
THE SECURITY SCHEMA
THE CLIENT
THE WEB DESIGN
NAVIGATING SITES, FACILITIES, AND floor planS
THE STANDARD GIS TOOLSET
THE CUSTOM GIS TOOLSET DATA
DATA MAINTENANCE
LESSONS LEARNED
CONCLUSIONS
AUTHOR INFORMATION
Facilities management Questions for military master planning:
What facilities and rooms do I have?
Who is in them?
What are they using them for?
Does this meet requirements (i.e. space utilization regulations)?
These are some of the questions Colorado DataScapes considered in determining the technological requirements and solutions for this project. Colorado DataScapes provides a variety of programming solutions to meet the enterprise needs of our clients. In this case, Nakata Planning Group, LLC contracted with Colorado DataScapes to provide the answers.
Nakata Planning Group, LLC provides military master planning services to numerous commands in both the Army and Air Force. Master planning services often include highly detailed (room level) compilations of facility occupancy data and room use data. Additionally, new facility surveys are performed, and drawings are created, replacing antiquated drawings (some up to 50 years old).The analytical demands of master planning spawned the development a PC-based database application for in-house use by planners: A highly customized Microsoft® Access database. This application was found to have such potential benefit to the master planning clients that it was developed further into a deliverable product: VISION 2000™ Facility Tracking System.
The need for a support application for providing accurate and detailed installation and floor plan drawings (each linked to VISION 2000™ Facility Tracking System via ODBC) emerged. VISION 2000™ GIS - Desktop was created with ArcView® GIS. Developed with highly customized features specific to facilities management planning and analysis, this application pushed ArcView® GIS development to it's limits. Custom scripting, dialogs, ArcView® GIS extensions, and real time database connectivity combined to create a unique problem-solving tool in the master planning arena.
For the first time, master planning clients are able to analyze composite data about their facility usage from a spectrum of sources (photographs, requirements, drawings, and surveys) on their desktops. Queries, reports, drawings, and displays are tailored to the specific demands of Facilities Management.
Master planning clients from the command level on down are finding utility with these applications. installation commanders, unit commanders, base civil engineers, facility managers, contracting officers, and real property officers recognize the potential - decision making based on logically presented, accurate, and current data.
How does one distribute the data broadly - ensuring accuracy, maintainability, and security? The web.
DEFINING REQUIREMENTS FOR AN INTERNET GIS
The U.S. Air Force Reserve Command (AFRC) contracted with Nakata Planning Group to perform facility utilization surveys for 16 installations. Drawings would be created, survey data would be inserted in a central database, and all data would be made available across the command via a website. Site and floor plan perspectives would be shown in the GIS. The website would support all custom analysis functions available on the desktop version.
Colorado DataScapes was contracted to provide technical services to include system architecture, database design, web development, system deployment, and end-user training.
Data include AutoCAD® drawings for installations and floor plans and their corresponding shapefiles. Facility and room polygons include a foreign key attribute for linking database information. Survey data for each required facility and room are stored in a database. Photographs are archived on a network hard drive.
The client projected over 100 total users for the system. Up to 20 concurrent users might access a single page/process. Scalable architecture supports even broader usage.
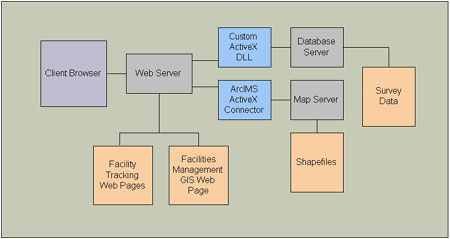
Figure 1 shows a block diagram of the system architecture. Requests for web pages are made via http to the web server. The web server processes ASP web pages, which retrieve images and data via the appropriate middleware DLLs. The fully processed page is then served as HTML/JavaScript™.
Figure 1: System Architecture Block Diagram
The total facility utilization surveys for AFRC includes facilities from 16 sites around the United States. The potential number of sites and floor plans required an enterprise-scaled internet map server. Additionally, the map server would have to accommodate the data sources (shapefiles), digitizing processes, and maintenance processes already in place for the legacy desktop application. Despite it's beta release status at the time, ArcIMS™ 3.0 was chosen as the map server. An added advantage was the availability of the ArcIMS™ ActiveX® Connector - our shop is strong in ASP and Microsoft® Visual Basic® 6 talent.
Microsoft® IIS was chosen as the web server to support an ASP client tier.
Oracle8i™ was selected by AFRC as their database of choice.
Access to the facility survey data is via a custom ActiveX® DLL. Registered on the web server under Microsoft® Transaction Server, the custom DLL allows us data access from the web via ASP. This architecture has several advantages. All process-intensive code is embedded in the DLL, which is compiled and not interpreted. In addition, the maintenance effort on the ASP pages is reduced - changes to the actual methods in the DLL did not impact the existing web page structure. SQL development and testing was accelerated by using a very simple Microsoft® Visual Basic® 6 front end to the custom DLL - essentially isolating the SQL development and testing process from web server configuration issues, the map server learning curve, and much of the HTML/JavaScript™ coding.
Security is implemented at three levels for access to this web application. First, encryption is implemented with SSL/PKI. Second, the web server is deployed on the AFRC domain behind their existing firewall. Third, access and permissions are determined at a user level based on password authentication to the database through the custom DLL. Three types of access can be granted to a user: read-only, read-write, and administrator privileges. Access is granted on a site-by-site basis. For example, of the 16 sites available, a user might have read-only access to most, but read-write permissions for their particular location
AFRC requires all users to utilize Microsoft® Internet Explorer 5.0+ as a browser. This sidestepped a number of potential browser compatibility issues. Additionally, they requested a web design to simply accommodate screen resolution of 800x600 or greater. Because of large variance in the capabilities of the individual user machines and the restricted ability of users to install new applications, a 'thin' client emerged as the favored web design - no applets, no plug-ins, no downloads. All web pages are ASP/ HTML/JavaScript™.
The product evolved from two discrete applications with a common data source. The client preferred to continue with both interfaces: a database management interface and a GIS viewer interface. The database management interface provides for adding, deleting, updating, and querying the facility survey data. Reports on facility survey data can be generated. Permissions are also maintained via this interface. The GIS viewer integrates spatial data with the facility survey data. Display and querying of facility survey data is supported. No data editing tools are provided from the GIS viewer interface. Figure 2 below shows an overview of the broad functions of each interface.
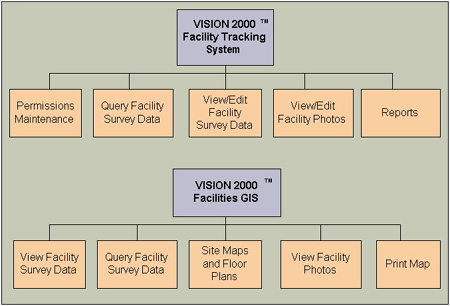
Figure 2: Web Client Functions Block Diagram
Two issues led us to frames based interface design. First, the database management interface would require displaying large data sets as tabular output. Row and column names ideally should remain stationary throughout user scrolling. Second, the site maps and floor plans of the GIS viewer interface should dominate the display, while navigation, analysis tools, and data output remain secondary. Frames allow logical partitioning of each discrete interface element. Figures 3 and 4 show the client interfaces.
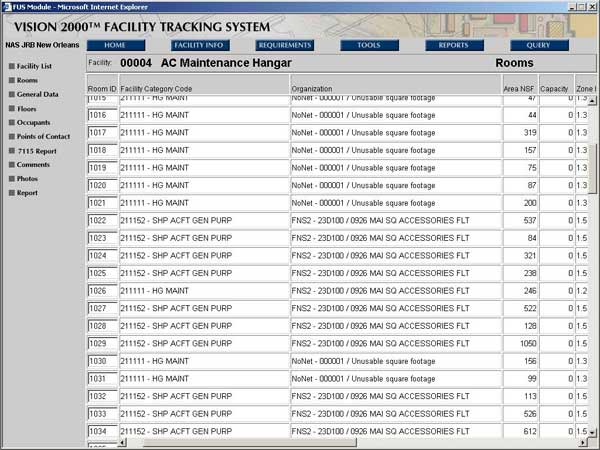
Figure 3: VISION 2000™ Facility Tracking System Client Interface
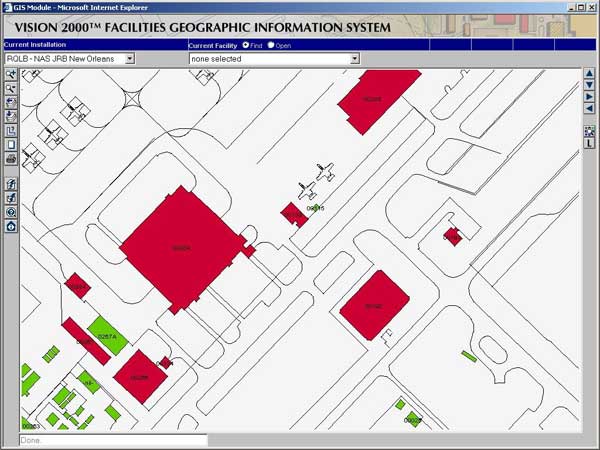
Figure 4: VISION 2000™ Facilities Management GIS Client Interface
Another web design choice that was broadly implemented was the use of additional browser instances. Especially in the GIS viewer interface, data display and user input are shown in new browser instances. Output from multiple tools can be simultaneously displayed. For example, query results, a facility photo, and ID results can each be obtained without overwriting the same display space. Also, real estate on the original browser is conserved for the map image. No large frames with tabular data limit the map display size. Figure 5 shows multiple browsers containing the output from discrete tools.
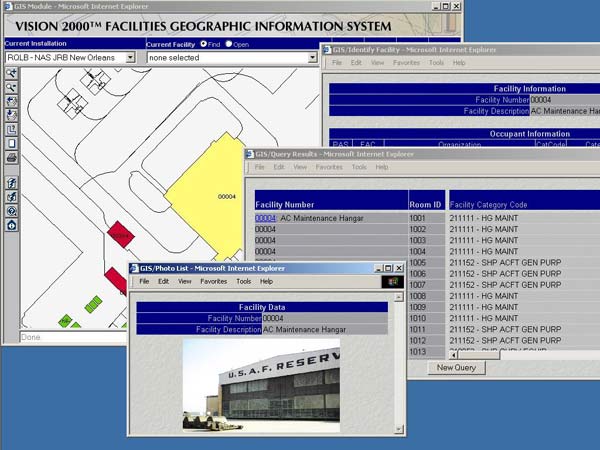
Figure 5: Multiple Browser Instances Showing Diverse Data for the Selected Facility (in yellow). (Note the rear-most browser showing the Facilities Management GIS main interface.)
NAVIGATING SITES, FACILITIES, AND FLOOR PLANS
Two spatial perspectives on the data are supported: 1) At the site level, an installation-wide base map is displayed. 2) At the facility level, the floor plan drawing of an individual facility is displayed. The available toolset and the tool functions are tailored to operate differently at the site and facility levels. The navigation control is in the top frame. A set of drop down lists allows the user to change the current installation, current facility, and current floor. The site selection drop-down list displays all allowed installations for the current user. Selecting a new current installation displays that installation's site map as the map image contents. Additionally, the current facility drop-down is re-populated with the new installation's facilities list. See Figure 6.
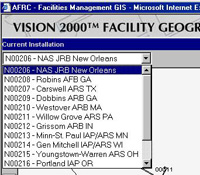
Figure 6: Site Selection Drop Down List
The facility drop-down list displays all facilities of the current installation. The 'Find' option (only available at the site level) selects, centers, and zooms in to the selected facility on the map image. The 'Open' option causes the selected facility's first floor drawing to display as the map image contents. Also, the left toolbar and the navigation bar reload for the facility level. See Figure 7.
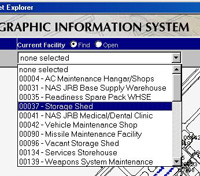
Figure 7: Facility Selection Drop Down List
The floor plan drop-down list displays all floors of the current facility. Selecting a new floor displays that floor's floorplan drawing as the map image contents and sets the floor area data fields in the navigation bar. See Figure 8.
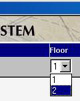
Figure 8: Floor Plan Selection Drop Down List
Familiar Zoom, Pan, Full Extent, Previous Extent, and Measure operations are supported for both the site and floor plan displays. No layer management functions were developed due to the narrow scope of the spatial data being shown.
A few of the more crucial custom tools implemented for this project are discussed.
Hotlink: Navigation between sites and floor plans is eased by using the Hotlink tool. At the site level, a point-and-click to a facility polygon opens the floor plan for that facility as the map image. At the floor plan level, simply clicking the tool opens the site parent of the facility as the map image.
Site Level ID: A point-and-click to a facility polygon displays occupant data, square footage figures, and survey comments for that facility. A separate browser instance displays the result. See Figure 9.
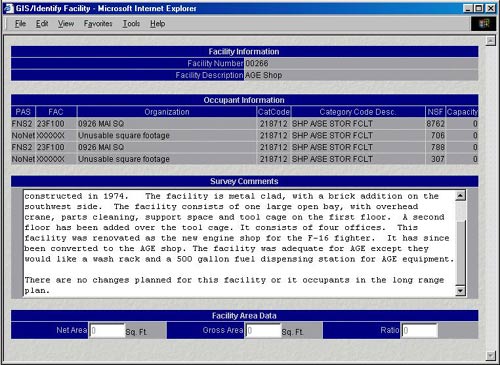
Figure 9: Site Level ID Results
Floor Plan Level ID: A point-and-click to a room polygon displays that room's occupant data and square footage figures. A separate browser instance displays the result. See Figure 10.
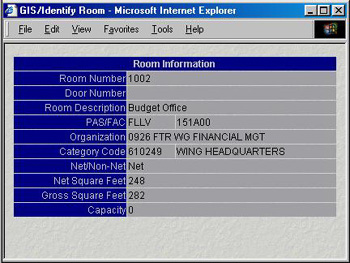
Figure 10: Floor Plan Level ID Results
Photo List/View Photo: A list of all available photos of a given facility can be displayed two ways. At the site level, a point-and-click to a facility polygon shows the list in a new browser instance. At the floor plan level, simply clicking the tool displays the list. See Figure 11. The list shows the photo title and a link to display that photo. A click to the link displays the photo in a new browser instance. See Figure 12.
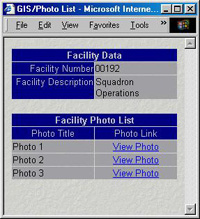
Figure 11: Photo List
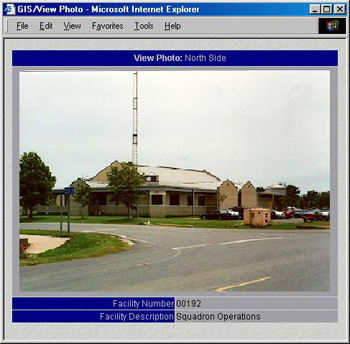
Figure 12: View Photo
Query Rooms/Zones: For analysis purposes, a zone is defined as a unique combination of user and use for a room. For example, if two rooms on the same floor in the same facility are occupied by the same organization and each of those rooms have been assigned the same Category Code (AFRC's 'use' code), then they are in the same zone. Each of the following query tools are subtly different, but return results for either rooms or zones.
Site Level Query: A query is filtered on a number of set criteria. The user can enter criteria values for none, some, or all of the criteria. See Figure 13. The query returns all rooms or zones (depending on user input) rolled up by facility and displayed in tabular format in a new browser instance. See Figure 14. The GIS display selects and zooms in to all facilities containing rooms/zones that meet the query criteria. See Figure 15. Note that in Figure 14, facility numbers are displayed as links. Clicking a link will select and zoom into that particular facility polygon.
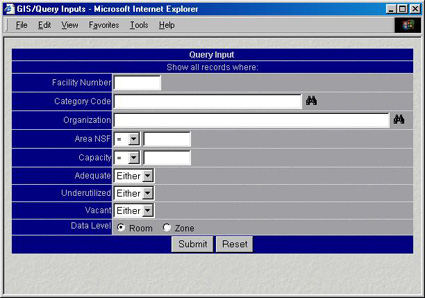
Figure 13: The Site Level Query Input Form
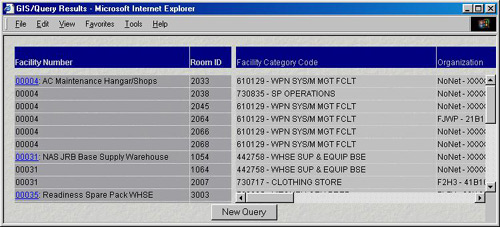
Figure 14: Site Level Tabular Query Results
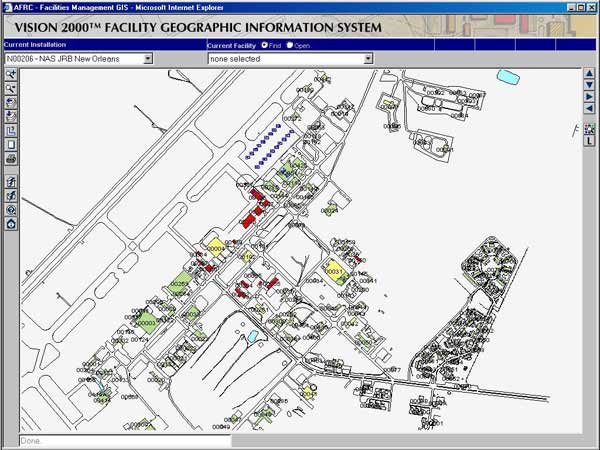
Figure 15: The GIS Interface Showing All Facility Features Meeting Query Criteria (shown in yellow)
Floor Plan Level Query: As in the site level query, the query is filtered on a number of set criteria. The user can enter criteria values for none, some, or all of the criteria. However, an additional criterion is available. A radio button choice This Floor/Entire Facility limits the query results to the current floor. See Figure 16. The query returns all rooms or zones (depending on user input) displayed in tabular format in a new browser instance. See Figure 17. The GIS display selects and zooms in to all rooms/zones that meet the query criteria. A 'Room' query results are shown in Figure 17. Room numbers are displayed as links. Clicking a link will select and zoom into that particular room polygon. This is also supported for a zone query.
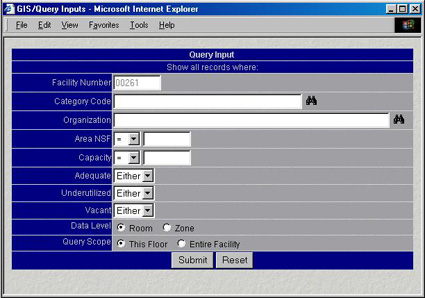
Figure 16: Floor Plan Level Query Input Form
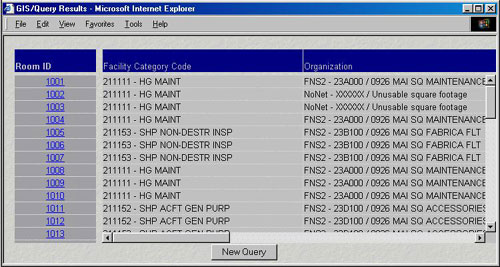
Figure 17: Floor Plan Level Tabular Query Results
Dynamic Labeling:A 'Room Tag' consists of the Room Number, Room Description, Zone ID for the room, and Net Square Feet of the room. At the floor plan level, room tag text is built on-the-fly by accessing the facility survey data for each room. In this way, the room tag values are completely current with the facility survey data. See Figure 18. Room tags are autoscaled.
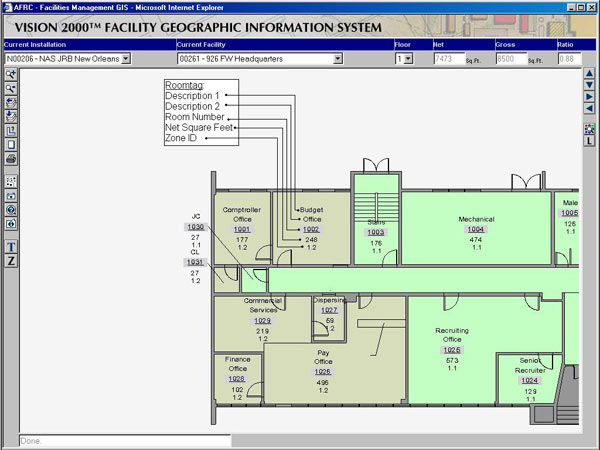
Figure 18: Room Tag Elements Labeled
Dynamic Symbology: One of the most useful custom features is the 'Zone Colors' tool. The use and user combination for a room is effectively communicated by coloring the room polygon based on the room's Zone ID from the facility survey data. This is a lot more complex than it sounds, because the renderer objects in the map service AXL are designed to perform unique value symbolization based on an attribute field of the shapefile data source. We developed a method by which the polygons' fill colors are determined by the Zone ID value from the database. As with the room tags, the zone colors are current and dynamic to the database. See Figure 19 for a floor plan showing zone colors. See Figure 20 for the dynamically generated zone color legend.
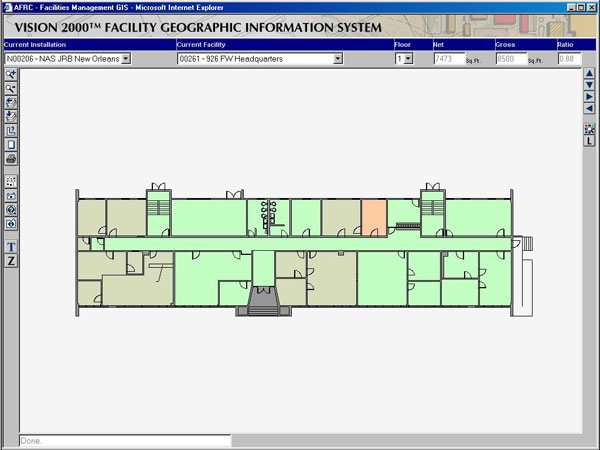
Figure 19: floor plan Showing Dynamic Zone Colors
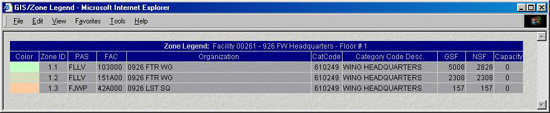
Figure 20: Dynamically Built Zone Color Legend
Plots: The Print tool formats the map pixel dimensions for 8-1/2 x 11. The sized image is displayed in a new browser instance, along with user-entered title and comments. Figure 21 shows the printable map page.
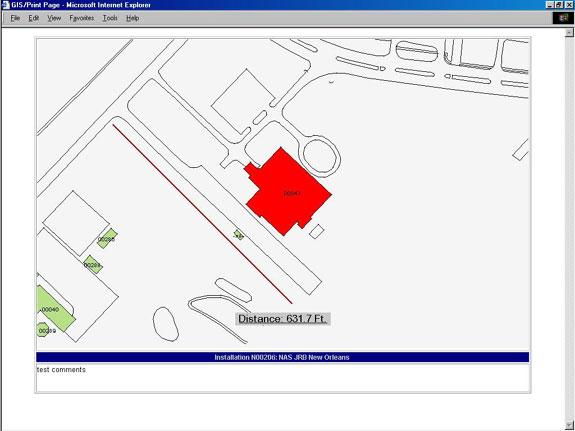
Figure 21: The Sized and Formatted Printable Map Page
Maintenance for the facility survey data, AutoCAD® drawings, and shapefiles is policy-and-procedure driven, not automated. After final delivery, AFRC is responsible for maintenance. Facility survey data is updated via the database management interface. Any user with write permissions to a particular site can edit that site's facility and room data. Various command-wide data sets are used throughout the application. These can be edited by any user with administrator privileges. A new facility, or a physical change to a previously surveyed facility (i.e. a room is eliminated by removing a wall) require corresponding updates to the AutoCAD® files and shapefiles for that facility. This maintenance process is primarily performed by AFRC civil engineering personnel. Custom data conversion tools are available on the desktop application.
Synchronizing Frames and Windows Synchronizing the contents of five frames and multiple browser instances demanded a formidable JavaScript™ effort. Client-side control of page loading sequence and application enabling and disabling functions was implemented. The next version is limited to two frames: a navigation/toolbar frame (which is only loaded once) and the map display frame.
Developing with ArcIMS™ Under Beta/ AXL Workarounds Developing under beta is always a big risk. We faced a lot of hurdles with map manipulation because the ArcIMS™ ActiveX® Connector was not fully developed and the available documentation was sparse. Fortunately, the methods to send and receive AXL strings were functional and exposed. We leveraged this functionality and wrote ASP functions to build AXL requests and interpret AXL responses. Our development process wasn't stonewalled by the beta limitations of ArcIMS™. When final release was available, we simply replaced the ASP function calls with the appropriate ActiveX® Connector methods. Fundamentally, the ArcIMS™ ActiveX® DLL is an AXL parser. This understanding enlightened us to the process of viewing returned AXL strings to gain insight into AXL syntax for both building and manipulating map services.
Transactions and Batch Updates With the database management interface, our original intention was to implement recordset updates transactionally, using MTS. This approach was fundamentally flawed. From a client perspective: a user edits many room records for a particular facility, when edits are saved, one of the edits violates a table constraint. All valid records should still be written to the database - the write operation for the 'invalid' record should be trapped and prevented, and the user notified of the identity of the 'invalid' record and the nature of the error. This, of course, isn't easily implemented if the operation tries to update the entire recordset transactionally. We redesigned the update operations in the custom DLL to allow for a more effective and appropriate process. ASP modifications followed. Rigorous analysis from the user perspective can save a lot of 'do-overs'.
This project demonstrates effective and secure distribution of facilities management data to a broad user base - integrating custom internet mapping.
Migrating a
custom GIS application designed for the desktop to the web presented numerous
architecture, design, and implementation issues. Certainly there were false
starts in many of the implementation details - web programming offers it's own
set of challenges and limitations. This application meets or exceeds each of the
functional and interface goals defined by Air Force Reserve Command. Future
projects will rely on the lessons gained from this project.
Colorado DataScapes is presently under contract to Nakata Planning Group to provide the next version of this application for the US Army Reserve Command (USARC). Substantial improvements and new functionality are forthcoming in this latest version. More sophisticated zoom and pan tools will be incorporated. Layer management functionality is being developed to allow inclusion of more diverse spatial data layers. For example, a layer showing proposed facilities (as opposed to existing facilities), or environmental layers could be integrated.
A challenging but powerful architecture allowing selective access to facilities data from a variety of external databases is being developed. A great deal of data access functionality is being migrated from the middle tier to the data tier via the use of stored procedures referencing linked servers. The client implementation is also being refined - Cascading Style Sheets will be implemented for reduced maintenance, and much of the client ASP and JavaScript™ functionality will be metadata driven.
A broader requirement is including another level of detail for the GIS. Currently, site and floor plan views are supported. USARC requires another view, the Regional Support Command (RSC) view, reflecting the next level upwards in their command hierarchy. Thus the hierarchy of views would be RSC as a parent of sites, which are parents of floor plans.
It's not much of a stretch to see that in upcoming development, a generic implementation of parent and child 'views' would result in an application suitable for a wide range of organizations with differing hierarchical structures.
Generic view hierarchy, intelligent layer management, selective access to multiple data sources, and custom analysis tools: A combination of functionality for leading edge facilities management capabilities. GIS technology has matured - any data with a spatial componant can be displayed in intelligent and communicative ways. Data can not only be displayed, but available technologies enable wide, secure distribution. facilities management is only one narrow discipline where GIS analysis and problem-solving technologies contribute.
NOTE: No portion of this paper is affiliated with, nor endorsed by, any element of the US Government including but not limited to the US Air Force Reserve Command or the US Army Reserve Command.
|
Joseph M. Pfeffer GIS Web Programmer Colorado DataScapes, LLC 719.328.1111 jpfeffer@coloradodatascapes.com |
 www.coloradodatascapes.com |