Mathematical Modeling of Toxics Fate, Transport and Bioaccumulation using GIS
Ferdi Hellweger, Kevin Farley, Darin Damiani and Paul Anid
Presented at the 2001 Esri International User Conference
San Diego, CA, July 10, 2001
ABSTRACT
A toxic chemical fate, transport and bioaccumulation modeling system was developed by linking EPA's WASTOX FORTRAN code to ArcView. The system, called GISTOX, is fully compatible with EPA's BASINS database. River reach information, water quality data and point source loads are automatically extracted from the database. The system supports solids sorption, volatilization, biodegradation and hydrolysis fate processes. The present version of the system is restricted to steady state transport in one dimension. The bioaccumulation part of the model is set up using a preset food web structure consisting of benthic invertebrate, phytoplankton, zooplankton, small fish and large fish.
OVERVIEW OF BASINS

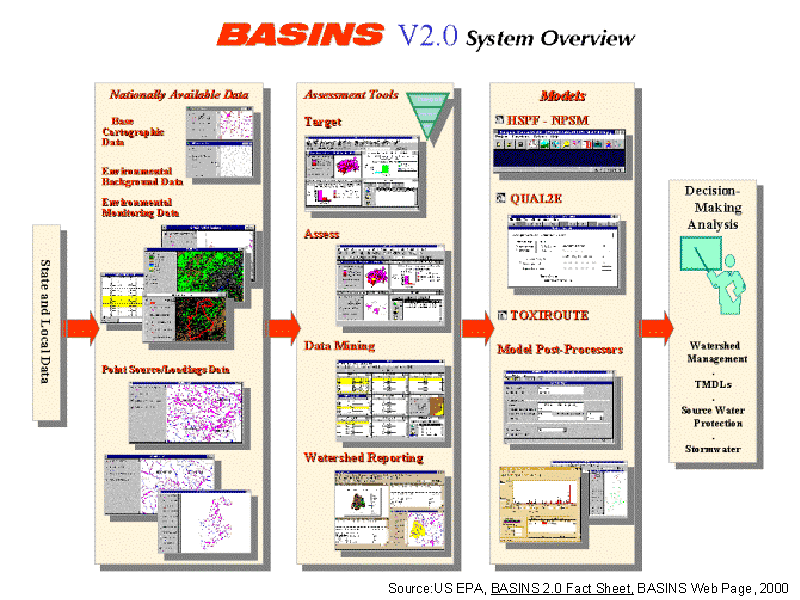
Figure 1. The motivation for this project was EPA's BASINS system. BASINS is a water quality modeling tool for the development of Total Maximum Daily Loads (TMDLs). The system consists of three main parts: (1) national databases, (2) assessment tools and (3) models. The national databases contain data related to water quality (e.g. NPDES discharge locations). The assessment tools are customized utilities for analyzing and displaying the data (e.g. create a map illustrating the Copper discharges to the watershed). Three models are included: HSPF, QUAL2E and TOXIROUTE [Graphic Source: US EPA, BASINS 2.0 Fact Sheet, BASINS Web Page, 2000].
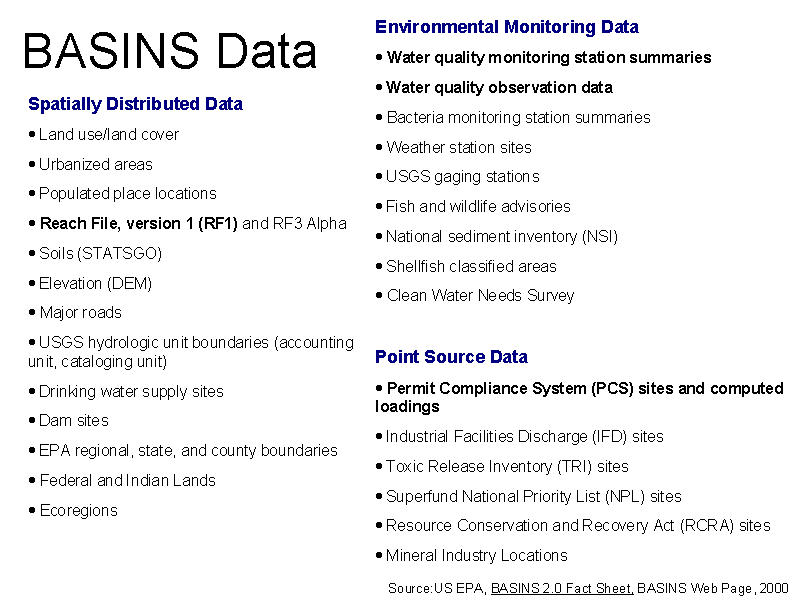
Figure 2. BASINS contains a large collection of databases. The data layers used in this project are highlighted bold. They are the Reach File Version 1 (RF1), water quality summaries and observations and the Permit Compliance System (PCS).
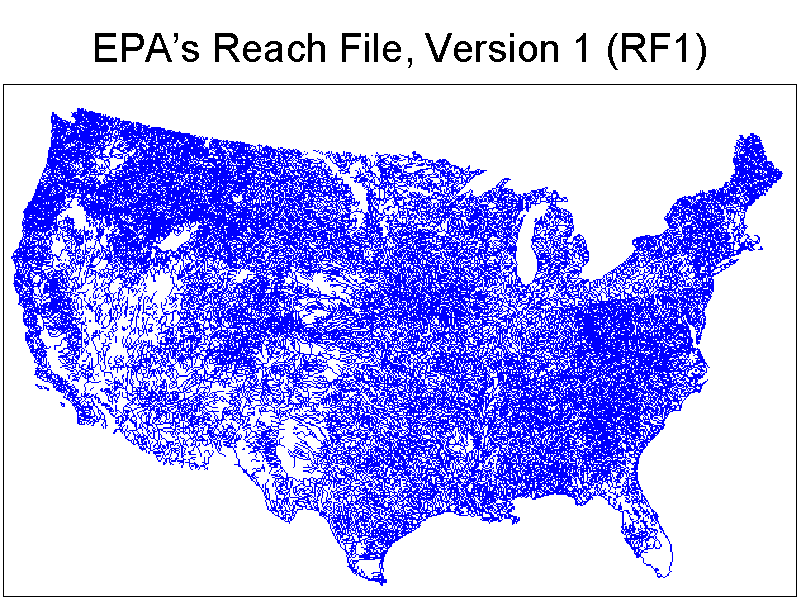
Figure 3. RF1 covers the coterminous US. The geographic shapes were taken from 1:500K scale NOAA charts. Most rivers are presented using a single line.
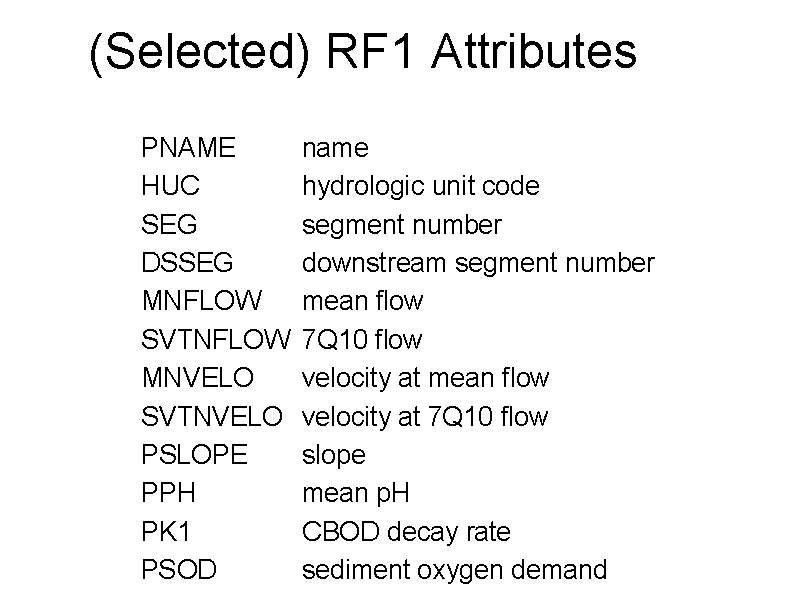
Figure 4. RF1 reaches have attributes related to water quality. Each reach has a segment number and the downstream segment number is given. This way connectivity can be established based on the attributes. Average flow and 7Q10 low flow rates and velocities are also provided.
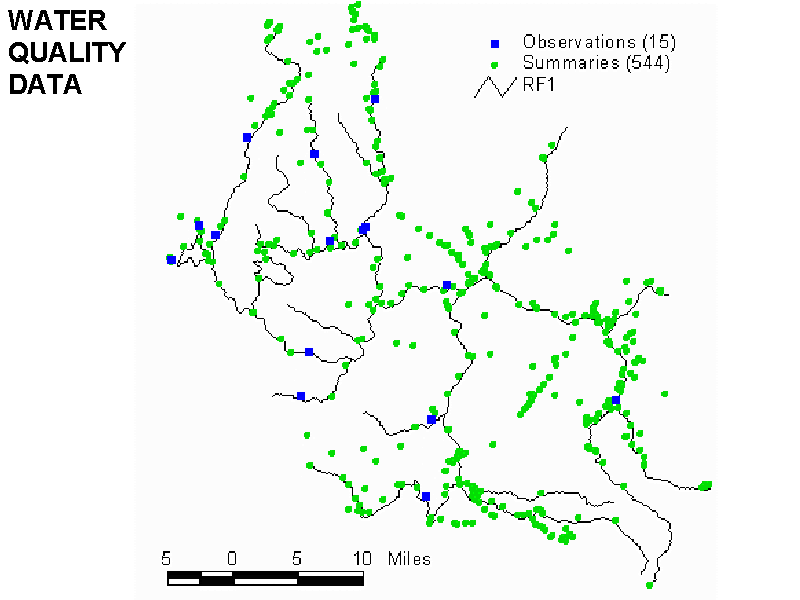
Figure 5. There are two water quality databases in BASINS. Both are subsets of the STORET system. The 'summaries' database contains data summaries (e.g. median, 95th percentile of the TSS concentration) for all stations. The 'observations' database contains actual data for some stations.
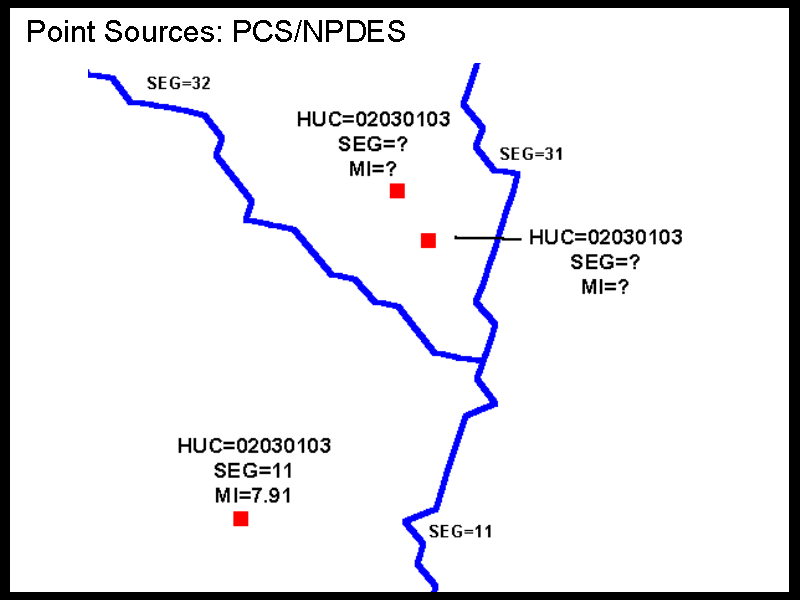
Figure 6. The PCS database contains locations of NPDES discharges. For many discharges the link to RF1 can be established via attributes. Loads of various chemicals, calculated based on discharge monitoring reports (DMR), are also included in the database.
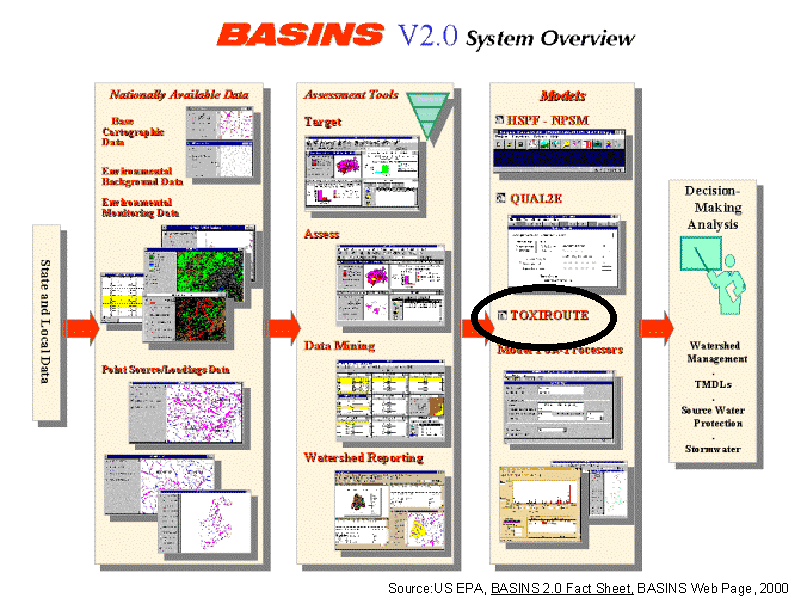
Figure 7. The TOXIROUTE model is a simple one-dimensional, steady state model. Only a first-order decay process can be modeled in TOXIROUTE. However, many other processes, such as solids sorption or volatilization, can be important in the fate and transport of toxic chemicals. TOXIROUTE only has a water column segment. In many situations the chemical mass is mainly in the sediment bed. TOXIROUTE only computes chemical mass in the water. Often the media of interest is biota, because that represents the most important exposure route for humans (e.g. eating fish).
GISTOX MODEL
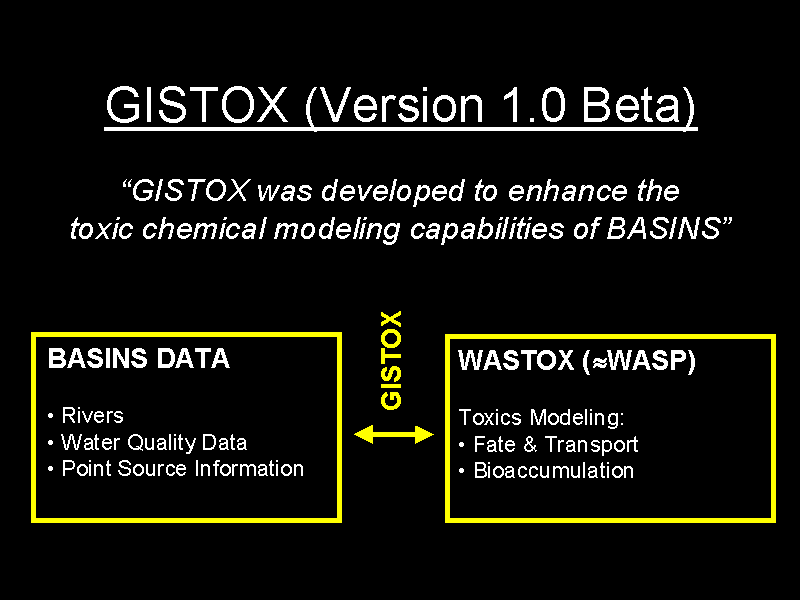
Figure 8. The shortcomings of BASINS in terms of toxic chemical modeling motivated the development of GISTOX. GISTOX is a link between the BASINS database and WASTOX. WASTOX is a sophisticated toxic chemical fate, transport and bioaccumulation model developed at Manhattan College for the EPA. The fate and transport part of WASTOX is now included in EPA's WASP modeling system.
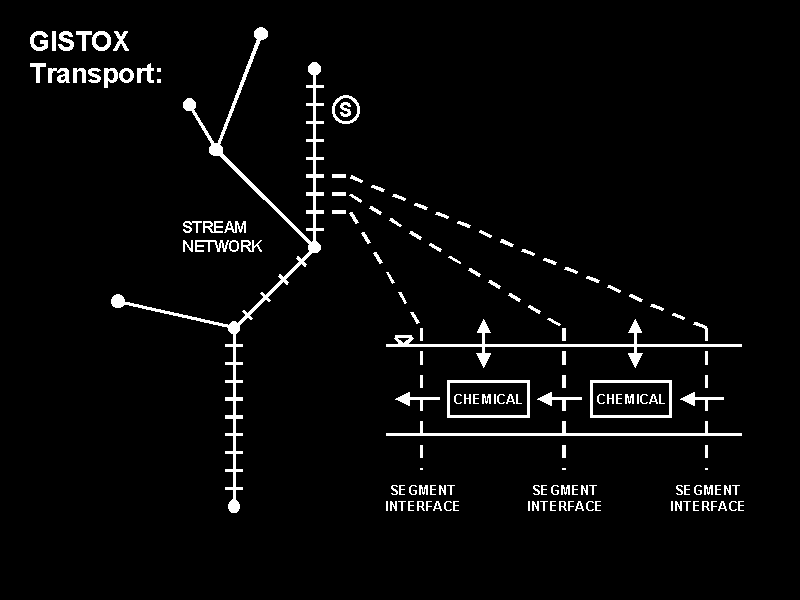
Figure 9. In GISTOX transport is one-dimensional. Junctions are supported. Each RF1 reach is divided into mass balance segments based on a user specified length.
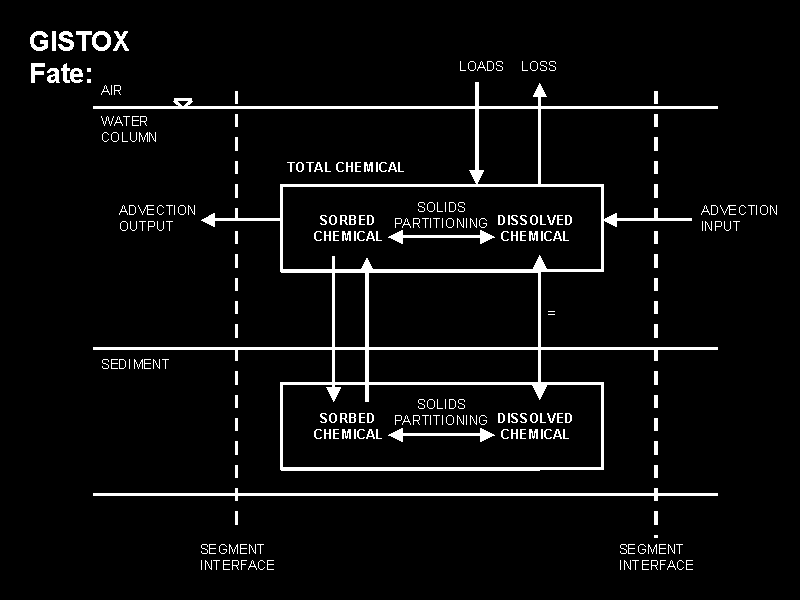
Figure 10. Each mass balance segment contains two layers (water column and sediment bed). The chemical partitions between the sorbed and dissolved phases.
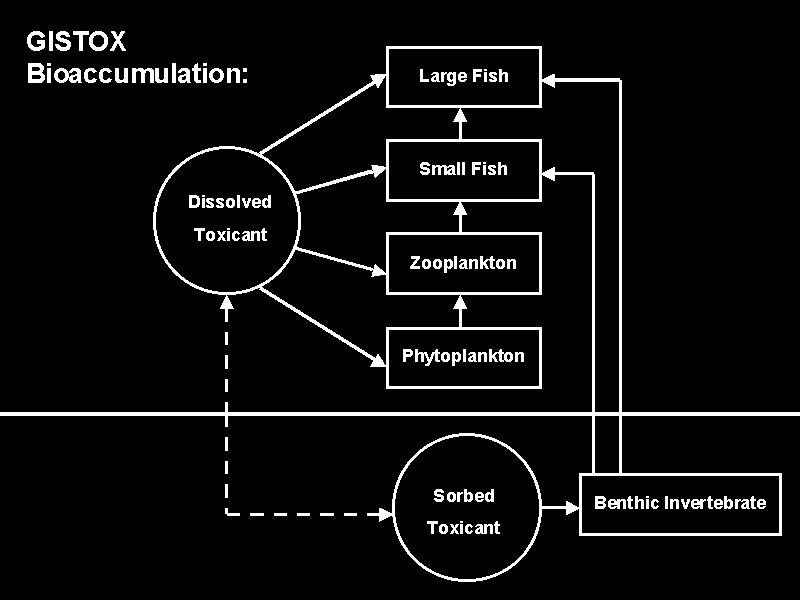
Figure 11. The bioaccumulation calculation is based on a food web containing small and large fish.
SAMPLE APPLICATION
In this section a sample application of GISTOX is presented. The objective is to illustrate the use of the model. Therefore, the focus is on the mechanics of using the GISTOX rather than the actual contamination situation.
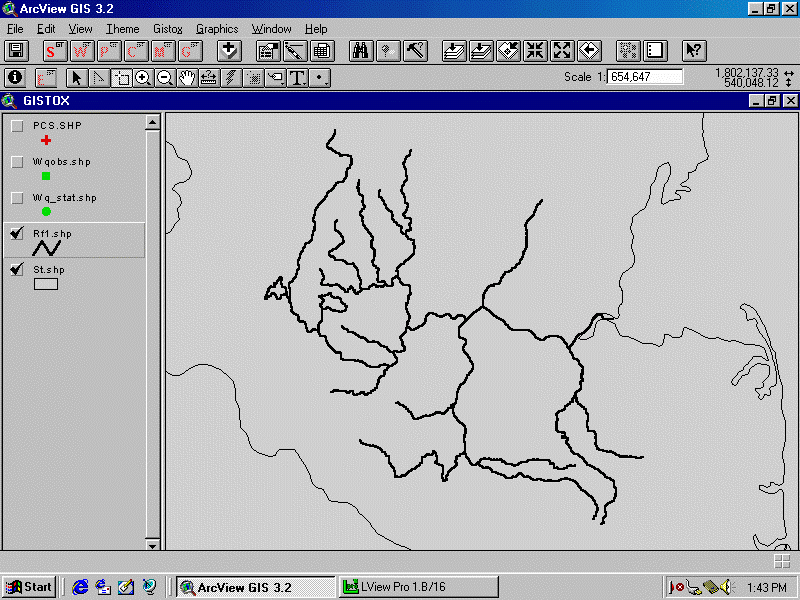
Figure 12. ArcView is started and the GISTOX project is opened. The RF1, PCS and water quality databases from BASINS are added to the project. The GISTOX buttons are at the top left of the ArcView GUI (red buttons).
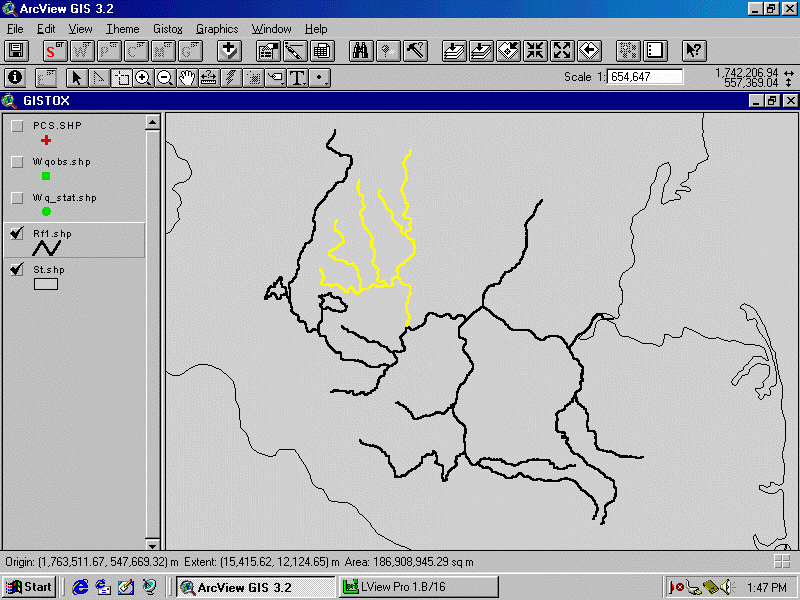
Figure 13. The RF1 reaches to be included in the model are selected using ArcView's 'select feature' tool.
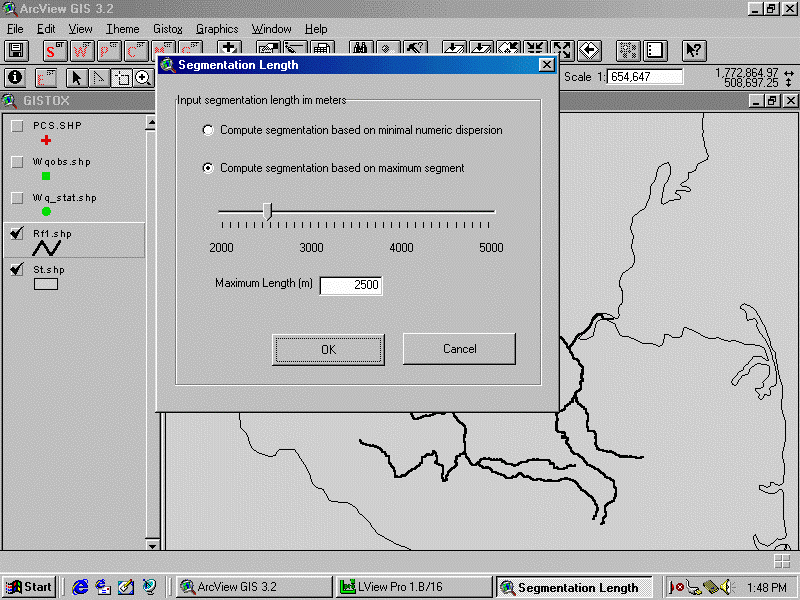
Figure 14. The GISTOX segmentation is created by clicking the 'S' button. The first step is to specify the maximum segment length.
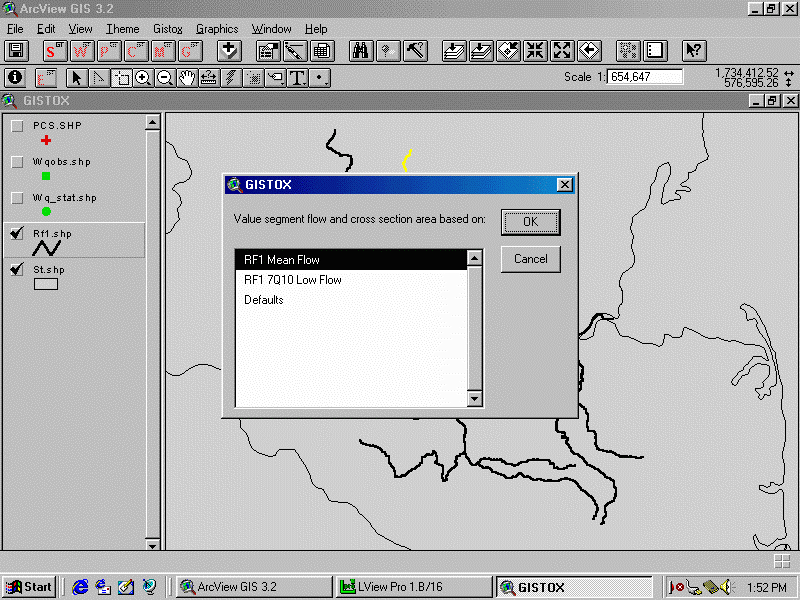
Figure 15. The desired flow rate is selected.
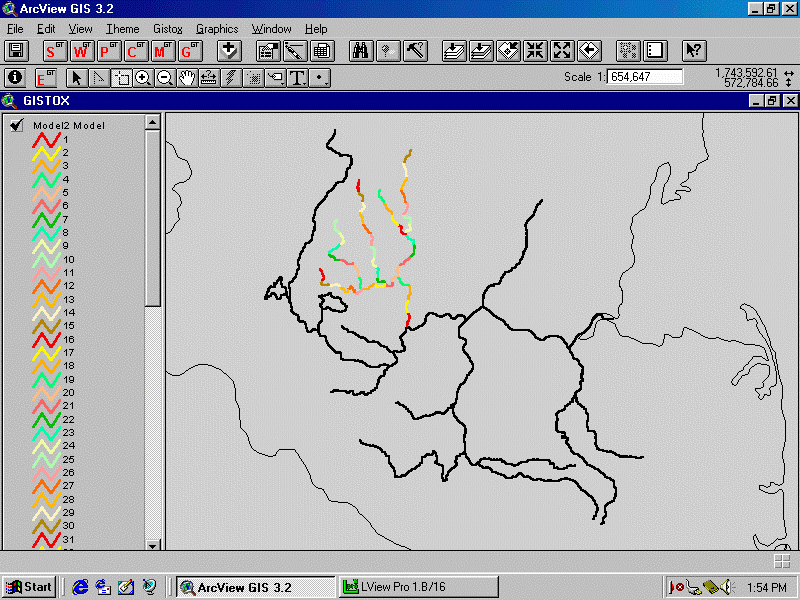
Figure 16. The GISTOX segmentation is created and automatically added to the view as a new layer.
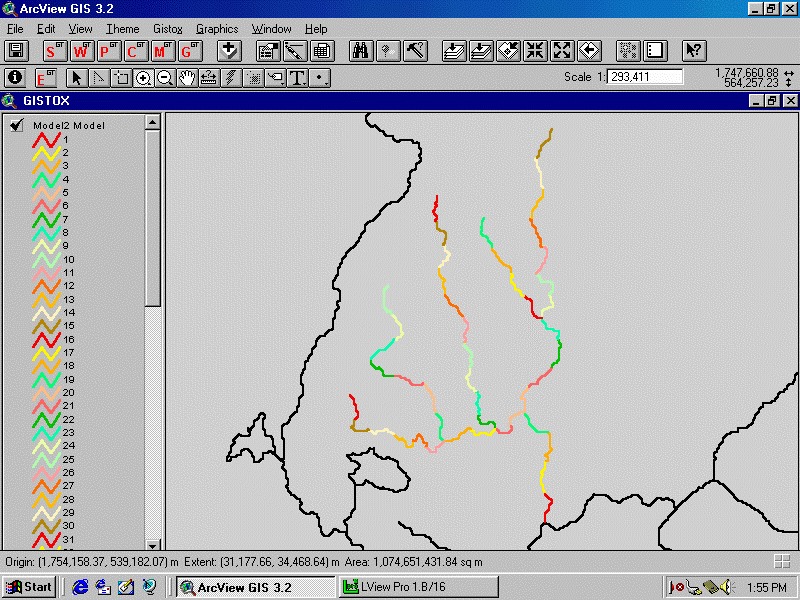
Figure 17. The GISTOX segmentation, zoomed in.
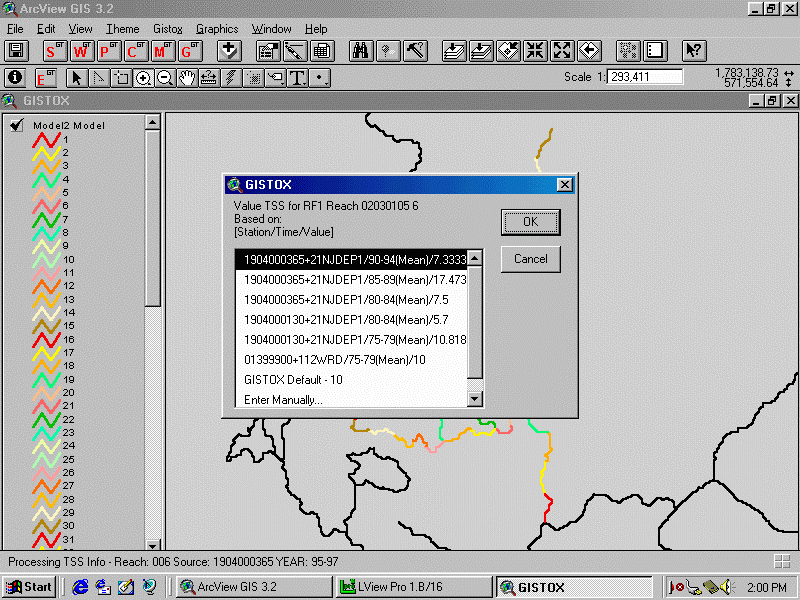
Figure 18. Water quality data (TSS concentration) is extracted from the BASINS database using the 'W' button. For each RF1 reach the results of the query are presented and the desired value is selected.
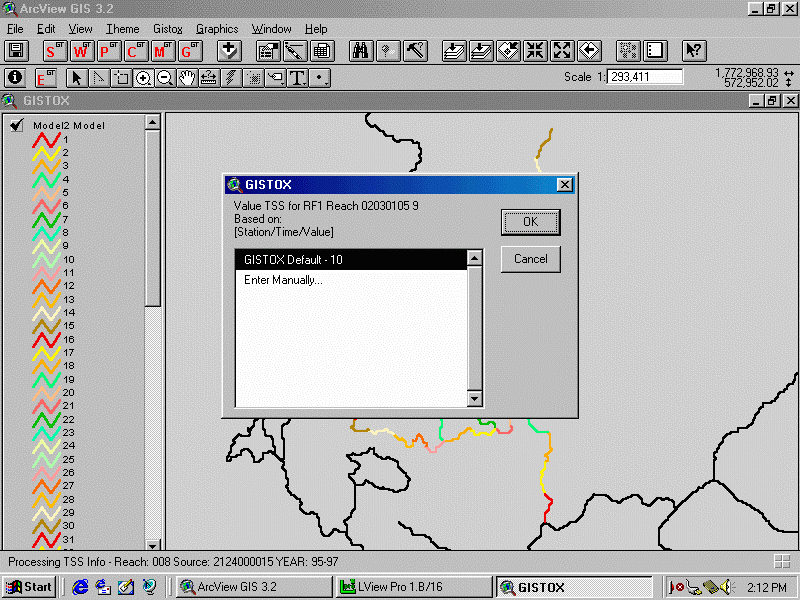
Figure 19. For some RF1 reaches no data is found.
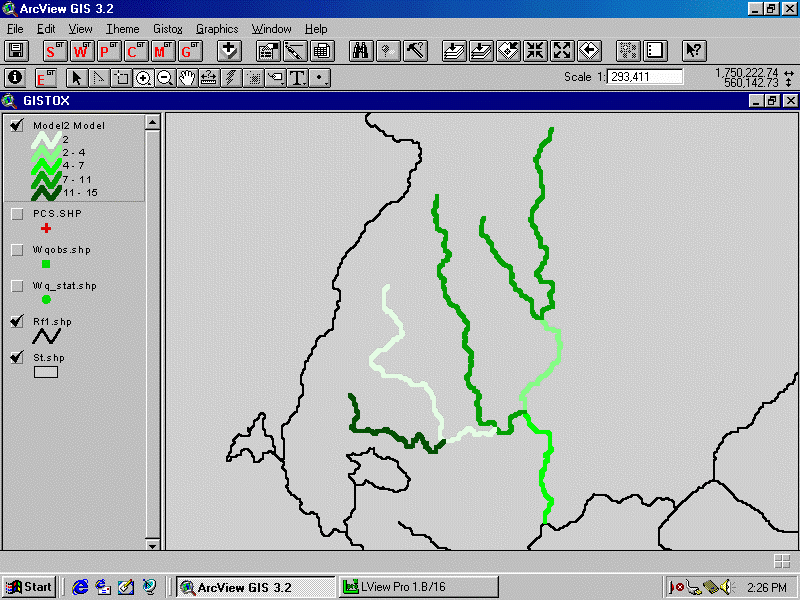
Figure 20. The results of the water quality query can be displayed by coloring the segments.
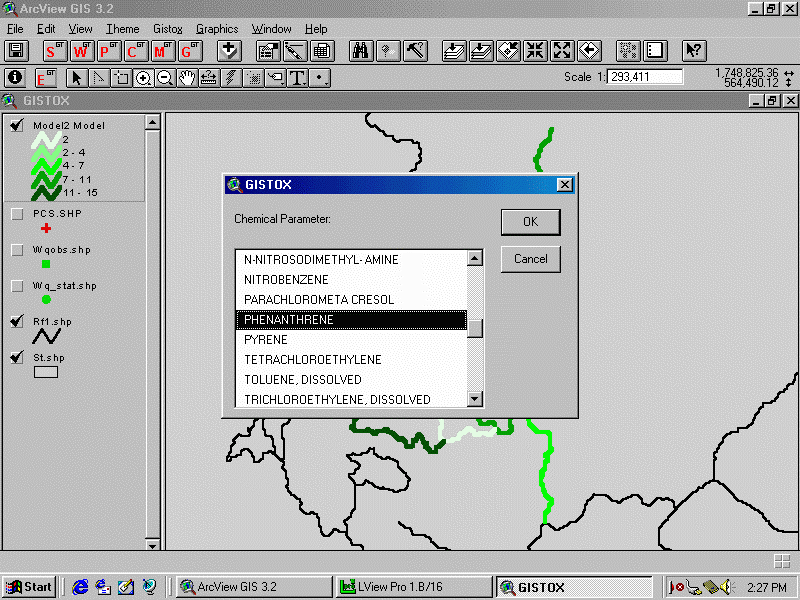
Figure 21. Point source loads are extracted from the BASINS PCS database using the 'P' button. The first step is to select a chemical.
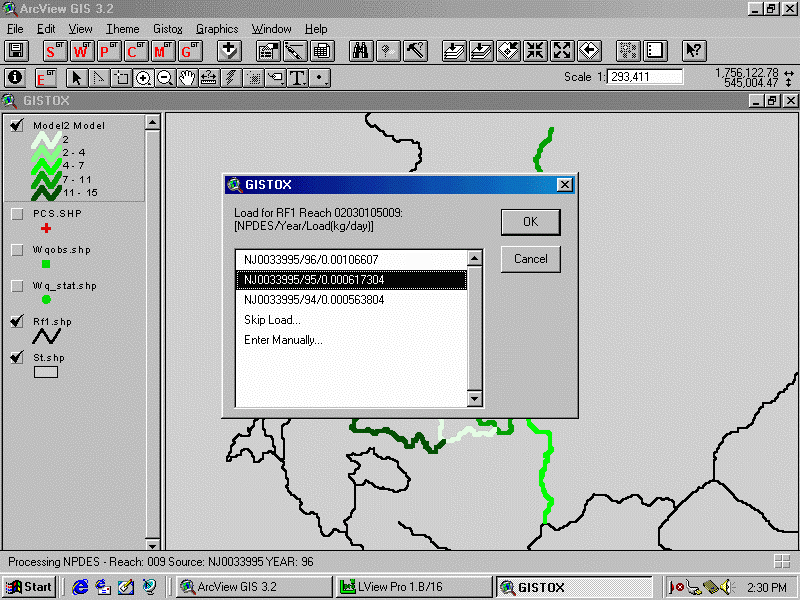
Figure 22. For each PCS discharge the estimated loads are presented and the user selects the desired value. Choices correspond to load estimates for different years.
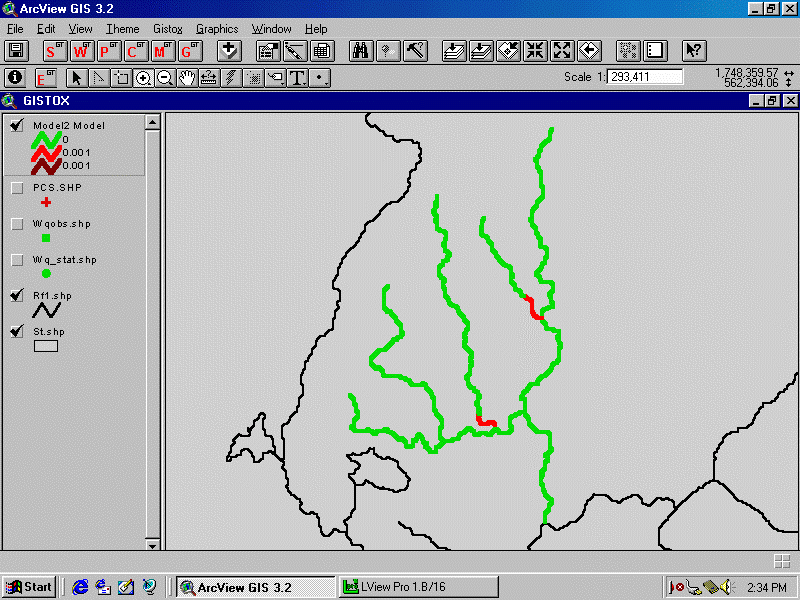
Figure 23. The results can be displayed by coloring the GISTOX segments.
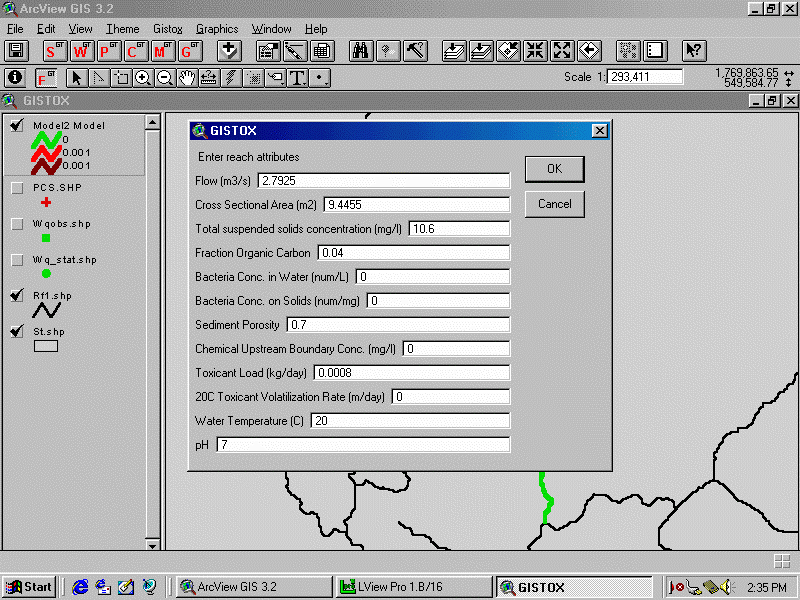
Figure 24. Additional segment parameters are entered using the edit tool ('E' button). Note that data from the BASINS database (e.g. flow, toxicant load) are already valued.
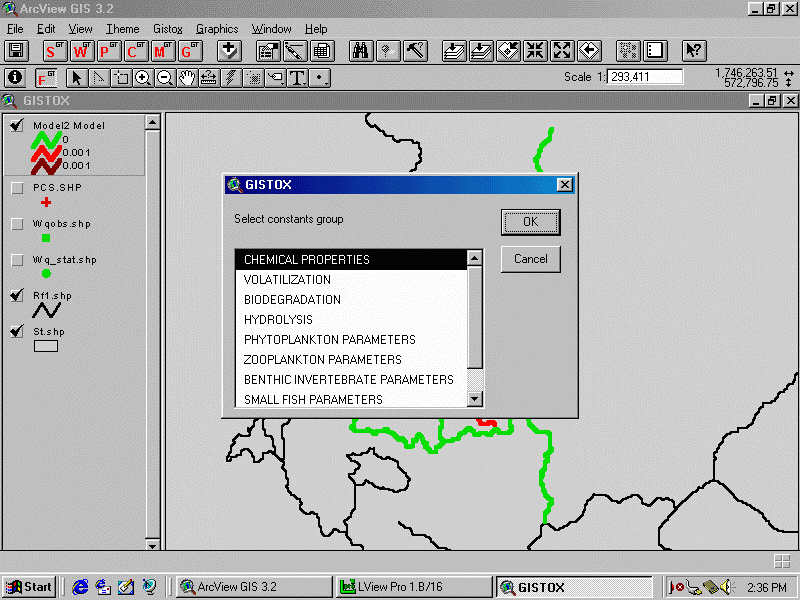
Figure 25. Constant parameters (those that are not properties of individual segments) are accessed using the 'C' button. The first step is to select the category.
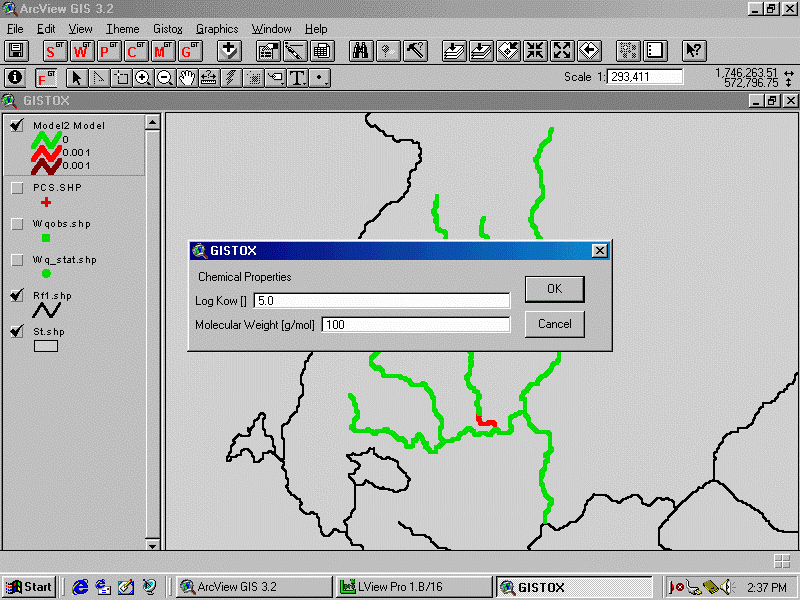
Figure 26. This dialog box is for editing general chemical properties.
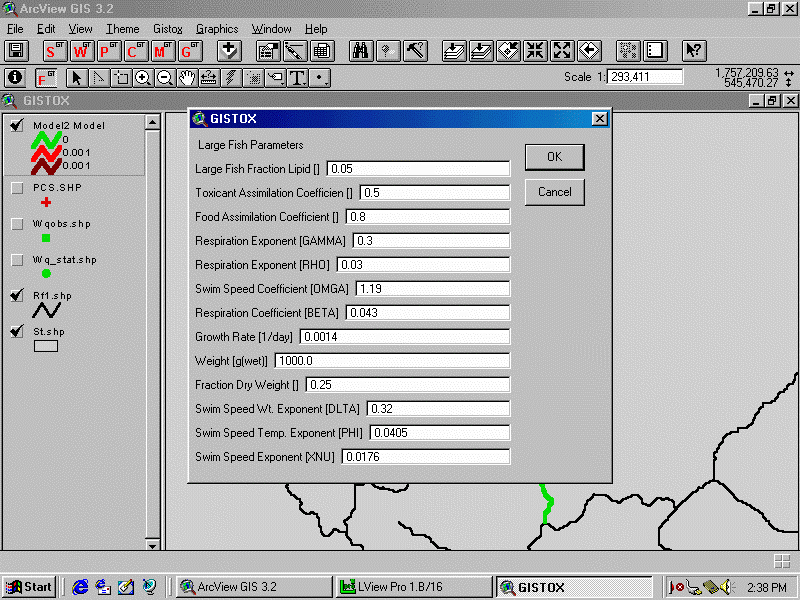
Figure 27. This dialog box is for editing the bioaccumulation parameters for the large fish compartment.
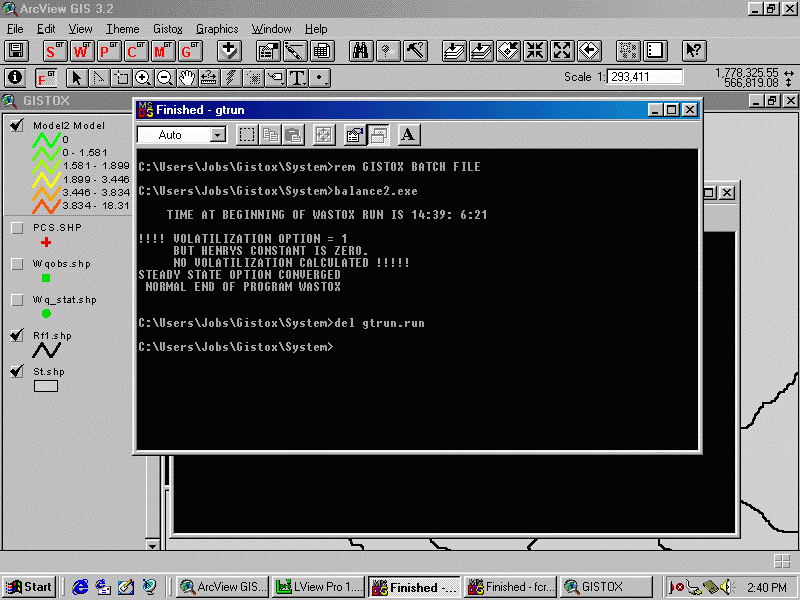
Figure 28. The model is executed using the 'M' Button. The WASTOX program is executed automatically in DOS windows that temporarily pop up.
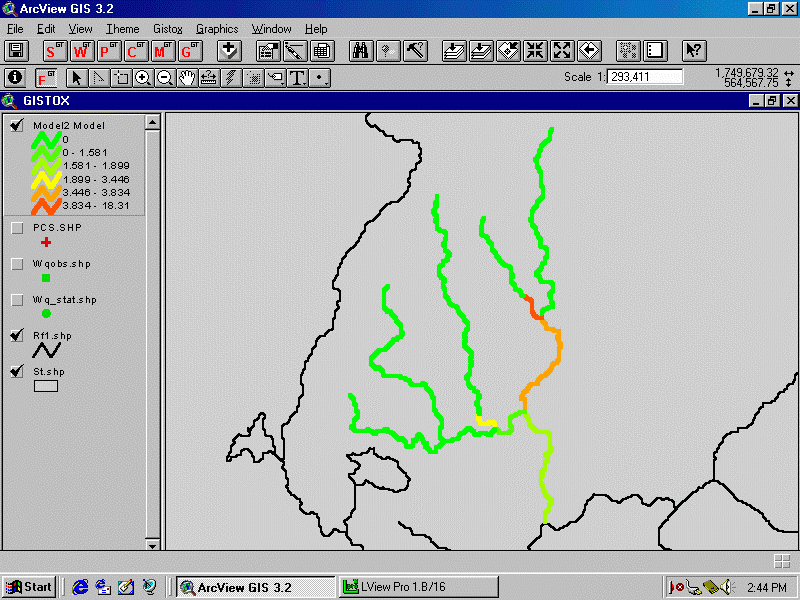
Figure 29. The results are presented by automatically coloring the GISTOX segments based on chemical concentration.
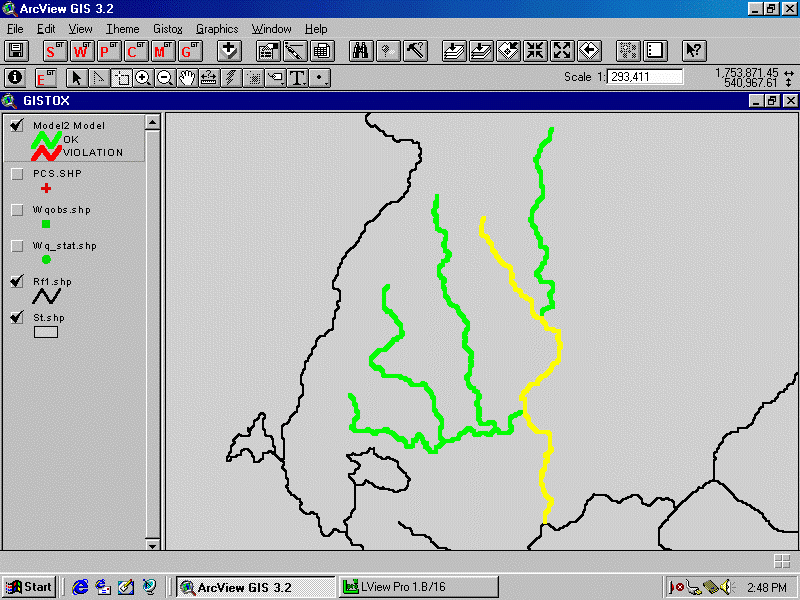
Figure 30. An XY plot of concentration vs. distance along the river can also be created. The first step is to select the desired segments.
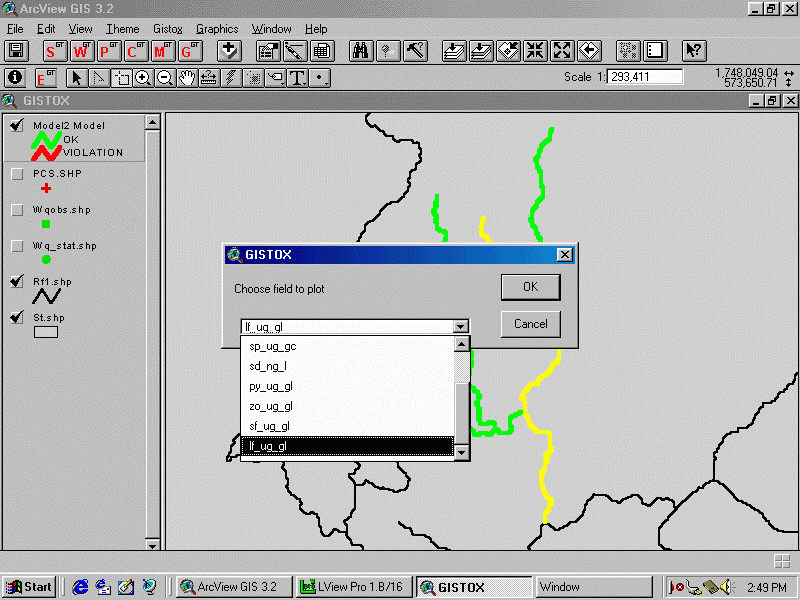
Figure 31. The parameter to be plotted is selected from a dialog box.
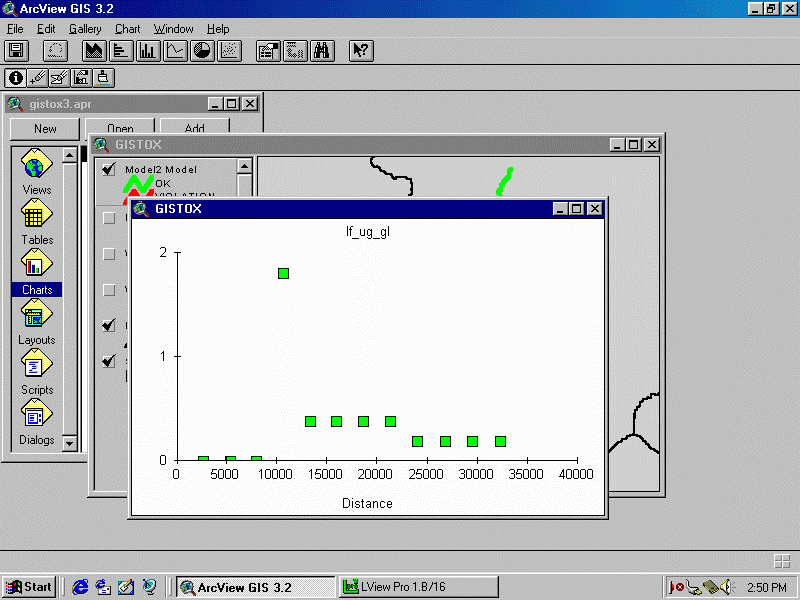
Figure 32. The XY plot is presented.
FUTURE PLANS
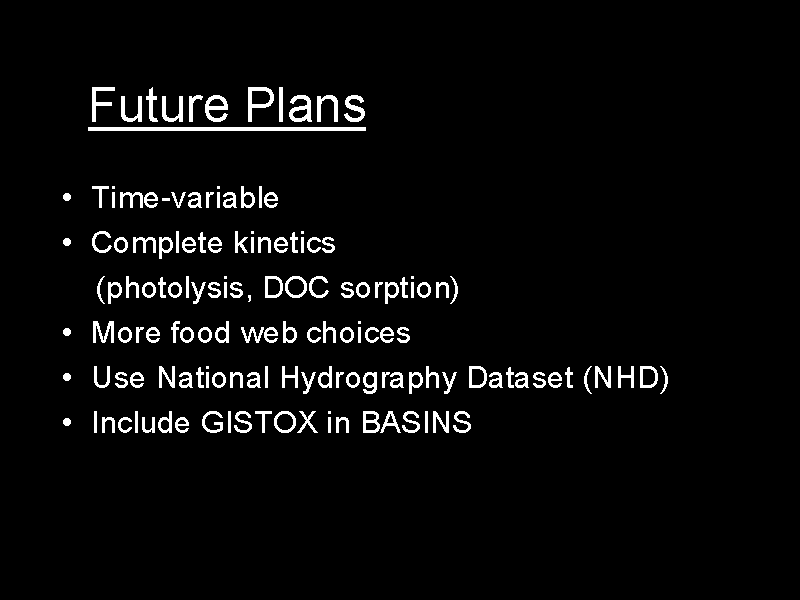
Figure 33. Future plans for GISTOX.
AUTHOR INFORMATION
Ferdi Hellweger, ferdi@hydroqual.com
Darin Damiani, ddamiani@hydroqual.com
Paul Anid, panid@hydroqual.com
HydroQual, Inc.
1 Lethbridge Plaza
Mahwah, NJ 07430
(201) 529-5151
FAX (201) 529-5728
www.hydroqual.com
Kevin Farley, kfarley@manhattan.edu
Manhattan College
Environmental Engineering Department
Riverdale, NY 10471
(718)862-7383
FAX (718)862-8018
www.engineering.manhattan.edu/environmental/index.htm