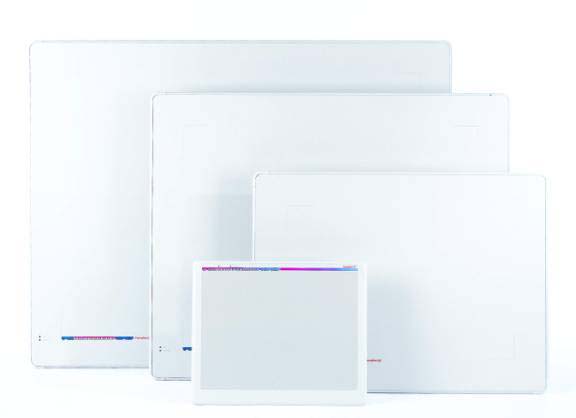
Figure 1.
Various tablet sizes.
Robert A. Ore
This study used a standardized ‘map’ to test response times, accuracy, perception and usability of three different digitizing software: FastCAD (CAD), PC Arc/Info (GIS) and FreeHand (heads-up). The testing was done in three phases at the University of Kansas during the fall of 1996, both semesters and the summer of 1997 and the spring of 1998. Forty-five (plus) students were utilized for application evolution and actual results testing. The results (a lot of data was collected) are broken down into three phases of reporting. This initial paper focuses on the comparison of response times and accuracy. While the results show some insignificant correlative results, the paper primarily serves as an outline of the steps taken to formulate and design such a test and it’s procedures. Most notable is the unexpected difference in the hardware system of digitizing rather than the software. Keywords: digitizing, Heads-Up digitizing, tablet digitizing, PC, PC Arc/Info, Arc/Info, Windows, Heads-Up display, digitizing tablets, ergonomics, human computer interaction (HCI), cartography, Geographic Information Systems (GIS), Computer Aided Design (CAD), Registration, RMS Error.
Digitizing is to today’s mapmakers what pen and ink were to cartographers of yesteryear. Only a short while back one compiled maps by hand, rendering them in pen and ink first on parchment, then on paper. Today, one generally copies feature elements from an existing map or makes a unique compilation by scanning and/or digitizing. Early pen and ink drafting was learned and passed down through years of apprenticeship and observation. Maps were plotted and traced by hand, often on top of the original, replete with its errors and extracurriculars. The process could take from days to weeks or months depending on the scale, detail and size of the map. ‘Mechanical’ devices associated with this type of drafting include the compass, straight edge, protractors, scales and varying widths of pen points. Each of these requires a significant term of acquaintance for skilled usage. Later, maps were copied by photographic reproduction, which in itself is a specialized undertaking. Today, users can place a book on a copy machine and for ten cents receive a paper copy in seconds.
With the increased use of computers, a technological revolution is erupting in the mapmaking and map-using world. There is a need to transfer all types of maps from paper to digital format in an efficient and accurate manner. If this can be done easily by individuals with limited training, it would be more cost effective. This project focuses on the use of a computer to digitize a simple map.
Outside of the newer and more expensive, automated scanning recognition processes, there are two general ‘mechanisms’ for digitizing, heads-up [on screen] and [flat] tablet. Incorporating these ‘mechanisms’ are three general software approaches, Illustration, CAD and GIS, [1] each is symbolic of a particular niche in the digitizing market. Using software representative of each niche, performing the same task on the same map, tests were conducted to compare the accuracy and efficiency of their use in a proposed digitizing business. Efficiency was measured by the amount of time it took for someone with little or no geographic, Cartographic or GIS background, [2] after having been shown the software, to digitize a simple map. Accuracy was assessed by correctness and completeness of features on the resultant maps. All software used in this project was available in the Geography Department at the University of Kansas. Each has its own advantages and disadvantages for users. In addition, each offers compatible output for the transfer of data into several, if not all, of the other major spatial software.
The Graphic User Interface (GUI) is the means by which an operator or ‘user’ manipulates or gathers information from a system. In the case at hand, the user was the participant in the test and each system, with the hardware, provided an interface for each digitizing software. The GUI is the means by which the operator manipulates these digitizing systems. The user can receive information from the monitor and give information to the computer system through the keyboard, the mouse or other peripheral device. The computer responds by sound or graphic representation on the monitor. Just how easily and completely the participant understands the commands and the command structure provides a measure of the effectiveness of the person-machine interactions and can be directly related to the correct output. The GUI was, therefore, at the heart of this project.
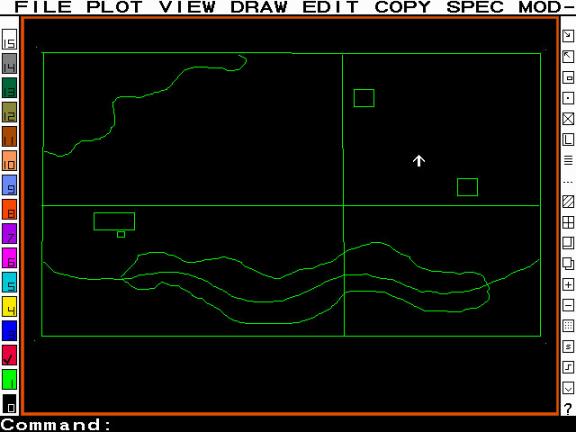
To represent an illustration, heads-up, on screen tracing software, Aldus FreeHand 5.0 was chosen. This Windows-based software has an array of features and tools for the professional rendering of maps or other illustrations used in publications and periodicals. FreeHand allows for the use of a digitizing tablet, but it is universally used in conjunction with a scanned image placed on screen in a background layer. It is driven with actions input from the mouse or the keyboard. Large sized maps, that would require stitching or assemblage after scanning, are better handled by the large format tablet digitizer to ensure accuracy. FreeHand is used widely in the private sector and by engineering, design and geography students at the university level. Output from the software is extensive and, in addition to the FreeHand Illustration format, ranges from TIF and BMP to CorelDraw and DXF formats.
FastCad 3.0 was chosen to represent engineering/drafting/design software. This computer-aided-drafting/design package utilizes elements of both DOS command line entry and puck-driven, pull-down Windows style choices in the digitizing mode using the digitizing tablet. While FastCad can be used in a heads-up mode, CAD packages are most often encountered in the tablet-digitizing configuration and will be used as such for this project. The puck can be configured in several ways to customize its actions and use. FastCad has a more limited range of output formats, but does export DXF, EXF and IGES formats.
The choice of PC Arc/Info was made early in the process of selecting a GIS for a digitizing comparison. Arc/Info is not only considered a standard in the industry, but it is used by many universities as well as by municipal, county and state government agencies. As with FastCad, PC Arc/Info can be used in a heads-up fashion, but it is usually encountered with a digitizing tablet. The interface for the digitizing process is completely puck driven with all actions keyed from the puck buttons in response to command-line instructions. Unlike FreeHand and FastCAD, registration is required at the beginning, so an understanding of certain tablet/system procedures is also needed.
The monitor is the primary conduit for the interaction of the human and the computer, between the ‘user’ and the ‘system.’ The user sees the results of his or her actions (committed by mouse, tablet or keyboard) on the screen and is often prompted or otherwise compelled to act or react. [3] Monitors can vary greatly in size, design and color display abilities, but they essentially do the same thing: they display the actions or reactions and effects of possible and past choices made by the computer operator.
Though most keyboards use the QWERTY layout [4] with a ten-key side panel, some of the more specialized keyboards are tilted, angled, split-up into sections or reordered. Users often have the ability to modify or enable certain keys and combinations of keys for fast access to complex or special operations.
The mouse can have one-, two- or three-buttons depending on the design, the need or the operating system. With two- and three-button mouses there is an ability to customize menus or actions for a right, left or center mouse click. In general, most current UNIX, DOS, MAC, or Windows products are designed for one (MAC) or two (PC) buttons.
The digitizing tablet and puck should be considered a single entity, because each is dependent on the other for operation and use. The tablet itself is a series of fine wires, tightly woven over and under, like a blanket or piece of cloth, utilized for the minutest detection of indicator placement on its surface. [5] This ‘fabric’ of wires is stretched taught over a flat surface (board) and encased to prevent movement. Tablets come in a variety of sizes, in small, medium and large formats. Smaller digitizing tablets fit on most desktops. Larger varieties stand-alone, allowing for a variety of positions [Figure 1].
Figure 1.
Various tablet sizes.
A map or drawing is taped to the digitizer’s surface and a puck (‘mouse with number buttons’) is used to trace desired features into the digital system [Figure 2]. At one end of this puck is the crosshairs on a transparent pad to designate the pinpoint of the pointing device [Figure 3]. By pressing a button or series of buttons in sequence (as the center of the ‘+’ is placed over a particular feature) drawings can be traced and maps or engineering plans digitized. Many of the puck/tablet digitizing systems also have elements for customization such as the delineation of areas on the tablet for pull down style menu selection and puck button customization.
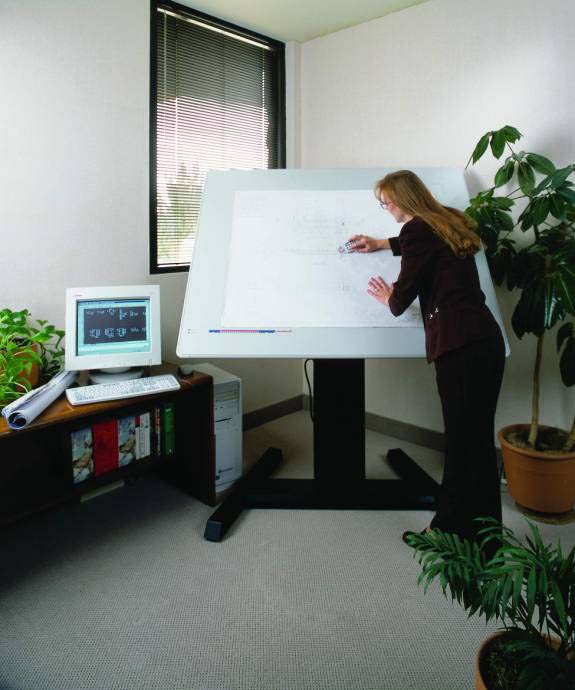
Figure 2.
A typical digitizing environment.
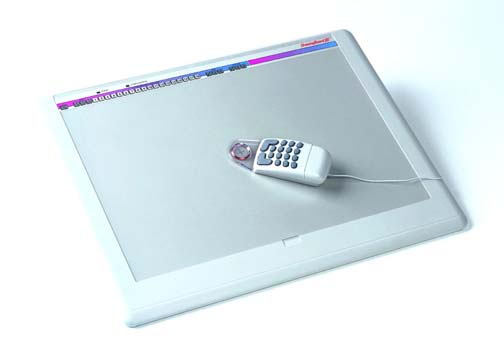
Figure 3.
Puck and small tablet.
The first steps of heads-up digitizing commonly involve the electronic scanning of a ‘base-map’ [6] to be used as a backdrop for the tracing, on screen, of features represented. In FreeHand the scanned image is ‘imported’ into the current project and placed in a ‘background layer’ to be turned on or off as necessary while copying the data to be digitized. Most, if not all, of the current heads-up software tools are based on features along the same lines as the Microsoft PaintÓ program included with the accessories provided by the computer. ‘High end’ software may have elaborate ways of drawing lines, curves and complex shapes. Several map-publishing houses use heads-up digitizing processes. Interaction of the user is usually confined to a mouse/monitor interaction with beginning and intermediate groups, while more advanced users utilize shortcut keys.
CAD (Computer Aided Design) software is used in engineering environments, where detailed drawings or mathematical structures can be easily assembled and manipulated. Maps can be made in this environment, but the software nomenclature is not specifically geared toward this. Common elements or commands include line, point, box, undo and cut. Building schematics, structures, centerlines and as-built representations are only a fraction of the possible ‘engineering’ constructions. CAD instructions or dimensions can be mathematically laid in through the keyboard from point to point using the keyboard-based Command Line or, as used in this project, input from a digitizing tablet (using the puck).
GIS software for input is indistinguishable from CAD software in theory and approach. [7] A map or figure is taped to the tablet and the puck is used to digitize the data. A GIS however, is more concerned with the geographical relationships and spatial representations of the figure elements. Geographical and spatial relationships between individual elements are more closely scrutinized using reference points and the built in error checking associated with them. More specifically attuned to the software used for this portion of the study, once the digitizing procedure is initiated through the keyboard, the actual entry of data is centered on the puck keys and the digitizing tablet. All data entered into the software and represented on the screen are input from the various keys on the puck.
GIS databases are an increasing necessity for developmental, recreational, municipal and environmental organizations. While emphasizing the spatial nature of things (location, direction, and distance), a GIS also encompasses topological aspects and the attribute or ‘information’ side of features as well. An example could be as simple as a power pole on the corner of your street. Attributes of that particular pole could include location (x, y), elevation (z), height, type of tree, date cut, date placed, lines attached, voltage of the lines, any transformers, etc. Geographic Information Systems provide a lot of information to decision-makers and long-range planners in charge of the spatial allocation of services and resources. GIS operations also give access to analytical functions based on feature location, topological relationships and attributes.
The Test population was drawn from several sources. Many came from classes in Cartographic Design and Human Factors at the University of Kansas during the fall of 1996, both semesters and the summer of 1997 and the spring of 1998. Others were encouraged through acquaintance, personal invitation, and fliers at the departments of Geography and Engineering. Subjects, male and female, ranged in age from 6 to 56 with the average age of 23. Keeping their identities anonymous, the individuals will be referred to by numbers from 1-43. [8]
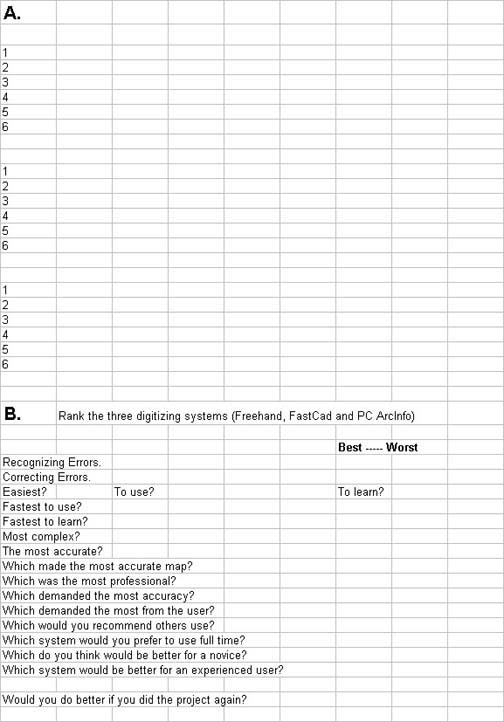
A biographical questionnaire [9] [top of Figure 4] examined each subject’s educational and computational experiences. Using it to guide discussion, information about educational level (year in college, graduate school, and degrees), knowledge of computers, software familiarity, [10] and the hardware or peripheral devices they were acquainted with, was gathered.
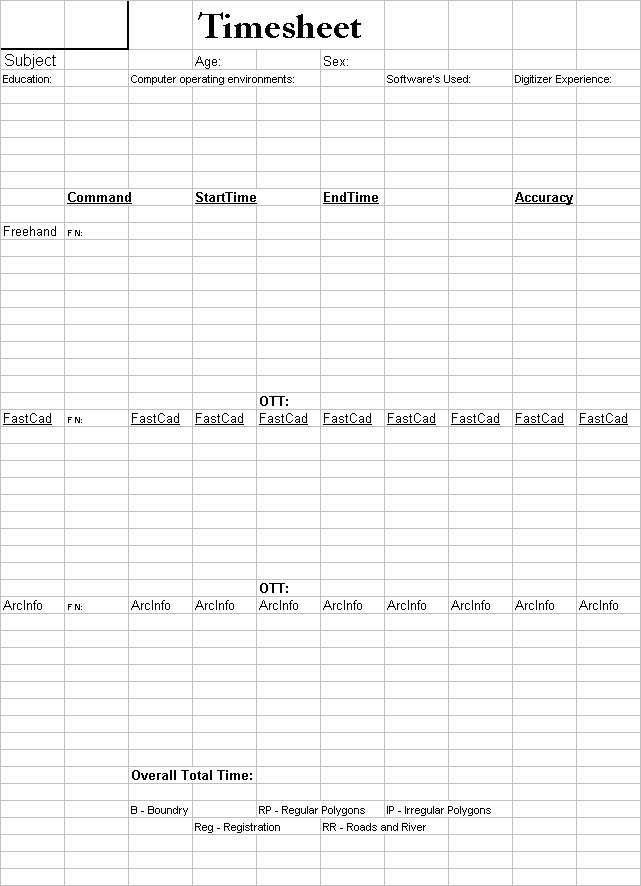
Figure 4.
Biography and records sheet.
Using computers, as many do during their college programs, most of the test group were comfortable and capable using the computer as an instrument, or as a tool. The survey assayed platform ownership and experience: DOS, Windows 3.X, Windows 9X, NT and/or Unix. This inquiry was kept to a minimum outside of the drawing and digitizing realm, asking only for usage of word processing, databases, Internet, drawing and games. Within drawing or digitizing as a central focus, each was asked if they had experience with MS Paint, Aldus FreeHand, PhotoShop, Arc/Info, AutoCAD or any other drawing, digitizing or image reproducing software. If an avenue of usage appeared, then specific software, platform and peripheral devices were identified. [11]
Five categories were used to record their responses to questions about their experience in drawing or digitizing. FreeHand was placed in its own category, reflecting an example of a Windows based, scan tracing, and map-reproduction software. CAD experience indicated that no particular software was dominant. [12] Arc/Info was considered by many to be a unique GIS interface which, with little description, could be easily identified by all that have used it. PC Arc/Info (3.2) is an early version of the workstation PC Arc/Info platform. Two other categories were included: other GIS (geographic) software and several systems related to other forms of geo-data introduction. With this information, the experiences of ex-military and foreign students could be accounted for.
While some participants had knowledge of several systems, the majority had little or no experience with digitizers and digitizing. Using this criterion experience with drawing and digitizing, as a means for grouping the subjects, the 43 participants were split into three groups: Novice (acquainted with none or only one software package), Intermediate (acquainted with at least two software packages) and Professional (acquainted with three or more software packages). Accordingly, novice users included those who had the least exposure to digitizing or computer drawing and professionals had significant actual hours of related experience.
Iterative Design and Positive Interaction
Early on, it was decided to use an iterative approach in the test design process. Where the instructions and digitizing testing procedures were developed, tested and then revised several times. [13] Graduate students, constituting a Delphi association, were enlisted to help in the rapid implementation of the test, the map and the various software ‘capture’ complexities. [14] This group was most valuable for “proofing” the presentation and instructions. Feature implementation and reproduction tools used in certain software were discussed, and their inclusion in the handout was weighed against their complexity. After using this fine-tuning, an ‘official group’ was tested. [15] An earlier examination (before the Delphi) was attempted during the class time of Prof. Robert Nunley’s Human Geography class in the common computer lab, 12 – 20 students all at once; a nightmare scenario solved by instruction design improvement (an iteration) and sequestered individual attention (a closed office).
With the information gained from the Delphi group, a standard modular structure –a script– was constructed to assure that the same instructions would be given to each participant. Great care was taken to include equal amounts of information and options to each user so that they could accomplish, using each software, the task in an expedited fashion. This structure consisted of a personal introduction, the background and computer experience inquiries, an introduction to “mapping 101,” the tests, and feedback-performance assessment.
Personal introductions are perhaps the most important aspect of test taking, and this is often overlooked. With an introduction, you set the tone for the coming minutes together. It is therefore important to be upbeat, interested, attentive and gung-ho about the subject’s participation in the exercise. Interpersonal interaction to find common ground and experiences is most helpful in setting this positive tone. During this interaction, the conversation is directed toward the subject’s name, age, year in school, coursework, major, computer ownership, computer use and, most importantly, drawing and digitizing experience. After this initial information was gathered and recorded, a short course in mapping and cartography was given to familiarize the subject with nomenclature and symbology. Once these preliminary stages of the process were completed, a testing cycle was carried out using the three software packages.
Each test was broken down into four sections: an introduction to the software, a physical exploration of the software, the test itself, and an (immediate) evaluation of the testing experience. At least two tests were administered at a time, each using the four stages. In the beginning, all three software packages were tested at a single setting. These were chosen using a daily rotational order to equalize the number of individuals participating in each. After a fortnight of tests were conducted and nineteen participants examined, average test times were used to modify the testing program, with an emphasis on the faster of the two software. Of these nineteen participants, seven were from the Professional group, three from the Intermediate and nine were from the Novice. [16]
Introduction to Mapping
At the outset participants were given a standard introduction consisting of an overview of the project at hand and an explanation of some elementary cartographic concepts. They were shown a USGS topographic quadrangle and given an explanation of its relationship to the present exercise, focusing particularly on encapsulating several concepts of cartography and geo-reference notation. The quadrangle is introduced as a two-dimensional representation of the three-dimensional (real) world. This map series uses several methods of location reference including latitude and longitude. Line, point and area designations on the map were emphasized as representations of physical features and other aspects of the earth’s surface.
Next, the sample map was presented and an explanation given for the various features represented [Figure 5]. This simple map is a representation of a rural area with two intersecting roads, houses, a border and a set of reference (or registration) marks. The linear attributes of the map were created to simulate the linear and area features encountered in the average digitizing project. [17] Line weights were varied to simulate real world differences as well. The lines across the center, both top to bottom and side to side, represent roads. The textures of these lines indicate the type of surface (paved versus unimproved, i.e., gravel or dirt). Boxes or rectangular shapes represent buildings (houses). In the upper left corner is a ‘wooded’ area delineated by a curved line from border to border. At the bottom of the map is another curved feature representing a ‘river,’ bounded in part by another wooded area. At the corners of the border are four ‘registration marks.’ Similarities between the USGS map and the sample map were pointed out (reference notations/locations, basic symbology: buildings, roads, waterways, etc.).
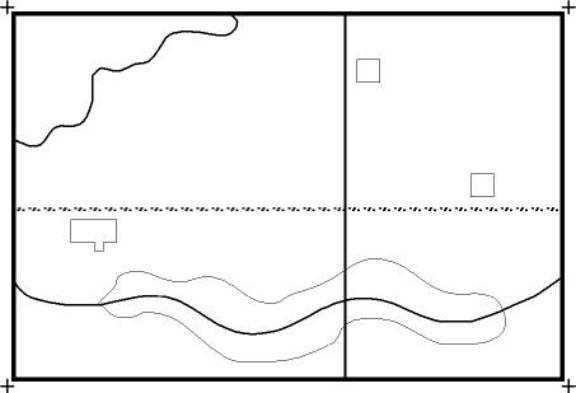
Figure 5.
Author's simple map.
Registration (coordinates) are used to orient maps to one another. Most systems for digitizing call for entry (registration) of at least four fixed marks on the map. In GISs, registration is required up front. This procedure is used to calculate a RMS (Root Mean Square) or ‘registration placement’ error. RMS is calculated after the initial digitizing session, at some later session, when additions or corrections are made to the map. At that time you re-register the map and a calculation is made of the distance your re-registration is from the original marks. If the RMS is too high, then the data may not be entered in correct location relative to the original features. With Illustration and CAD software, the registration is added and used, but is not ‘requested’ (or required) by the software and it is not used by the package to calculate a RMS and adjust for it. The concept of registration and the need for it was explained as part of the test program, emphasizing the correct placement of features and the tying of one map to another.
After this introduction, the test subject was handed a written introduction to either FastCad, PC Arc/Info, or FreeHand.
Handouts
Each participant was supplied with a written set of introductions or reference sheet(s) for each software package. A time ‘records’ sheet [see Figure 4] and a rankings ‘record’ sheet were kept and maintained by the examiner. [18] The time sheet contains spaces for notations for each of the three software tests and an area at the top for data from the earlier interactive ‘biography.’ Test notations include the tool selected, the feature to be drawn, any errors made in real-time, miscellaneous observations and, most importantly, individual feature and total test times. [19]
The reference sheets contain an introduction and how-to instruction for the software. [20] These carefully constructed software introductions begin with a description of the package in the software niche and an example of typical users. In plain language, they give a rundown of any nuances involved in beginning a software use session, the functions of the recommended chosen tools and a step-by-step explanation for error correction. After reading the handout, the test participant was allowed time to familiarize himself (herself) with the drawing tools and the GUI. During this practice session, the participant was asked to manipulate the interface, running through a series of commands set by the examiner. This interchange, being loose and free-flowing was not scripted or subjected to strict guidelines. Only when the material necessary to complete the process was covered and both the participant and examiner were satisfied with the training session, was the test begun.
Peculiarities of each controlling apparatus were shown and discussed. Included in this are the movement of the mouse or puck, the movement of the on screen pointer, data entry peculiarities, and software terminology differences. Each ‘primary’ tool (line, box or rectangle, and point) was introduced. [21] The participant was shown how to make the feature as well as how to delete or modify it. After all primary tools had been practiced, several secondary tools that enhance the ability of the operator and, in some cases, speed up the process were demonstrated.
In FastCad,the person was shown how to use both Command line and pull-down menu entry. Command line entry is a holdover from the DOS style for entry of data (a ‘typed in’ command is followed by pressing the Return key to make the action commence). Pull-down menus, on the other hand, are the most familiar ways for interacting with software today. In FastCad, pull-down menus can be made using the digitizing tablet after designating an area for point and click operation. Both methods of interaction were demonstrated, though the participant was encouraged to use the more familiar pull-downs. The anchoring of features and the action of location symbols in FastCad were then pointed out. The ‘repeating’ nature of the software action was explained along with Undo, Erase, Choice Boxes and action of the keys designated on the puck.
In FreeHand, individual aspects of the resultant elements were elaborated (curve handles, point and line movement as well as feature ‘activation’ for manipulation or addition). Subjects were shown how to PAN about the image and how to use the MAGNIFYING tool to zoom in and out. [22]
For PC Arc/Info, introduction is a little different and a little more involved. The starting procedures are different and must be accomplished with greater care. Tic ID numbers are required along with their ‘registration point’ indications. The examiner must show entry of the numbers, acceptance of that entry and the placement of the actual point. Next, there was a need to explain the concept of the boundary or the ‘setting of the screen viewing area.’ [23] Finally, the examiner showed how to add features, making the person aware of how to recognize and fix errors - before other things can proceed - when adding features. [24] There was also a need to familiarize the subject with Arc/Info’s many submenus. [25]
After all of the explanation of a single software was complete and all questions had been answered, the subject was asked to look at the description one final time before the test was administered.
The Test
The evaluation itself was conducted in an office located in Lindley Hall, Room 219. [26] Making use of a rare excess of computer components, the system manager was able to construct a working space with one DX4 486 (Microtek, 133 MHz, 32 Mb RAM) computer running Windows 3.11 (DOS 6.22) and two external tabletop digitizing tablets. [27] This computer ‘platform’ was coupled with a standard serial 2-way switch box linked to the dueling digitizers. Two digitizing tablets were needed (for both Binary and ASCII data-streams) to save on the physical adjustments to the tablets themselves and to quicken the test activities. [28] Files were saved to the hard drive and to a secured 3.5 floppy disk. The heads up digitizing of FreeHand could be initiated at any time by merely activating the program in Windows. The use of FastCad and PC Arc/Info required the restarting of the computer after switching the input between the exclusively set tablets.
After having been introduced to the software and after having practiced each tool and correction technique, the individual was asked to accomplish the digitizing task in the shortest amount of time with a minimum of errors and misrepresentations. Though time was an important factor, they were not asked to sacrifice accuracy for expedience.
The test began with the starting of a stopwatch. As each participant selected a tool, this was noted on the left of the time records section [Figure 4]. Upon completion of each feature, the time was written down on the right. Subsequent ending times, chronologically flowing down the page, were used to calculate individual feature input times. [29] Comments from both the participant and observations by the examiner were recorded where necessary. The participant was encouraged to ask questions at any time during the exercise, though he (she) instructed to keep the handout ready and to look at it first.
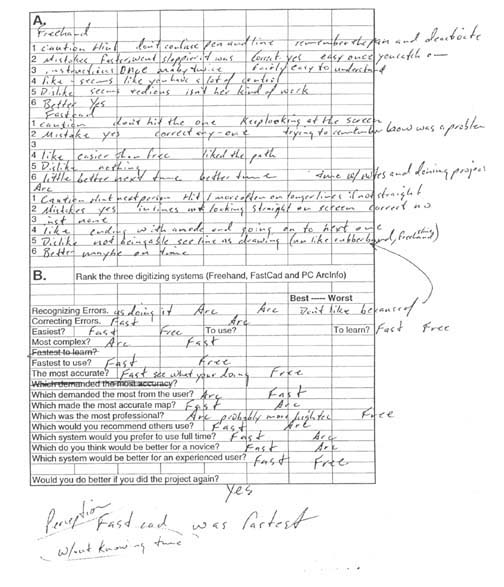
After the participant completed the test, he (she) was told of his (her) time and asked a few questions by the examiner to gain opinions and observations about the exercise. Several of these questions and responses were consigned to a follow-up project and will not be discussed here. These ten to twelve questions constitute feelings and evaluations of the best and worst features of each software in usage and options. Many of the remaining questions were used to assess the effectiveness of the examiner’s presentation and the nature of more software/how-to emphasis. Finally, the participant was given an overview of his or her place in the growing data set and a preliminary critique of the software was recorded.
Once all of the tests were completed, the data were put into a series of spreadsheets. The first one created was a composite list of each subject’s timed performance, tool selection, observed errors, compilation errors and various verbal responses. [30] From this master list, the data were distributed by subject to a series of smaller spreadsheets. In this paper, we have generalized the results from a very large test that included thousands of pieces of data. There should be no expectation that all will be covered here. Samples of the data recorded during the test can be seen in Appendix A. The ‘data-bundles,’ created for the present study, consist of three subject areas: recorded time, map errors and observational errors.
Recorded Time
Time was the most important factor in this inquiry. Using paper and pencil, the examiner’s accuracy and recording thoroughness are all that remain of each series of events. Originally, times were recorded with a stopwatch in the format of one-minute equal 60 seconds. Later, these were transformed to decimal minutes (e.g., 15 seconds = 0.25) in order to make the data more analyzable in the statistical analysis. Each series of recorded time results were separated into the individual subject’s full test completion times and individual feature completion times. The individual participant times were then separated into the Professional, Intermediate and Novice (PIN) groups. Each numerical dataset, from generalization to specification, was subjected to standard statistical evaluations. Graphs of the data were created to show the characteristics of the distributions and their correlation. Scatter and bar graphs were made of significant datasets to enhance understanding of their relationships to or differences from one another.
Initially, the test ‘end times’ of all participants were grouped by software (FastCad, FreeHand, and PC Arc/Info) to check for significant differences in overall performance. [31] Later, the data from each of these software groups were subdivided into the PIN groups mentioned above, and subjected to another in-depth inquiry. [32] Likewise, using the software framework, individual feature completion times were grouped and subjected to, again, a t test analysis. [33] Eventually, using the framework of software and ‘professionalism,’ a new set of individual feature times was tested. [34] All of these tests were conducted to determine, group by group, software by software, feature by feature, whether there was a significant difference in the amount of time necessary to complete a digitized task.
‘Hard Copy’ Map Errors
Each map compilation was evaluated in its ‘raw’ form. [35] No post processing was done in order to preserve individual performance. Screen Captures were made as a back-up and to provide easy reference to the digital files. [36] Using this raw performance, a critique of each individual’s ‘mapping’ compilation(s) was made by the author. Each software has its own nuances and palette of tools. These factors, in combination, lead to numerous ways of making mistakes.
In any of the three software packages utilized for this project, a simple ‘line’ tool could be used to complete the entire drawing in a relatively short amount of time with minimal error. Errors occur in many ways. Error marks were given for features or lines not joined, missing completely, not long enough, errant spikes or separated line segments. Definitions of these errors will be given below. Though fluidity was not specifically asked for, it was noted where exceptionally bad. The error marks were evaluated using a chi-square analysis.
The test map was created using FreeHand, using different line widths and tools [Figure 6]. Cartographically, it is a simple design with curved and straight elements. It incorporates elements that should maximize inattentive errors. The straight segments can be drawn by making points at either end. All the box features can be constructed from a series of consecutive line segments from corner points. Reference locations (Feature 1) are shown as crossed lines similar to the locational devices used on many maps at the four corners (and the cross hairs on the digitizing pucks themselves). Registration marks for the map, however, are larger than the puck crosshair and somewhat larger than the FreeHand line pointer at the normal view. [37] Errors on this feature are of completion (putting in both lines to make the cross) and omission. It must be stated again that there is a difference between the registration of PC Arc/Info and the other digitizing platforms. PC Arc/Info requires the registration of the coordinates for actual registration or copying of physical features for geo-referencing. [38] In each of the other software, while the registration has been added, it is not interpreted as a geo-referenced location. The lines placed (in FreeHand) have the same ability as a point (in FastCAD), to define an exact center point (+) of a location.
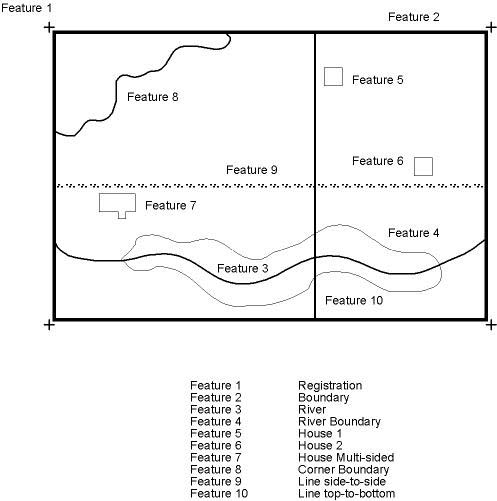
Figure 6. Map with features numbered.
Curved features are more complex and tedious to construct than those using straight line segments. They take care and patience to complete with accuracy and fluidity. The river (Feature 3) undulates gradually and is the easiest of the three to draw, followed by the upper-left-corner (woodland) boundary (Feature 8). The river boundary (Feature 4) is the most difficult feature on the map. It takes the longest time to draw. Lines from side to side (Feature 9) and top to bottom (Feature 10) display error if the lines do not ‘join’ or attach to the sides of the boundary rectangle (Feature 2). [39] Similar things can be said about the corner boundary and the river. The houses (Features 5 and 6) show error if they are not ‘closed’ or do not have the ends of the lines united. The box and rectangle tools of FastCad and FreeHand, respectively, make for perfect closure every time.
The river boundary (Feature 4) is the most complex and requires much care from the participant. Working left to right, it is usually begun on the left side, proceeding upwards across the top of the feature. At the beginning, an error is made if the line is not joined to or started on the river line. Similarly, a portion of the digitized line at the end of the feature should contact or overlap the river feature. Missing lines are infrequent due to the small number of features in the test and a constant reminder by the representation on the display screen. Errant lines or separate line segments are those that happen when an abrupt movement is made (during the digitizing) or an endpoint is inferred (by software that ends a feature with a double click on the same spot) and a new segment is begun. Dragging the puck pointer along the undulating feature and rapidly clicking the action button, creates a series of small segments instead of one longer straight line. Abrupt movements along with the rapid succession of clicks may ‘spike’ a point out of the feature path, something like an inverted V. Participants were given information to help them correct this and other errors expected to be encountered in the digitizing/revision process. Not all chose to do so however.
Observed Errors
Observed errors will not be discussed extensively, except when they are helpful in explaining the results of the test and the analysis. These types of errors were sporadically noted by the examiner on the record sheet during the testing process. Several noticeable observations about map compilation are also included here. Examples of these observed errors or notations include excessive magnification (in FreeHand), discouraged tool selection (in all software), feature error, correction, accurate use of certain tools, and personal observations about the process or reference usage.
The use of a magnification factor is unique to one software package. FreeHand, the heads-up illustration software, allows the user to zoom in on the image portrayed, to the pixel level if need be, allowing for the correct placement of the tracing line. The zoom can be manipulated by a window toggle at the bottom of the page (showing a percentage) or it can be chosen as a tool from the Tool palette or toolbox. With the tool as a pointing device, a user drags to select an area while holding the left mouse button or he (she) simply clicks over the area to be enlarged. Upon the release of the button, the area chosen is enlarged into the view. A right mouse click zooms the view back out. To complete the test effectively, some use of magnification was thought necessary. [40] Excessive use or abuse, however, suggests a micro-management of the image and what can only be otherwise termed ‘a click happy nature.’ Micro-management occurred when the individual zoomed in to make the feature to be traced several times larger than the line they were digitizing. The line was placed across the limit of the visible view and the image was either panned at the same resolution or zoomed out and in several times before digitizing resumed. This could be repeated several times or every time depending on the individual’s cognition. Being ‘click happy’ is a state of mind, child-like in the fascination of action/reaction. Many got lost in the act of clicking in and out, trying to discover where they were in the image or hoping to find the perfect view to use to digitize the next object.
Several tools were discouraged from use after consultation with the Delphi group. One example is the FreeHand tool. This interactive drawing tool, chosen from the tool palette and activated by a left mouse click-and-hold, transfers all movement from the mouse at the time engaged, to a line; ending when the ‘hold’ is disengaged. It was judged unsuitable for the present exercise because of the inaccuracy involved with use and the poor product that resulted, even for the trained professional. Several persons tried to use the tool during the test and a notation was subsequently recorded. More important, time was wasted on the attempt and each feature was almost always deleted. Other tools discouraged included things like Spline in FastCad and the square of PC Arc/Info. [41]
Feature error occurs when a participant makes an error when making or beginning a particular feature. Usually it is noted that an error occurred, the tool that was used to create and remove it, and the time it took (if possible). [42] Corrections themselves were recorded when done. Accurate and inaccurate uses of tools were noted when recognized. Examples of this include the making of a double box for the multisided house (Feature 7). Only test subjects thinking of true accuracy would recognize the small inward slant of the small rooms’ ‘wall.’ Another notable example is the registration (tic) marks. They appear on the map as crossmarks in the four corners. Most participants placed them as similar symbols in the FreeHand example. In FastCad one of the primary tools is the point symbol. A majority of the subjects opted to use it in place of the two intersecting lines. There was no demerit for its usage, as long as all four tic marks appeared on the finished compilation. PC Arc/Info used a similar point symbol input, but registration notation (text) was entered along with each point symbol.
Notations of reference usage were spotty at best. They include when during the procedure they looked at the reference and how many times references were utilized. Common elements of the reference notation show re-familiarization with references to removal of mistakes and tool selection.
Task =Time = T Test
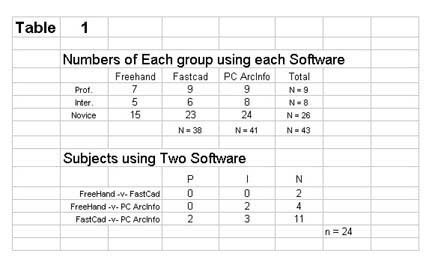
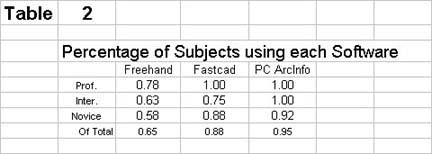
Once the time data were broken down into the individual components, [43] t tests were conducted using the framework of software, ‘professionalism’, total and individual feature drawing times. The number of participants and the percentage of each group performing different tasks are shown in Tables 1 and 2. The Novices are the largest group, as one might expect in the real world.
The basic element of this inquiry was the completion times for the individual map components. The basic question is whether there was a significant difference in the amount of time, on the average, required by the different Professional levels to complete the digitizing of the individual features. This comparison was made using a t test for each feature and for pair of groups; for example, was there a significant difference between the average time for Professionals compared to Intermediates in digitizing Feature 1, using FreeHand? No. [Table 3]
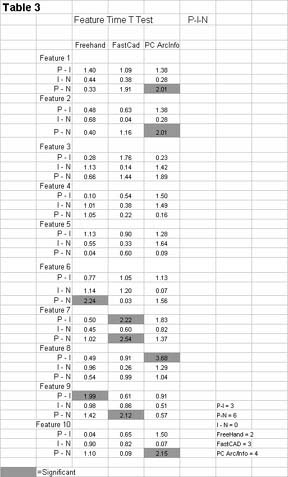
Looking at the results for the individual features [Table 3], there are only nine significant t-scores – nine significant differences – in the 90 possible permutations. [44] Of these nine, six of them show a significant difference between the Professional (P) and the Novice (N) users, as one might expect. The other three significant differences are between Professional and Intermediate (I) users. There were no significant differences between the feature drawing times of the Intermediate and the Novice users. PC Arc/Info accounts for four of the nine significant differences, followed by FastCad and FreeHand, three and two differences respectfully. The fact that only 10 percent of the t tests (9 of 90) indicate a significant difference points to an overall lack of difference in performance for Professional, Intermediate and Novice individual feature times for the individual software packages.
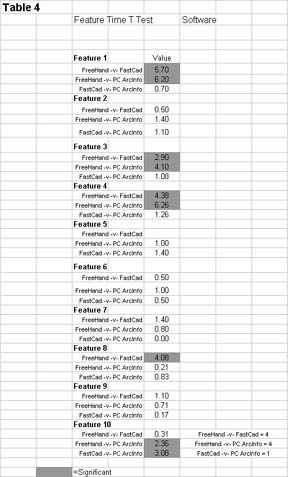
Building on this, the ten feature times were tested for significance by software looking at any differences, in general, between the software ignoring the PIN grouping. The results of these tests are shown in Table 4. From this table, with 30 possible significant differences, roughly thirty-percent (9 values) are significant. Of these nine significant values, eight of them involve comparisons between FreeHand and the other two software. [45] Significant values are found between FreeHand and both PC Arc/Info and FastCAD, in features one, three and four. [46] Feature 8, the corner boundary, shows a significant difference between FreeHand and FastCAD again. Feature 10, the road representation from top to bottom, shows a difference between PC Arc/Info and both FreeHand and FastCAD. From this result there appears to be a clear difference between the time involved in the use of FreeHand and the other two software packages.
This difference is highlighted again when viewing the graphs of the average performance times per feature for the Professional, Intermediate and Novice groups [Figure 7 A, B and C]. Most features show dramatic differences in the amount of time taken to draw than using the different software. Note the difference between the times for all three Professional groups in Features 1, 3, 4 and 8.
Figure 7A. Average feature times.
Figure 7B. Average feature times.
Figure 7C. Average feature times.
Finally, it was time for the most generalized time test pitting map completion times from each software head to head as a whole. There was little significance in the test between FastCAD and the GIS representative, PC Arc/Info (0.10). There was however a significant difference between FreeHand and both FastCAD and PC Arc/Info. [47] Figure 8 A, B and C are graphs of the average completion times, map errors and observed error (by PIN) for each software.
Figure 8A. Average completion times.
Figure 8B. Average map errors.
Figure 8C. Average Observed errors.
Maps = Errors = Chi-Square
The resulting maps were judged according to the provisos given above; errors were determined and these were subjected to a chi-square analysis to determine if there was a significant difference in the number of errors for the software and the Professional groups. Two areas of relationship were explored, comparing the software and the PIN groupings. The initial analyses compared software data according to the ‘professional’ groupings, with the number of errors totaled by software for each ‘professional’ group. Later the PIN groupings were compared according to the software framework. ‘Observed error’ scores were also subjected to the chi-square analysis. Their usage will come in the discussion, to aid explanations of any tangible results.
The chi-square analyses were administered according to the design set out by Paul G. Hoel in Elementary Statistics, New York, John Croley, 1960. [48] It was conducted weighting each group ‘error sum’ by the number of participants from which it was derived. The results of the Chi square calculations can be seen in Table 5.
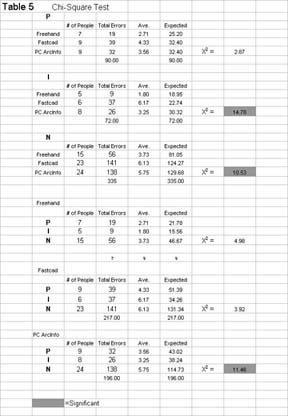
The chi-square results show significant differences in three out of the six possible combinations for the three software and the three PIN groups. Looking at the groups first, there are significant differences for actual compilation errors in the Intermediate and Novice comparisons. There are no significant differences shown in the Professional group.
The lower calculations show the results of the software comparisons of the PIN groups. Only PC Arc/Info shows significance with a value of 11.46. The contingency table of software and user group also shows no significant differences.
Specific Examples
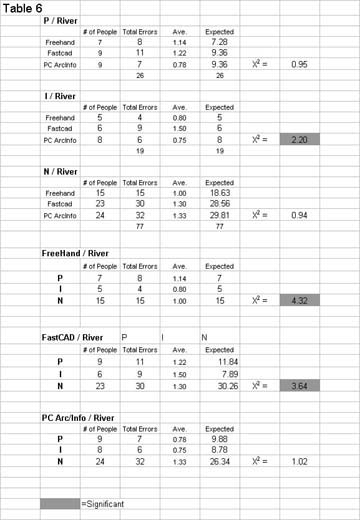
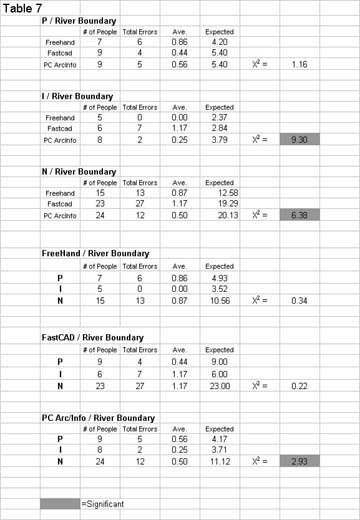
As a last element of inquiry, similar features were compared by error and chi-square looking again for significant differences. By looking at specific examples of individual features it might be possible to draw several conclusions about the presence of the significant difference scores of both the t test and the chi square results. It was decided to use the River and the River boundary for this approach. These two features are dominant in the map and are the most time consuming. They are also repositories of the greatest range of marks (observed and map) for the chi-square analysis.
As mentioned before in the reference to Table 3, there is no significant difference in the t test values associated with the software groups and PIN comparisons in the river and river boundary categories. There are, however, significant differences between FreeHand and the other two in both the river and river boundary features of Table 4. Only the comparison of FastCad and PC Arc/Info is not significant here.
After constructing chi-square calculations for the PIN groupings and the three software by feature (r, rb), of the three possible significant values there are only two that test positive for map error differences. The results of these tests can be seen in Tables 6 and 7. These significant differences are comparisons of the scores according to the Intermediate and Novice users. There were no significant differences detected in the software comparisons of the PIN scores. Looking at the observed scores, significant differences are found only in the P and I comparisons of the software.
The Test and Procedure
The test procedure worked quite well. After introductions and mutual coursework acquaintance, the process of cartographic, geographic and software introduction flowed much like a rehearsed script. Each conversation evolved through the information required depending on the education and course background of the participant. External props were limited to the 7.5-minute quadrangle, drawn at random from a map file present in the graduate room. At all times, the participant was encouraged to state any misunderstandings or ask for more information on a given idea or point. At each stage of the procedure, the participant was asked if there were any questions or clarifications needed. By asking and making certain of their understanding, the examiner was able to ensure seriousness to the task by the participants, while establishing an insight to the participants’ lack of comprehension. This insight is most useful in recognizing a necessity to reintroduce a concept (or portion of software) again.
While being introduced to the software, the participant was handed the introduction sheets and asked to read them through before restarting the discursive learning process. After finishing the reading and before many questions had been asked, the participant was instructed to manipulate the software and interface. As each relevant item or portion was introduced verbally, it was reinforced by recollections from the reference sheet. Wording and verbal terminology were maintained from software to software. [49] As each practice element was drawn and removed, the subject was evaluated for fluency and familiarity with the introductory software experience. Many of the participants eagerly accepted the different looks and feels of each software approach after a few sample entries.
The test usually proceeded smoothly, from start to finish, with little or no conversation. [50] Often the test proceeded so quickly and methodically that the researcher barely had time or cause to make any extraneous notations. [51] The ‘frantic’ and cryptic script of this recording action can be seen in the sample in Appendix A. After the last element was placed and the end time recorded, the participant was asked a series of follow-up questions about the digitizing experience he (she) had just completed. [52]
Initially, they were asked to recall any mistakes they had made and, through understanding these, submit cautions to the next participant. In FreeHand, it was most often a further caution not to use any of the discouraged tools or an admonition to not zoom around too much. In FastCAD, the most often encountered subject was the anchoring problem mentioned above. Useful suggestions usually included an admonition to look at the screen more often to watch for the feature to be anchored. PC Arc/Info hints were directed towards the differentiation of arcs and nodes, watching the screen and the necessity of more points along a curved line.
They were next asked about their errors and whether, if they chose to do so, they were easy to fix. Most found that in FreeHand and FastCad the error correction (in most cases a deletion and replacement) was straightforward and efficient. In PC Arc/Info, however, there was a bit of a learning leap to overcome in the menu-submenu system. Few persons had encountered a menu system like the ADS. [53] Surprisingly, few people made mistakes that they could not or would not remove.
After this, they were asked a few follow-up questions about their likes and dislikes of the software as a whole. Finally, if given the chance to digitize the map again, would they do better? Unanimously, they assured the researcher that they would.
The Outliers
As stated above, there were three outliers removed from the dataset. Each had special circumstances or excessive scores that necessitated their removal. Subject 44 was a gentleman with a slight case of cerebral palsy. His compilations were understandably full of errors and inaccurately placed line segments. While it was important to let anyone willing to participate do so, it was not necessary or proper to include the presence of these mistakes. Gentleman 45 was another instance of too much time taken and too many mistakes made. This person was an older man wanting to retrain himself for a different career. Participating in the procedure was more of a learning experience with computers (he had never operated one before this) that an attempt to properly complete the assignment. The total time of his examination exceeded by 3 times that of any other participant. Individual 46 was a young man about 20 years of age. While his times and most of his performance were adequate, there was a sense that he did not have the inclination to do well. During the FreeHand test he visibly saw errors in the river and river boundary (broken and ‘spotty’ line segments) that were by no means connected or continuous. Errors were calculated and those attributed to him exceeded 27 for the river and 39 for the river boundary. These were ten times greater than any other participant.
T Tests
As stated in the results, t tests for significant difference resulted in only 9 out of ninety possible combinations for a ten-percent significance rate in the P-I-N –v– Software feature test. [54] Six of these nine differences were between Professionals and Novices. Three were between the Professionals and the Intermediates. Notice the lack of significant difference between the Intermediate and Novice groups in time of performance. On this basis, it seems clear that there is little difference between these two (I-N) groups.
In looking at the features where significant difference occurred, several conclusions can be drawn. In Feature 1, the registration (tic marks), the significant value is a t test of P-N times using the PC Arc/Info system. As stated before, this system required several extra steps that could only be simulated in the other two. In both FreeHand and FastCAD, the numerical ‘grid’ system was not needed or demanded up front, [55] nor was the visual field boundary delineated. Furthermore, many of the Professionals in the study had some coursework or experience with Arc/Info at one time or another during their years at KU. In essence, they had a working knowledge of the procedures and relied on the handouts and the experiential run to reinforce these procedures. Many of the Novices, on the other hand, had never experienced the interface before. Many had probably never experienced a visual and procedural setup like that of ARCEDIT. This lack of ‘experience’ was hard to overcome in the long run. Only a trial run of ‘tic’ input with the numbers could ensure that the subject would get it correct. The subject was allowed to practice the input of tic marks several times. Delineating the viewing area (PC Arc/Info) was grouped with the ‘tic’ input. The Professionals moved to the registration point, punched the numbers, then the mark, and moved to the next. Many of the Novices and some Intermediates, on the other hand, moved and punched more slowly, looking back and forth at the screen between actions. Experienced users should be more acclimated to the procedures necessary for the task and may not be as hesitant to carry out the task using slightly different tools or software.
The Feature 2 PC Arc/Info difference was with the boundary or neatline of the map. It can be attributed to similar circumstances as above, to the experience and diligence of the Professional group. Feature 8, the corner boundary, in PC Arc/Info provided the third significant P-I difference. This again is a potentially time consuming element. Feature 10 is the straight line running from top to bottom. The difference here could be a technical one, a lack of connection (placing a vertex instead of a node to end the line).
In FastCad, significant difference, in Table 3, occurs at Features 7 (P-N and P-I) and 9 (P-N). Feature 7 is the multisided house and 9 involves the line(s) from side to side on the image. Both the Novice and Intermediate groups tested significant against the Professional for Feature 7. This could be significant for errors in the pointer mentioned above or the perceived complexity forced a slow deliberate carefulness, thus taking more time to complete. Feature 9 could be the pointer problem again.
With FreeHand, there were the fewest significantly different responses. The significant responses are in Features 6 (P-N) and 9 (P-I). Feature 6 is the second square house (counting from the top of the map). This could be accounted for in either the use of the line tool instead of the rectangle or in an errant early recording mistake. [56] In all, we see significant difference between the times of the Professionals and both the Novice and Intermediates as one might expect in the real world. Software wise, here at this ‘minute’ level there seems to be a large contingent of P –v– N difference in PC Arc/Info.
In the more general test of the software [Table 4], thirty percent of the 30 results tested significant for a relationship. [57] Of the nine values this encompassed, eight were positive relations between FreeHand and the other two software. Significant differences occurred in Features 1, 3, and 4 for both FastCAD and PC Arc/Info in relation to FreeHand. In Feature 8, the significance was between FreeHand and FastCad. In Feature 10, the significant values were between PC Arc/Info and FreeHand.
Feature 1 is the set of registration marks, where many in FreeHand zoomed in and out or in and panned across the expanded image wasting valuable time. In the digitizing tablet examples, two lines crossed and point placement with no zooming led to fast registration entry. Even with the added numerical designation of the registration points in PC Arc/Info, the FreeHand tics took longer. [58]
Feature 3 is the River. FreeHand again could be cited for the use (and abuse) of the magnification tool (in fact, any of the significant differences could be due to this unique characteristic). Feature 8 is another example. Many participants zoomed in to one end of the line and then moved along its length by panning. Feature 10 is harder to explain, as it pits PC Arc/Info against the other two. This is the line from top to bottom. It is quite possibly accounted for in the node–vertex differentiation mentioned above. [59] The observed errors could account for some of this discrepancy.
These results suggest that FreeHand is beginning to show far more significant differences between itself and the other two. This growing supposition is again highlighted by the composite t test of the three software also mentioned above.
Chi-Square
In the chi-square analysis the major significant difference is in the software scores of the Intermediate and Novice. This somehow should be related to their familiarity with the software and the computer interface. Although we cannot from this calculation point out one or another of the software for specific responsibility, we can say that there is a difference. Looking at the software side, comparing PIN, only PC Arc/Info shows up as significantly different. These scores, it was decided, were due to a concentration level eluded to above. Professional cartographers can ‘hone in on the task,’ so to speak, and move from one element to the next with little hesitation or interruption. Several of the Intermediate users were able to similarly concentrate. Novice users tended to be hesitant and less sure of finishing in the shortest amount of time. Some were able to match the Intermediate and Novice, but the majority to the extreme, tried several of the discouraged tools and were ‘click’ happy. Micro management and trying to find the perfect view also costs several Novices crucial time.
While there are no significant differences shown in the Professional group, there appears to be some significance in the observed error review. This could be an indication at relaxation and/or easement with the software to the extent that a professional could and, more often, would repair an apparent mistake.
In terms of the software chi square test, virtually all of the combinations (LNJ and observed error) show no significance save that of PC Arc/Info. Perhaps the high number of Novice error outpaced a normal upward trend. In all, there was significant difference in PC Arc/Info as a software and significant difference in the times between software of the Intermediate and the Novice groups.
Appendix 1 contains graphs of the average feature completion times, average errors, and average observed errors during the testing process. [60]
The results of these tests show some significant differences for time taken in the production procedure but little difference in the overall outcome as reflected by the errors on the map. The times highlight a difference of interface; not that one software is superior to the other two, but that one software if different from the other two. This difference is one related more to hardware rather than software.
The differences in the map completion times suggest a distinction between FreeHand and the other software. The graphs display the difference dramatically, both for each software in general [Figure 9] and for the individual features pointed out above. In looking at the graphs in Appendix C, though there are significant fluctuations in the time variables, there is little or no noticeable height advantages or disadvantages in the map or observed feature error bar graphs. This is due in particular to the heads up style of digitizing. FastCad and PC Arc/Info both utilized the “static” display of the digitizing tablet. There was no zooming in or out, no micro-management of the drawing that was so time-consuming in FreeHand. The participant started on the drawing and continued from one feature to the next in rapid fashion.
In some ways, the study was biased. If total equality was desired, then one would have had to attach a digitizing tablet to FreeHand or would have had to use a background image in FastCAD and PC Arc/Info. Either way, some significant changes would have been made to the process of introduction, enabling more of an information overload. Changing the process would have made for different starting procedures and file manifestations. [61] Therefore it was decided, and perhaps rightly so, to use the products in their ‘natural’ state.
FreeHand clearly took longer to complete the exercise. Map or compilation errors were on average less than for the other two software in each user group, but observationally, the errors noted were higher than for FastCAD and PC Arc/Info. The lack of errors in the compilation could be traced to either the snap-to distance default of the software (>90% probability) or the magnified connection made by the micro-managers (10% or more probability). No real look is taken here at the productions for mapping accuracy; that the lines were placed in the general location and with general fluency was enough.
Connection of elements may be related to the size of the lines. If the participant sees the center of the line as the object of the exercise, he or she will trace the image from the center of one line to the center of the next. However, if the line is started or ended at the outward-most edge of the feature then there will most certainly be a gap if the snap distance is not set large enough. With no closure, the location will get noted as an element or line not joined (LNJ). Often these LNJ occur at the beginning or ending of a line. FastCAD’s peculiarity of needing a precursor click often causes an operator to believe that the line has been started. Subjects start moving along the feature eventually starting the line on the second press of the activation button leaving a telltale gap. In expectation of this particular situation, the participants were instructed several times as to the double press situation. [62]
The goal of setting up a structure to test the software was achieved over several iterations. The test process was accomplished, with 19 persons completing tests using three software and 24 working with two of the three. Each participant digitized the same test map on different ‘platforms’ after completing a self-limited training period. Neither the structure of the tests, the order of tests (software), nor the order of feature input was regimented to restrict individual choice. Random daily assignment of the tests to be conducted was made before any testing began. In doing this, variability of the test data was increased; if every participant had completed the test program in the same way, there probably would be less proactive and retroactive interference. No participants quit the exercise, although the total time spent lasted from 45 minutes to over 90 minutes. [63] Many of these participants had little or no experience working with or drawing on a computer, much less with the concepts and realities of digitizing. So, to have had them all complete the task that was asked, plus the pre- and post-information sessions, is distinctly a plus. Looking at the ‘professionalism’ scale, there are some possible changes. Respondents were categorized (grouped) during the analysis period and were grouped merely by name recognition and participant mention, not by proficiency. If the study group had consisted of more volunteers, most could have been asked questions and given exercises to insure that they had the skills to make them a professional or an intermediate. With the pool of participants such that it was, it mattered only that they were interested in and willing to complete the exercise.
This was an experiment to see, first if a procedure such as this could be done. Could a study of performance time and accuracy actually be used to assess software? The exercise indicated that it could. Are the results of this paper significant? Perhaps, in a leading way. Both the results and the procedures could be built upon to follow several new leads. One thing that was not discussed in depth was the amount of follow up involved at all stages of the process and the existence of the post-test questions. These were lightly touched upon and can be seen scribbled in the single example in Appendix A. Many of these questions deal with immediate hints of warning to the next participant, likes and dislikes of the interface, and rankings of the software according to certain personalized criteria. These data will be analyzed in the third part of this trilogy.
Another thing not touched upon here is the notions of order and proactive versus retroactive interference. These types of interference occur involuntarily from the use of one software before or after another. Proactive, if the next platform is similar (both of the digitizing tablets in a row perhaps), then the subject logically would do better than the previous time. Retroactive interference would occur if the participant used the tablet and then the heads up; then there might be some carry over from one to the next that could be detrimental. A case in point is an outlier, subject 46. This gentleman, also mentioned above, began the exercise with FastCAD, then went to FreeHand. Now, in and on most digitizing tablets, you begin a line string by starting it (in FastCAD parlance, anchoring it), then slowly dragging the crosshair along the feature, tapping the ‘active’ button to place line segments as you move. Even the smallest movement is enough for the tablet to catch. A point in the same spot is placed in FastCAD with no regard to being on top of itself. In PC Arc/Info a ‘beep’ from the computer signals redundancy and no point is recorded. In this instance, the participant carried this type of interaction over to the FreeHand platform and its line tool. FreeHand reacts differently to both the distance and the mouse clicks. If a point is pressed too close to another in FreeHand, the software considers it to be a double click and it ends the feature, i.e., finishes the line segment. This is precisely what occurred time and again, yet, it was not compensated for, or corrected, by the participant. [64] This example of retroactive interference and the possibility of crunching the available data to look at this also is an avenue for further exploration. Though an order record of the test procedure was kept for every person, it also is one part of the sheer magnitude of data recorded, but not reported.
The lack of significant differences in time and error could also be influenced by the researcher’s interactive involvement. During most of the Professional and Intermediate tests, the researcher quietly kept record and notes about the ongoing activities. On occasion, when perceptual stress was growing on the part of the participant (usually after a mistake or when he or she forgot the nuance of a tool), the researcher would utter one or two key words to help the participant remember an action or an interaction that would ameliorate the situation. This event was noted and even the words were recorded. Though this happened infrequently, it was considered a necessary part of the process so that the project could be completed in an easy and relaxed manner. This “coaching” occurred primarily in the Novice group. It should be considered more of an encouragement than anything else. During the practice session the participant was not allowed to do too much digitizing of the map. If done, this would qualify as an ‘independent experience’ and skew the data. For this reason, the tools were shown, but only for their relevance for activation, length and flow. Never was a participant allowed during the learning/practice session to trace a complete feature on the map until it was time to do so, during the actual test.
Another thing not mentioned strongly enough was that the observed error not only strengthened the testing procedure, but helped the participants as well. Observed errors gave the researcher an ability to tweak or change an item either not clear in the reference materials or not emphasized enough during the training session to change or influence behavior. Observed errors also helped to explain some of the graphic representations presented above.
Though there was no striking pattern of significant difference in the t tests or the chi-square analysis, there were a few instances. Many of these involved FreeHand. In the Feature times test, Table 4, eight of the significant results were between FreeHand and the other two software. In the more general t test, looking at the test completion times, FreeHand times were found to be significantly different when compared to both FastCAD and PC Arc/Info. [65] However it is not that much a variation from the significant difference of PC Arc/Info in Table which show 5. In the Chi-Square it is PC Arc/Info that comes up showing some significant difference in the general software comparison (Table 5) and the river software comparison (Table 6). FreeHand does show up again in the river boundary chi test.
Without a stronger showing in either Table 3 or 4 it is hard to come to a concrete conclusion and to state which software is better or which is worse. When judged on the whole though (using the t test, chi-square analysis and the average times) it appears that there is some inkling of suspicion towards FreeHand being different. Without more testing, however, no strong conclusions can be drawn. This difference can, perhaps, be attributed to hardware and not to software.
In terms of professionalism, the study can be considered a validation of sorts. Both the t tests of Table 3 and the group chi-square tests of Tables 5, 6 and 7 indicate the presence of significant differences associated with the Intermediate and Novice groups. The results of Table 3 can be seen to strengthen the supposition that there really is a difference between the Novice and the Professional.
In all, the conception, process, execution and analysis portions of this project went as well as planned, with few exceptions. The learning achieved by the researcher, as an experience, was perhaps the most important outcome by far. To have spent nearly an hour per person, explaining geography, cartography, computers and their physical application was invaluable. Watching the learning process evolve in the Novice mind was an insight into interpersonal communication and human factors one cannot learn through class or a textbook.
To those who participated, I am forever grateful. To George and Karen, who read this so many times, I can never be grateful enough.
Further study
Rest assured that a great deal of data has been kept for later analysis.
Appendix A
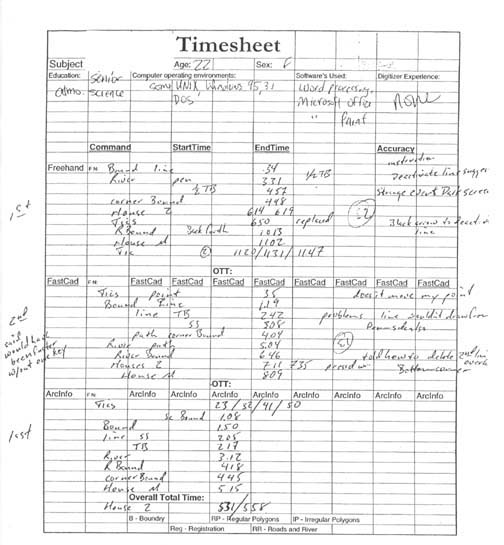
Timesheet example from one of the participants.
Post-test questions example from one of the participants.
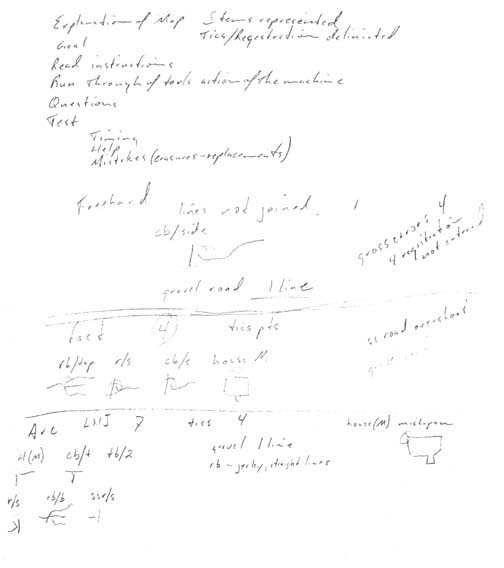
Critique of compilations from one of the participants.
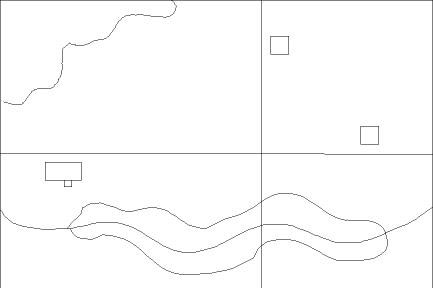
Same participant's FreeHand map.
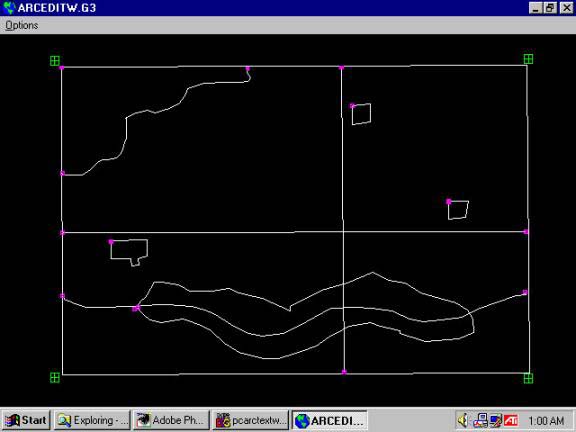
Same participant's PC Arc/Info map.
Same participant's FastCAD map.
Blank questionaire.
Appendix B
The following is a reformatted version (done for ease of web viewing) of the reference sheets handed out during the testing process. The actual handouts were double columned, more font differentiated, and more enhanced in their use of bold, underline and italics.
Aldus Freehand is a drawing program used by many to make maps. The process of making a map usually starts with the scanning of a particular ‘base’ map or drawing for reference. After bringing the scan file into Freehand (and placing it into the background layer), one then traces over the individual features usually separating them into thematic layers. These subject layers are used to separate these features by ‘category’ (e.g. roads, rivers, and forests) with each ‘category’ in a separate layer.
For the purposes of this study, much of the pre-processing work has already been done. The scan has been made and it has been placed in the BACKGROUND layer. The FOREGROUND, your ‘working layer’, is active.
Your objective is to be as accurate as possible tracing each line and closed shape in a minimal amount of time. The ‘plus signs’ or ‘crosses’ at the Four Corners of the image are the registration points and will be used later to align the image to real world coordinates. They must be traced as well.
You may use any tool available, but are advised to use the tools and icons listed below for simplicity and efficiency.
![]()
This is the ARROW icon. It is a general use tool for feature selection, activation and manipulation. Use it to select features for editing (move, cut, and delete) in one of the three following ways:
ACTIVATE- Click once on an object to activate it (make it’s points show). Then you can delete, move, or use some other tool on the pallet to manipulate it (Rotate, Mirror, and Cut).
MOVE (whole) - Click and hold down on the feature. Drag it to the desired location.
MOVE (point) - Click once to activate, then when the points are showing, click on the point, then click and hold on an individual point to move it
![]()
This is the LINE icon. It draws straight lines. Upon activation, the pointer becomes a ‘crosshairs’ or ‘plus’ sign. Place this ‘crosshairs’ at the desired location to begin a line. Hold down on the left mouse button and move the mouse in the direction you want the line to go. When you let off on the mouse button, the line ends and an end point is made. If necessary in the same place, click, hold, and draw again; by doing this another line is made attached to the endpoint of the first line. This tool will be active until you select the ARROW pointer or other tool from the tool pallet.
![]()
The RECTANGLE tool works in much the same way as the LINE tool (turning into a crosshairs, holding down while drawing to the desired location, ending when you release). Beginning at a corner point, hold down while going to the diagonal opposite corner of the box. Let off to end the feature.
![]()
The namesake FREEHAND tool differs from the others in that it is not a stiff line segment as the other line and box tools make. It results in a series of line segments following every twisty and turvey route that the clicked (and held down) mouse leads it. This tool also ends when the button is released. CAUTION every move is translated to the line.
![]()
The PEN tool lets you draw shapes and lines easier than usual when using the Freehand tool or the LINE tool because you simply point and click to add segments of a line. If you point click and hold you can even manipulate a curvature to the line. a starting point and then click instead of click, hold down and draw out.
![]()
This is the MAGNIFYING tool. The screen magnification percentage appears in the lower left corner.
WITH MAGNIFICATION TOOL
![]()
Zoom in Click left mouse. (Doubles current magnification.)
![]()
Zoom out Press Alt + Click left mouse. (Half the current magnification.)
Zoom to Selected Area Click, hold and drag a box around an area.
WITHOUT MAG TOOL / ANYTIME
Quick Zoom In 1st right mouse click.
Quick Zoom Out 2nd right mouse click.
![]()
GRABBER Hand. Pressing the Space Bar makes it appear. Use a left mouse click to grip, drag and move the page about on the screen.
IN CASE OF ERROR, several things can be done:
1) Go to the pull-down menu EDIT and click on UNDO to ‘undo’ things (errors) in a reverse-order. Mistakes can be DELETED and CUT from the view as well.
Control + Z = Undo
2) If the line or feature is too long or not long enough, use the ARROW pointer to activate it (so it’s points are showing), grab a point (click and hold), then drag it or reduce it to what is desired. This can also be done to RECTANGLE corners or the individual points of FREEHAND and PEN lines.
Arc/Info is the name of a Geographic Information System (GIS) application for making maps and representations of geographic features. Using the Arc Digitizing System (ADS) we can input the data through the use of a digitizing tablet. An image or design is taped to the board securely, then a puck or ‘mouse with number keys’ is used to trace features desired for transfer into a digital electronic database.
As the name implies, Arc Digitizing System (ADS) favors the drawing of arcs (lines beginning and ending with nodes).
On beginning ADS, you will be given a request for Tic Id’s. A minimum of four of these tics, or registration locations, is needed to coordinate the image itself and to subsequent additions. Use the digitizer number pad and cursor to enter both TIC-IDS and tic locations. With the puck placed on the tablet with it’s crosshairs over the center of the registration mark: Key in the TIC-ID number: 11
Followed by the ‘A’ key on the puck.
This records the ID.
Press ‘A’ again to record the location.
Arc then asks for the next TIC-ID. Move the puck to the next Registration / tic location. Key in the TIC-ID followed by the ‘A’ key on the puck keypad. Press ‘A’ again to record the location. Continue until all registration points are digitized. To stop digitizing TIC-ID’s, press ‘0’ on the puck, followed by ONE ‘A’ on the puck.
If a mistake is made, you can use the Backspace (puck ‘B’ key) to correct the TIC-ID before pressing A. If you realize a mistake after pressing A, proceed to the next point, we can remove the bad one later.
Sample Beginning Session:
DIGITIZER TRANSFORMATION
Digitize a minimum of 4 tics.
Signal end of tic input with a tic id 0.
(1,1) (1,2)
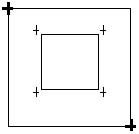
(2,1) Figure 1 (2,2)
Tic id: 11(A)(A)
Tic id: 12(A)(A)
Tic id: 21(A)(A)
Tic id: 22(A)(A)
Tic id: 0(A)
(Wait for prompt.)
When you have completed entering TIC-ID’s, Arc/Info will prompt you for a boundary. This boundary is basically a viewing area on the monitor. The dotted line on Figure 1 (below left) suggests its placement.
Enter first corner of boundary
We want this to be well beyond the borders and registration marks of our map. Place the first point of the corner boundary below and away from the lower right registration mark. Press A.
Enter opposite corner of boundary
Place the second point above and to the left of the upper left registration mark.
Press A.
When the ADS screen below appears, you are now ready to begin adding the features of the map.
Arc Digitizing System (ADS)
1) Add Arcs 3) Add Labels 5) Draw Coverage 7) Add Tics
2) Remove Arcs 4) Remove Labels 6) Define Window
8) Set Options 9) Exit Enter Function:
Above is the main menu of ADS. From here you can go to many different sub-menus, each with it’s own set of options. The sub-menus that concern us here are:
1) Add Arc
2) Remove Arcs
5) Draw Coverage
DIGITIZING AN ARC. To digitize an arc or line we enter the Add Arcs sub-menu by pressing 1 in the main menu. This opens the Add Arcs sub-menu below:
1) Vertex 2) Node 3) Curve 4) Delete vertex
5) Delete arc6) Spline on/off 7) Square on/off 8) Digitizing Options 9) Quit *) Stream on/off
(Line) User-ID: 1 Points = 0
[Press] 2----1------1------1----------2
Position the cursor at the starting point, press the 2 key to place a node and start the arc, then move along the line you are digitizing, pressing 1 each time you want to enter a vertex or length of line. At the end of the feature or line, press a 2 to place the END node and end the line/arc. Upon completion of an arc you can attach another vertex to that node (by pressing a 1 again in the same place) and go on from there or you can move the cursor to another place and begin a new arc or feature starting with a 2 again.
REMOVING AN ARC BEFORE PLACING AN END NODE. An arc can be deleted in the Add Arcs menu by pressing the 5 key before you place the end node. A vertex can be deleted using the 4 key.
REMOVING AN ARC AFTER PLACING AN END NODE. After the arc has been entered (node to node) it can only be removed by using the main menu’s Remove Arc choice. From the Add Arcs menu press 9 to Exit the sub-menu, taking you to the main menu:
Arc Digitizing System (ADS)
1) Add Arcs 3) Add Labels 5) Draw Coverage 7) Add Tics
2) Remove Arcs4) Remove Labels 6) Define Window
8) Set Options 9) Exit Enter Function:
From here, press 2 to go to the Remove Arcs menu:
1) Select 3) Who
2) Next 4) Remove 9) Exit Sub-menu
Put the pucks crosshairs in the general area of the undesired feature. Press 1 to Select the feature you want to delete. If it is the correct feature then press 4 to Remove it and return to the main menu. If it isn’t the right one, press 2 to go to the Next feature in the cursor selection area. If pressing 1 isn’t making a selection, move the cursor slightly to make a different search area. Pressing 9 will Exit the sub-menu without making changes.
Redrawing the drawing (coverage) after changes. To refresh the drawing and remove any remaining graphics bits after a deletion, go to the main menu below. If you are in a sub-menu, press 9 to Exit the sub-menu.
Arc Digitizing System (ADS)
1) Add Arcs 3) Add Labels 5) Draw Coverage 7) Add Tics
2) Remove Arcs4) Remove Labels 6) Define Window
8) Set Options 9) Exit Enter Function:
Press 5 to Draw Coverage (or redraw it as the case may be). You will be asked:
ARC asks You answer
Clear screen <1=Y, 2=N> 1 - the screen will be cleared before the coverage is drawn
Draw tics <1=Y, 2=N> 1 - tics will be drawn using a symbol.
Draw arcs <1=Y, 2=N, 3=IDs> 1 - arcs will be drawn.
Draw nodes <1=Y, 2=N,…> 1 - all nodes will be drawn with a symbol.
Draw labels <1=Y, 2=N, 3=IDs> 2 = no label will be drawn.
If you Exit (press 9) from the wrong menu and the application) you will be asked:
Your answer from the typing keyboard should be NO (N).
Your answer from the typing keyboard should be NO (N) again.
This will then take you back to the main menu where you can resume your task.
Arc Digitizing System (ADS)
1) Add Arcs 3) Add Labels 5) Draw Coverage 7) Add Tics
2) Remove Arcs 4) Remove Labels 6) Define Window
8) Set Options 9) Exit Enter Function:
Arc/Info ADS Menu’s: An Overview.
Arc Digitizing System (ADS) {[the main menu]}
1) Add Arcs 3) Add Labels 5) Draw Coverage 7) Add Tics
2) Remove Arcs4) Remove Labels 6) Define Window
8) Set Options 9) Exit Enter Function:
1) Vertex 2) Node 3) Curve 4) Delete vertex
5) Delete arc 6) Spline on/off 7) Square on/off 8) Digitizing Options 9) Quit *) Stream on/off
(Line) User-ID: 1 Points = 0
The last line shows the User-ID and the number of points being digitized for the arc. This will change to indicate each new arc being digitized.
Key 1) Vertex
A vertex is a ‘shape’ point along an arc, which is not at the end of the arc.
Key 2) Node
A node is located at the beginning and end of every arc.
Key 4) Delete Vertex
This option allows you to delete vertices from the arc currently being digitized. The last digitized vertex is removed.
Key 5) Delete Arc
Pressing the 5 key completely deletes the arc currently being digitized. You can press this key anytime before ending with the 2 key.
Key 9) Exit sub-menu
1) Select 3) Who
2) Next 4) Remove 9) Exit Sub-menu
Key 1) Select
Key 2) Next
If the wrong feature is chosen, use this to search for another specified feature in the cursors present edit distance.
Key 3) Who
Info about the feature selected.
Key 4) Remove
Removes the selected feature(s).
Key 9) Exit sub-menu
Takes you back to the previous menu.
ARC asks You answer
Clear screen <1=Y, 2=N> 1 - the screen will be cleared before the coverage is drawn.
Draw tics <1=Y, 2=N> 1 - tics will be drawn using a symbol.
Draw arcs <1=Y, 2=N, 3=IDs> 1 - arcs will be drawn.
Draw nodes <1=Y, 2=N, …> 1 - all nodes will be drawn with a symbol.
Draw labels <1=Y, 2=N, 3=IDs> 2 -no labels will be drawn.
FastCad is a computer aided design (CAD) package used to compile and render drawings for professional uses (municipal, engineering, and design). One feature of the software is to allow input of data through the use of a digitizing board or tablet. An image or design is taped or fastened to the tablet securely, then a puck or ‘mouse with number keys’ is used to trace the features desired for transfer into a digital, electronic database. The puck has a ‘crosshairs’ or finely drawn X on the clear nosepiece. The center of this crosshairs is the pointer and digitizing reference of the puck.
FastCad allows for both Command Line and ‘mouse click / pull-down’ menu entry. Command Line entry involves typing words or ‘commands’ from the keyboard to the COMMAND prompt on the bottom left of the screen. Alternately, using the pointer of the puck accesses the pull-down menus at the top of the screen. Click once on the menu title (e.g. Draw, View, or Copy) and then move down in the list to highlight and click the desired command. You may use either method to accomplish your task, but I suggest you type in the commands on the Command Line for simplicity and efficiency.
The only ‘keys’ active during the transfer process itself are the 2 and 1 keys on the puck and the ENTER key on the typing keyboard.
Registration. At the four corners of the image you will notice 4 registration marks, ‘X’s’ or ‘plus’ signs. These are used to orient the design to the computer for the correct placement of digitized features. They also provide reference positions for any other additions put in later from other sources. To input these locations, either place POINTS at their center or trace the crossing lines as you will the rest of the map.
PLACING A POINT. At the Command line, type Point and hit the 1 or ENTER key. A horizontal and vertical locator device appears on the screen emulating the position of the puck’s crosshairs on the digitizing pad. By moving the puck, you move the locator on the screen. Move the puck crosshairs to the desired location, center it and press 1, putting a point at that location. Each time you press 1, a point will be entered. Continue until all individual points are recorded. Choose another drawing option to end the point mode.
If you make a mistake, type Undo and hit 1 or ENTER to ‘undo’ the last entry. You can also remove the feature using the Erase command. You must reenter a drawing feature to begin digitizing again (e.g. Point).
TRACING A LINE. Type Line and hit the 1 or ENTER key. Take the puck’s crosshairs and put them over the beginning of the desired feature to be traced. By pressing 1, this drawing feature anchors one end of a line at that point and stretches a rubberband from that point to the puck pointer as it moves away. A subsequent press of the 1 adds additional points and lengths of line. When you are done, press 1 or ENTER on the keyboard and the rubberband disappears back to the last place you pressed 1. You can now move the pointer to another spot to begin a new line or you can type in another drawing method (Box, Circle, or Spline).
If you make a mistake, type Undo and hit 1 or ENTER to ‘undo’ the last entry. You can also remove the feature using the Erase command. You must reenter a drawing feature to begin tracing again (e.g. Line).
Terms listed by pull-down menu.
View Commands
Redraw - Redraws the drawing after changes have altered the color graphics.
Draw Commands
POINT - Type Point at the command prompt and hit 1 or ENTER on the keyboard. Use the puck crosshairs to center on the point you wish to digitize. Press 1 to place a point. Each new press of the 1 key will place a new point at the position of the puck’s crosshairs. Continue until all points have been digitized. Use Undo or Erase to remove errors or mistakes.
LINE - Type Line at the command prompt and hit 1 or ENTER on the keyboard. By pressing 1, this drawing feature anchors one end of a line at that point and stretches a rubberband from that point to the puck pointer as it move away. Subsequent presses of the 1 add additional points and lengths of line. When you have finished digitizing the feature, press the 1 or Enter key to make the rubberband disappear and the last point your endpoint. Use Undo or Erase to remove errors or mistakes.
BOX - This feature allows you to digitize or trace areas with a box or rectangle. Type Box at the command prompt and hit 1 or ENTER on the keyboard. At the appearance of the crosshairs on the screen, move the puck crosshairs to the corner of the feature you want to trace. Press the 1 on the puck once to begin drawing. Stretch the rectangle out to the opposite diagonal corner of the feature. Pressing 1 again ends the feature. Subsequent presses of the 1 will begin and end more ‘boxes’. Use Undo or Erase to remove errors or mistakes.
PATH - A path is a string of Lines (input the same as a Line) but considered one single entity. Upon completion it can be erased all at once. Use Undo or Erase to remove errors or mistakes.
POLYGON - This feature is similar to the path in that is one entity and is made in much the same way as the Line. It differs in input in that when it ends (by pressing the 1 or ENTER key) a line is made from the endpoint to the starting point, thus closing the polygon. Use Undo or Erase to remove errors or mistakes.
SMOOTH POLYGON and SPLINE are similar to POLYGON and PATH respectively. They are different, in that, these features curve out the rough intersections once the end is made. Straight-line segments are drawn initially only to be smoothed out upon ending the feature (hitting the 1 or ENTER key). Use Undo or Erase to remove errors or mistakes.
Edit Commands
UNDO - ‘Undoes’ the last operation whether it was the addition of a feature or the deletion of it. When doing points, Undo removes all points placed since you began adding. Type Undo at the command prompt and hit 1 or ENTER on the keyboard.
ERASE - This is the general way to remove and correct things. Type Erase at the command prompt and hit 1 or ENTER on the keyboard. This brings up the Select Entities By dialogue box below:
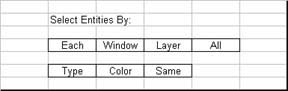
Here, use the puck pointer to select Each, which allows selection of each individual feature for deletion. Upon pressing the Each choice, the dialogue box closes and the screen crosshairs appears. Center the puck crosshairs over the desired feature for deletion and press 1 on the puck. The feature should change color upon its selection. When all the desired features for deletion are selected, press the 1 or ENTER key, to bring up to the Combine Selections dialogue box:
Don’t let your mind try to reason the meaning of this box. Simply put, YOU JUST WANT TO DO IT!!!! If you are not sure then press Cancel and begin the erasure process again.
(Type Erase… Select Each…DO IT!)
Appendix C
Registration is the single most important feature of a map for the cartographers, geographer or GIS operator. From this one defines exact position for the features represented. In FreeHand and FastCAD registration appears and exists as a graphic element of the digitized picture. In PC ARC/Info, however, registration is the physical representation of an actual locational constraint. In the above graph, one sees three series of bar graphs depicted: Time (in minutes) and Errors, both on the map and those observed by the examiner. Each series contains representatives of the three software.
In the graph, there is a large gap between the times of FreeHand and both FastCAD and PC Arc/Info. Much of this can be attributed to the use of the magnification function of the software. A great deal of the composite feature time was taken up through zooming in and out and panning around at high zoom. In looking at the physical map errors, there are no obvious differences in the highs and lows of the bars. Many of the errors associated with this feature occurred as an act of omission or completion (a lack of the second cross in the ‘+’).
The observed errors show a small amount of distinction between FreeHand and the other two packages. Much of this can be attributed to recommended tool usage.
Feature 2 is the map boundary, neatline in cartographic parlance. This feature defines the ‘limits’ of the defined space. With it the ‘sides’ of the graphic are delineated. At first glance, one recognizes the higher scores of the PC Arc/Info software. Much of this can be attributed to a particular tool or similar tools in each of FastCAD and FreeHand. The rectangle and box tools (mentioned in the text and in Appendix B) allow the user to form the features with all lines joined. In PC Arc/Info segmented, though connected, lines are used. Initially this accounts for the perceived time discrepancy. Using the rectangle tool in FreeHand, for example, in two clicks and one movement, you have delineated the figure; in PC Arc/Info, one must make a total of 5 button presses plus a total of 4 movements to make the feature. Although the four segments of the line are connected, there is the possibility of an error in closing the feature (joining the start and end points). Using the rectangle or box tools ensured a lack of this type of error. Errors on the map itself again reflect the line versus box dichotomy.
The difference in FreeHand and FastCAD might be explained in the tool nomenclature. Rectangle denotes a feature with two sides longer in length than the remaining two. This might not match the appearance of Features 5 and 6 and therefore could make the participant hesitant to use this tool instead of a more familiar line. Box, however, can be understood quickly and more often seen as utilitarian in usage for many of the map components.
The River feature is one of the three curved linear elements (and one of the two specifically covered in the text). Looking at the graph, the legend must be explained first. The now familiar time and observed errors series appear much as they do on the rest of the graphs in this appendix. The differences appear in the physical ‘map’ errors. The abbreviations r/ls (river-left side), r/rs (river- right side) and r/br (river-break) describe the state of the element placed (LNJ-lines not joined). If the feature (river line) is not joined to the right side (rs) of the boundary, then an error is marked on the record sheet. The same is true for the left side (ls) as well. A break in the line occurs when a gap, spike or space is present in the completed linear feature. An example of the cause of an error occurred in FreeHand when, by not moving the mouse (and therefore the cursor) enough that when you press the button again, the computer notices the lack of movement and ends the feature on the second click on the same spot.
Looking at the graph in particular, there is a distinct difference in the height of the bar representative of the FreeHand time. This can be explained in combination with the observed errors. The Obs errors are high primarily due to the usage of the discouraged FreeHand tool. While this tool was introduced (it appeared on the tool palette and therefore had to be defined) it was not practiced. This was a mistake. By merely mentioning the tool, several participants were tempted to try it during the exercise, thereby increasing their composite completion time in trial, error, erasure and re-input with another tool. Others used time with the magnification tool mentioned many times before.
Looking at the linear feature itself, the r/ls error of FastCAD is higher on average than the other two. This is accounted for by the anchor problem mentioned in the text and in Appendix B. The series showing r/rs and r/br show little or no obvious differences.
Feature 4, the river boundary, is the longest and most complex element on the sample map. Looking at the time series of bar graphs, it took almost twice as long in FreeHand as it did in either of the other two. Much of this is due again to the magnification and pan influence. Both of the tablet digitizing platforms performed in less time.
In general, most of the participants worked on this element from the left to the right. They began on the top left (at the attachment to the river) worked right, then crossed the river to proceed leftwards back across the center to end on or at the river line again. The error series work out with the abbreviations: r/rbt (river-river boundary top), r/rbb (river- river boundary bottom) and rb/br (river boundary break). Again we see a greater error rate in the act of beginning a FastCAD element.
In the line break series (rb/br) there appears to be a large number of average errors in FastCAD in comparison to the other two. This could be accounted for by accidental ending, spikes or errant line segments while moving at a hurried pace. It could also be an instance where the participant stopped and started the line anew whenever crossing another line.
Another interesting feature of this graph is the low average of PC Arc/info observed error. Note also that along with the lower error rates, PC Arc/Info ‘won’ the race for time when digitizing arguably the most complex feature of the map. Put altogether: accuracy, usability and efficiency point to a dominant role of PC Arc/Info digitizing.
Features 5 and 6 are copied and therefore identical except for placement on the map. A major explanation of their differences can be summed up in one word: repetition. It can be expected that with ‘experience,’ anyone can do the job better the next time. So it is with the features 5 and 6. The next graph should show shorter and more accurate responses.
For now, looking at this set of bar graphs, you notice at first the slightly higher scores of PC Arc/Info in relation to time. Once again this is due to the rectangle/box versus linear segment dichotomy (fewer movement and fewer points). With concern to the other two graphs, the lack of error sticks out for FreeHand. This could not only be an intrinsic understanding of the rectangles usage, but could also signify repetition (learning) after the experience of making the neatline.
Feature 6, the second square house from the top in the sample map, is heavily dependent on repetition for the scores reported. Each software improved in all aspects save one. Here PC Arc/Info still maintained a higher observed error rate. Accounting for this could be the arc-node difference mentioned in the text and in appendix B. FreeHand again shows no average errors on the map or in the observed record. FastCAD, while falling in value in the observed series, joins FreeHand with no errors in the digitized map. Repetition and experience again explain these differences.
Feature 7 is the multi-sided house, a feature with aspects designed to catch a discerning eye. Most unique is the lower protrusion or room. A closer inspection of Figure 4 shows it to not be a square as were other corners encountered. This aspect of perception often gave pause in tool selection, which along with the magnification interplay may account for some time accretion. Many of the participants chose to place the feature with a line tool, while a few choose linked boxes or rectangles. During the error tally either entry was decidedly OK as long as the representation was closed and complete. The desire and design to use the un-square corner got lost in the sheer magnitude of the project and the multitude of other recorded data.
FreeHand errors are minimal to nonexistent as one is able to zoom in, heightening the possibility that the line endpoints will be joined. The observed errors are nearly identical.
Feature 8 is the upper left corner boundary. Abbreviations of the errors are cb/s (corner boundary-side), cb/t (corner boundary-top) and cb/br (corner boundary-break). There are several interesting aspects to this graph. Initially it has been seen that FastCAD lags far below PC Arc/Info in the time series. The distance from FreeHand is not so unusual. Several things could account for this difference. Several times in PC Arc/Info participants had to remove lines that would link the end of a feature to the start of the next. Also, after having finished digitizing most of the compilation, they became relaxed and forgot to end the feature with a node. Removing or repairing an element in PC Arc/Info takes a significant amount of recollection and time. If not for this inattentiveness, I believe that the scores of FastCAD and PC Arc/Info would be more equal.
In terms of errors, FastCAD and PC Arc/Info generated smaller numbers of them with FreeHand slightly lower than both. Line quality suffers in FastCAD with several spikes and line crossing instances mentioned before. The lack of error in FreeHand and PC Arc/Info points to an understanding of feature and tool usage. Observed errors are equally as interesting as the time in some respects. High scores point to an excessive use of the magnification tool again.
Feature 9 is the road representation, from side to side across the center of the sample map. Here again, as with the multi-sided house, minute detail was inserted in expectation of experienced cartographic recognition. This detail was again lost in the multitude of collected data. Placed as two lines in the original, it should have been digitized as such again. Only a few of the Delphi even caught this distinction. Error abbreviations are ssr/ls (side to side road-left side) and ssr/sr (side to side road-right side) respectively. There was no perceived need for a line break category as points at the edges made the feature.
Feature drawing times are roughly equal with FreeHand again longer in duration due to some use of the pan and magnification tools. FreeHand errors are lower also due to the closer endpoint placement. FastCAD has a lower error rate in beginning the feature owing to increased emphasis on anchoring the beginning point.
Feature 10 is the line across the center of the map from top to bottom. It is a single line, unlike Feature 9. In terms of time, PC Arc/Info is noticeably faster. The times of FastCAD and FreeHand are roughly equal. Error abbreviations are tb/t (top to bottom-top) and tb/b (top to bottom-bottom). Looking at the bar graphs of these errors it is again noticeable that FreeHand has the lowest amount of average error. This could be accounted for by the ability to magnify or a default larger snap distance mentioned in the text. The large tb/t error of FastCAD could be a factor of the anchor problem mentioned so many times. PC Arc/Info errors are consistent in both features 9 and 10.
[1] Heads-up (on screen, all Windows), CAD (Computer Aided Design) featuring a tablet with Windows, and GIS (Geographic Information System) and DOS styles respectively.
[2] High school graduate with some college or junior college education; representative of a large percentage of the general workforce.
[3] Touch screens could be included here, but they are not yet a factor in the engineering/GIS-digitizing world.
[4] Top left line of letters on a standardized keyboard, used as a name for this keyboard arrangement.
[5] Of up to 0.001 of an inch.
[6] Base maps often are copyrighted and thus subject to permissions. This is a shady area often discussed in cartographic texts and, though subject to some discussion, has not been clearly resolved.
[7] As opposed to the manipulation side of the software.
[8] The test population was 46, but the results compiled here reflect the absence of three “outliers.” These will be accounted for in the discussion section.
[9] Part of the record sheet.
[10] Including drawing software (CAD, Illustration and GIS), Internet, word processing or electronic gaming.
[11] Peripheral devices include Cable/DSL connections, web telephone, web cams, videoconferencing equipment, scanners, scan wands, and digitizing tablets.
[12] AutoCAD, FastCAD, ArcCad etc.
[13] Bailey, Robert (1996). Human Performance Engineering. Prentice Hall, NJ
[14] A Delphi group is a learned group of professionals (here geographers and primarily graduate students) chosen at random for being in the wrong place at the right time. Each gave invaluable feedback and the project procedures were modified using their ideas.
[15] These are the 43 participants whose results are analyzed here.
[16] The members of the Delphi group are included in these totals.
[17] Straight and curved lines, boxes or polygons with several sides, etc.
[18] The rankings record sheet is the subject of a later study or paper. It should be sufficient to say that it examined their likes and dislikes of each software, their ‘parts’ and usage.
[19] See Appendix A, for an example of a completed series of record sheets with maps for one subject. Appendix B is the reference sheets.
[20] Appendix B.
[21] Primary and secondary tools were defined in minimalist ways, the minimum needed to complete the task (line, point, and area) and the features of the software that enhance performance (path, polygon, and spline). Linear features are separated in terms of tools used to draw a single straight line, primary; and a multiple line, secondary.
[22] Digitizing tablets do not have a ‘representative’ zooming capability for the background image (the taped down map) and therefore it was not necessary to introduce a zoom tool in the CAD or the GIS.
[23] Outside the edges of the map.
[24] This is used to remove errors unfixable in the ADD ARCS menu and to redraw after the deletion of arcs.
[25] Each submenu controls different actions by the software, i.e., add arcs, remove arcs, etc.
[26] Delphi evaluations were conducted in the common lab but due to scheduling and capacity, allowances were made to move equipment and hardware to an office where more control over the task environment could be maintained.
[27] The smaller 12” X 18” GTCO Ultimate with a 16-button puck was used.
[28] PC Arc/Info uses ASCII and most, if not all, CAD programs use Binary.
[29] End time – previous End time = feature time.
[30] The last to be utilized in a following paper.
[31] Using a t test, the three software yielded three results. (Software (3) = 3 t test results).
[32] Using the t test, the three Software multiplied by the Professionalism groups (3) yields nine ‘t’ test results.
[33] Again using the t test, Software (3) multiplied by the Individual Features (10) yield 30 t test results.
[34] Finally, more specifically, Software (3) multiplied by Professionalism (3) and by the Individual Features (10) yield 90 t test results.
[35] Before using clean or build in ArcInfo, for example. Many software packages have an ‘ability’ to close small gaps and join separate elements during and after the digitizing process. This ability comes in a variety of commands. In PC ArcInfo a gap, or distance between digitized elements, can be bridged by lengthening the snap-to distance before digitizing or changing the command parameters of build after digitizing. In FastCAD and FreeHand the snap distance can also be set to preference. For the purposes of this study, Default parameters were used to maintain the interface at manufacturer specifications.
[36] See Appendix A.
[37] All of the subsequent interior map elements are based on those lines. The line comprising the map boundary is the largest width of all. It is roughly twice the size of the next in succession. The river, side-to-side road, corner boundary and tic dimensions are all the same and are the next in declination. The river boundary line is next in downward size with the houses having the smallest width of all. The lines from side to side differ markedly through a use of line texture.
[38] Latitude and Longitude, State Plane or other coordinate system.
[39] However, overlap is OK. Much of it can be ‘pruned’ in the post-processing.
[40] Its use was needed to digitize the small houses and the registration marks accurately.
[41] Spline, because it changes the feature after completion, and square, because of the increased learning curve and memory overload of PCArcInfo for minimal gain. This mental overload was considered serious for this software.
[42] Only late in the tests was timeframe considered important as an individual aspect. Few error/repair times were recorded.
[43] Individual feature times (Tics, boundary etc.) and individual map completion times.
[44] Software (3) * Professionalism (3) * Individual Features (10) = 90 t test results. Table 3.
[45] Four in FastCAD and four in PC ArcInfo (26 percent).
[46] The registration, river and river boundary.
[47] FastCAD versus FreeHand = 5.23 and PC Arc/info versus FreeHand = 5.68
[48] Additional nonparametric statistics came from Sidney Siegel’s Nonparametric Statistics for the Behavioral Sciences, New York, McGraw-Hill, 1956.
[49] Rectangle (FreeHand): Box (FastCAD); Erase (FastCAD): Delete (PC Arc/Info); Line: Arc.
[50] Familiarity with the subject allowed the researcher to recognize stalemates in the subject’s thinking and to give one word ‘memory joggers’ to get them back on track. This was noted in the records as an observed error.
[51] See later notations about the Delphi group.
[52] Six questions were asked to help in fine-tuning the procedures and twelve were asked per the follow-up study mentioned above.
[53] ADS is the initial name for the ‘Arc Digitizing System.,’ the basis for PC Arc/Info digitizing. Figure 111.
[54] See Figure 9.
[55] Unlike the simple ‘Open the file’ and start running style of FreeHand and FastCAD, Arc/Info has deliberate steps to ensure registration and visual field. The visual field boundary is best presented on the PC Arc/Info reference sheet.
[56] Early in the Delphi evaluations records were not recorded as minutely as the later ones were.
[57] See Figure 10.
[58] Using simple coordinates: 1, 1; 1, 2; 2, 1; 2, 2.
[59] Nodes end the feature and are a point in themselves. Vertices are extensions of a line and not the end. If the line is not ended then a connection is made between the end of what was thought, one line and the beginning of the next. When this happened, it needed to be removed and this took precious time.
[60] It also contains a more detailed discussion of each graph and graphic element
[61] Sample additional confusing steps might be opening a certain type of file, manipulating layers, locking layers, toggling layers on and off and perhaps some sort of pan and zoom in PC Arc/info and FastCAD.
[62] Referred to as an anchor error. With the many widows allowed in a view, the first press of the mouse tells FastCAD where the digitizing is to commence and the second actually places the point.
[63] This came from an outlier and the data for this particular subject are sketchy.
[64] This was the closest to a bad interpersonal experience as it came.
[65] Reference 47.