Kelp beds along the coast of California are a vital habitat for many species of invertebrates and fishes. Kelp is also harvested by commercial and sport concerns. Until now, kelp bed area figures used for kelp harvest regulation by the State of California have been based upon hardcopy maps, displaying hand-drawn features of the kelp canopy. In the Fall of 1999, the California Resources Agency, Department of Fish and Game (DFG) initiated a project to revise a 1996 environmental document supporting kelp harvest regulations. The principal objective was to create a baseline that could be used to assess the effects of current and future use of coastal kelp. Secondary objectives included digitally remeasuring 1989 hardcopy kelp maps, establishing efficient digital methods for assessing kelp beds, and creating a digital archive of kelp information. This paper will describe the procedures and datasets assembled to-date.
The following excerpt is taken from a DFG environmental document on kelp harvest regulations (State of California, 1996) and describes the general setting of the California kelp resource. The location map shows major kelp zones along the coast, with exaggerated scale for clarity. Typically, the kelp zone lies within several hundred meters of the coastline. The largest California kelp beds off Point Loma, near San Diego, may extend over a mile offshore.
The commercial harvest of kelp is proposed statewide, in all areas defined as ocean waters (Sec. 27.00, Title 14, CCR) except where prohibited or restricted, as specified, in state parks, state beaches, state recreation areas, state underwater parks, state refuges and reserves, national parks, national monuments or national seashores. The shoreline of California is one of the longest in the nation. There are approximately 1,072 miles of wave_washed shoreline along the mainland coast, and 300 miles around the offshore islands. The mainland shore is comprised of about 354 miles of rocky headlands and cliffs; 602 miles of sandy beaches; and 110 miles of rocky beach. The only enclosed bays of significance (in the state) are: Humboldt (17,000 surface acres); Tomales (7,760 surface acres); San Francisco (320,000 surface acres); Morro Bay (2,101 surface acres) and San Diego (11,500 surface acres).
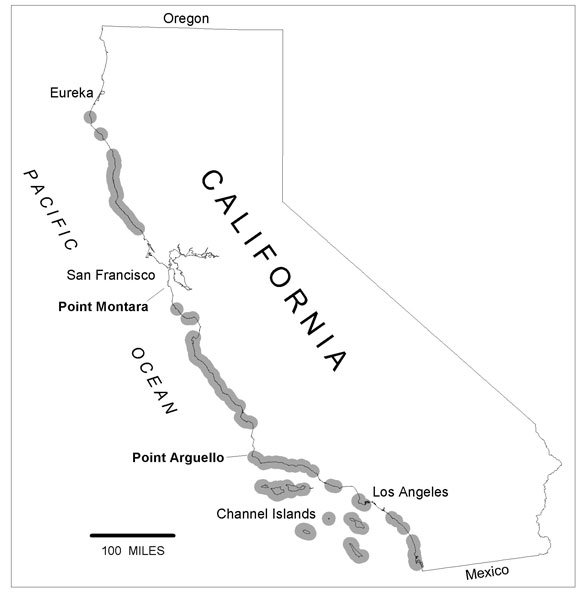
In southern California, kelp beds are primarily composed of giant kelp (Macrocystis pyrifera) while the beds along the central coast are a mix of giant and bull kelp (Nereocystis luetkeana). Bull kelp dominates the beds in northern California (Dawson and Foster, 1982; Foster, 1982; Ecoscan, 1989).
A number of previous efforts have contributed to the current state of knowledge and information on the California kelp resource. This treatment is not intended to be exhaustive, but rather to give some indication of the availability of relevant material.
Among the earliest references to kelp surveys is the one known as the "1912 kelp survey" (Crandall, 1912), whose maps were reproduced in the California Coastal Marine Resource Atlas (State of California, 1980) as simple delineations and annotations. The Atlas was validated for kelp and other marine features in 1978 using aerial photography acquired by the Department of Boating and Waterways. Kelp surveys of varying scope and time periods have also been conducted by commercial harvesters, research, and educational institutions. An excellent kelp forest ecology bibliography is available on line at http://wrigley.usc.edu/seer/RESEARCH/KELPBIBL.HTM (University of Southern California, 1998)
By the 1960's, quantitative administration of kelp beds was in place, in the form of officially mapped beds (State of California, 1963, 1967). The official bed designations were used to report kelp area statistics in a 1967 survey, incorporated into Fish and Game commission regulations, and later compared using bar graphs to the 1989 survey described below.
A total of 87 administrative kelp beds are defined, extending from the U.S.A.-Mexico International Boundary to the California-Oregon Boundary. Administrative kelp beds are also defined surrounding the following islands, Anacapa, San Clemente, San Miguel, San Nicolas, Santa Barbara, Santa Catalina, Santa Cruz and Santa Rosa. The divisions between the Administrative Kelp Beds are defined by bearings projected generally offshore from features along the California coastline (example: From a line drawn 156° from Malibu Pt. to a line drawn 185° from Pt. Dume. 0.21 square miles).
The base features for the projected bed division lines were located using the California subset of the USGS Geographic Names Information System (GNIS) and from features located on 7.5' USGS quad maps. The bearings were projected offshore to a line generated by buffering the shoreline out to 3 statute miles. The base shoreline was prepared by the Teale Data Center from USGS 1:100,000-scale Digital Line Graph data. ARC/INFO was used to create polygons of the areas encompassing the California shoreline, the buffered 3-mile line, and the projected bearings from the kelp bed legal descriptions.
Official kelp bed designations, kelp harvest leases, and harvest operations are addressed in Title 14, California Code of Regulations, Section 165.5.
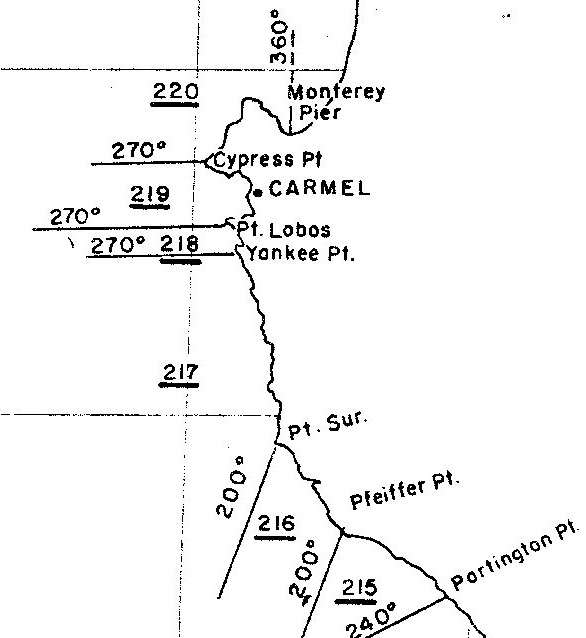
We scanned and georeferenced the official maps and compared them to shapefiles generated from the descriptions of the beds in legislative text. Thus verified, the shapefiles were utilized in processing subsequent kelp survey data, as described below. Here is a sample of the raw scanned image of the 1967 official kelp map. Administrative kelp bed numbers are underlined.
Until the 1999 kelp survey, the so-called California Coastal Kelp Resources Survey (1989) was the only statewide mapping of kelp in existence. The survey was performed under contract to the California Department of Fish and Game (DFG) by ECOSCAN Resources, Inc., Watsonville, CA.
Aerial photos were taken in July through October 1989 with a 35mm camera (Nikon FE-2, 50mm lens) flown at 7,500 feet ASL. The color infrared film transparencies (Kodak) were then projected onto 1:24,000 USGS topographic maps and kelp canopy features were delineated and inked by hand onto overlays. The overlays were scanned, scaled, and area calculations compiled by administrative kelp bed. The resulting hardcopy maps included the topographic base, shorelines, watercourses, rocky intertidal zones, offshore rocks/islands, sand beaches, selected geographic place names, and DFG Administrative Kelp Bed numbers.
DFG scanned the original 24"x36", black and white paper maps into packbit-compressed tif images and georeferenced them to the above USGS base using a custom ARC/INFO application developed by Esri. Scan resolution was 400 dpi. There are a total of 84 map images covering the coast of California.
After georeferencing, kelp canopy features were extracted (clipped) out of the map images and converted to ARC/INFO GRID format. Kelp grids were then mosaicked when a given kelp bed(s) straddled multiple mapsheet boundaries. The grid mosaics were then finally clipped once more to the net administrative kelp bed boundary for area computation. The re-measured kelp features compared favorably with the original ECOSCAN area data.
In 1999, TENERA Energy LLC, consultants to the Pacific Gas and Electric Company's Diablo Canyon Power Plant (DCPP), provided kelp survey data to the Department for comparison to the 1989 survey described above (Jim Strampe, personal communication). Tenera had scanned their DCPP kelp photos and registered them to base maps. Color patterns were then classified into kelp and non-kelp signatures. Next, computer generated area-statistics were developed from the classification. This DCPP technique differed from the ECOSCAN survey above, wherein hand-inked overlays were prepared from projected photos, scanned, and area-statistics developed from the scans.
The DCPP data were acquired in the same year (1989) as the ECOSCAN survey and plots of the area-statistics showed expected, similar spatial patterns of kelp distribution. However, the DCPP data showed a greater fineness of detail in the rendering of the kelp canopy, while a greater level of generalization was observable in ECOSCAN's manual technique. For example, in Administrative Kelp Bed 205, for 1989, the ECOSCAN survey calculated 153 acres, wheras the consultant survey calculated 88 acres. This was most likely attributable to the human tendency to "fill in the gaps" between clumps while inking the kelp overlays, whereas the computer-based method counted only classified pixels directly from the scanned photos.
This section describes various data acquistion technologies and data types: aerial photography, kelp image classification, and kelp canopy area calculations.
With over 1200 miles of coastline and highly variable weather conditions, California presents a significant challenge for coastwide aerial photography projects. In response to this situation, the 1999 kelp survey mobilized three independent efforts for aerial photography:
DFG Air Services
Aerial photos were taken in October, November, and December of 1999 with a medium format (60 mm) Hasselblad camera with an 80mm lens from an altitude of 11,000 feet above sea level. A Global Positioning System receiver (Garmin GPS12XL) was used to capture the aircraft's position at the exposure station of each photo. The developed photo frames (scale 1:41000 or 1" = approximately 3400', color, infrared transparency) were annotated with consecutive ID numbers. Every fifth frame was additionally labeled with local time and date of exposure (from the GPS data). An ArcView shapefile including the plotted photo points and table of photo data was created to index all photography. A logical (yes/no) value was also added to the table for identifying kelp presence or absence in each photo.
I.K. Curtis Services
Aerial photos were taken in October and November of 1999 with Wild RC10 and RC20 aerial mapping cameras (industry-standard, 6" lens with 9"x9" film format). The resultant color infrared contact prints were supplied to DFG labeled with date, original scale (1:24000 or 1"=2000'), time, and photo ID. A GPS-based, photo-center index was also supplied by the contractor. DFG converted the index into an ArcView shapefile and added photo ID numbers and other data (as above) to the attribute table, including the administrative kelp bed number that a given photo covered all or a portion thereof.
Pacific Aerial Surveys
Photos were taken in November 1999 with an industry standard Zeiss RMK TOP mapping camera (6" lens, 9"x9" format). The resultant color, infrared contact prints were supplied to DFG labeled with date, scale (1:24000), time and photo ID number. As in the previous two photography sets, an ArcView point shapefile was created (\shapefiles\KELP99PA.shp) to index each photo; the date and time were added manually to the table as well as a logical (yes/no) value for kelp presence/absence per frame.
DFG photos were scanned at 700 dots-per-inch (dpi), whereas the IK Curtis and Pacific Aerial photos were scanned at 400 dpi. All were saved as standard .jpg files. While the scan resolution was greater (and the original scale smaller) for the DFG photos versus the contractor photos, the approximate ground pixel size is 2 meters for all photography. The raw digital images were saved to CDROM. Processing priority was given to kelp-bearing photos, so presently, there are some gaps in the coastwide, digital versions of the photography.
The process of using digital aerial photography in a GIS requires a processing step known as registration or georeferencing. Aerial photographs have a nominal scale, but that scale is not constant throughout the frame. This registration process attempts to correct for scale changes and inherent photo distortions, as well as to add an earth-coordinate system, thereby allowing other digital layers with similar spatial coordinate systems to be co-registered with the photography. There are several methods for performing the registration process and various levels of accuracy associated with each method.
The 1999 kelp survey employed two registration methods. In the initial phase of the project, sophisticated photogrammetric processing was used under ERDAS Orthobase, version 8.4, software. This process was applied to single frames of aerial photos and employed camera parameters, camera orientation and position, and corrected for scale changes due to terrain elevational changes.
As an alternative approach, a simpler affine transformation was used for georeferencing the aerial photography under ArcView v3.1/Image Analysis Extension, v1.0.
After georeferencing the kelp aerial photos, DFG prepared a separate ArcView shapefile for each photo series by source. A polygon (or "wire-frame") delineating the "footprint" or net coverage of each photo frame was screen-digitized over the photo display itself. These wire-frame indexes were prepared in addition to the initial photo-center-only spot indexes described above. Depending on the mapping requirements, the simpler spot indexes or the more precise photo footprints were applicable. In either case, the attribute tables provided equivalent search and retrieval capabilities.
ERDAS Imagine and ArcView Image Analysis software was used to create an iterative, self-organizing clustering (Isodata) process to segment the image based on reflected light signatures. These signatures were then interpreted for kelp canopy. The parameters used in the classification included 20 spectral clusters, .95 convergence, and initial classes to be allocated along the axis of greatest variability (principle component). Twenty spectral classes means that the "image colors" in and around the kelp bed are divided into twenty different units. Because the algorithm is iterative in nature, the spectral locations of the clusters were adjusted with each iteration to maximize the number of pixels contained close to a spectral cluster center. When the amount of adjustment was minimized to meet the .95 convergence and the twenty classes were created, the iteration was stopped.
The 20 classes were evaluated for statistical separability. Some adjacent classes were not separable, which is not uncommon in this type of routine. Therefore, the twenty classes were merged into 4 classes for ease of interpretation. This still offered more qualitative information than the 1989 survey data derived from photo-interpretion/mapping under a binary level of kelp or not kelp.
The 20-to-4 class clustering routine was initially run on mosaicked images in southern beds. In northern beds, too much variability between photos, due to higher sediment in the water column, prevented this approach. The clustering was run on each frame, resulting in a set of twenty classes that had unique interpretations. The twenty classes were grouped into four and then mosaicked.
Final steps involved a conversion to polygon format in order to test some statistical properties. To prepare for the conversion, the reclassified image (4 classes) was filtered. Any isolated pixels in "bunches" of less than 8 contiguous pixels were set to background using the ERDAS sieve function. This process was only performed on bed 3 only.
Area statistics are an intrinsic aspect of a GIS database. For the 1999 kelp survey, the data were in a raster format. The process of calculating area is simply a product of the number of pixels of kelp times the area of each pixel. As described in the above sections on scanning aerial photography, the nominal pixel size was 2 meters on the ground (ocean surface), with a resulting 4 square meters of area per pixel. Conversion factors were applied to convert square meters to acres and square miles. All of these kelp area values were calculated in the GIS environment using ERDAS Imagine.
A Microsoft Excel spreadsheet was developed to compile the area statistics for all kelp beds. Area was reported by administrative kelp bed number, and by kelp density, in acres and square miles. These values were exported from the Erdas Raster Attribute Editor to a comma delimited text file, then imported into a spreadsheet. A total of kelp area (all densities) was recorded for each numbered administrative kelp bed.
The amount of kelp visible at the ocean surface is strongly dependent on the tidal stage at the time of photography. The higher the tide, the more surface kelp biomass is submerged and therefore the less area is measureable from the photographs. Standardizing the tidal stage at the time of photography is also important for comparability of different surveys.
Tide information was obtained over the Internet from NOAA/NOS at http://co-ops.nos.noaa.gov/coastline.shtml?region=ca. This page enabled selection of a station location, a time range, and desired local standard time, tide stage above mean lower low water, and units of feet. Retrieved data were downloaded as text files, including the selection parameters. The text files were imported into spreadsheets, parsed, and graphed.
Selected stations were accessed to obtain -2' (optimal) or -1' (acceptable) tidal stages at 2pm to 4pm local time. The afternoon time of day was required to minimize specular reflections (glare) of the sun in the kelp aerial photographs, which would prevent accurate measurements.
Optimal conditions for photographing kelp are difficult to obtain in practice due to weather and other logistical challenges. Therefore, a complete account of tide information is essential for comparing and fine-tuning kelp area estimates when photography is acquired under other than optimal conditions.
Vertical lines indicate various dates of 1999 aerial photography flights. Future surveys can utilize this information to replicate as closely as possible the sea-state immediately prior to the acquisition of kelp photography.
A total of 1698 individual frames of aerial photography were taken of the kelp resource, from October 13 through December 22, 1999. The entire California coast and Channel Islands were covered, with the exception of a few miles of shoreline south of Cape Mendocino which was chronically shrouded in fog. Of these photos, a total of 388 frames were scanned, georeferenced, and measured for kelp canopy area at the ocean surface. All photography is indexed and on file at DFG offices in Monterey and Sacramento, California.
Kelp canopy area values, measured at the ocean surface, were tabulated for the 1989 and 1999 kelp surveys. Statistical analysis of these data is beyond the scope of this paper, and direct comparisons of kelp area by year are purposefully avoided due to the major differences in techniques between the two surveys. The kelp area data are therefore presented for reference only.
Click here to view the data table.The reader is cautioned against making direct comparisons between the 1989 and 1999 surveys for the following reasons: 1) Timing of the survey is important, particularly with respect to growing season conditions in the ocean, and storms and harvest levels preceding the dates of survey photography. Seasonal variability may account for differences in surveys, which may not reflect a change in the bed's extent, productivity, or harvest level. 2) Statistical significance in change of area should be evaluated. To do this, a variance parameter is needed, which is obtained by repeated measurements. For example, data for the Palos Verdes Peninsula is available, on a 4 survey per year interval, dating back to 1974. Most of the coastline, however, has been surveyed only on three occasions (1967, 1989, and 1999). 3) Survey methods have not been consistent. Some method of calibration between the methods needs to be performed in order to insure a change of area is not due to survey instrumentation, and not misinterpreted as a biological change. As an example, administrative kelp bed 205 was surveyed both by Ecoscan using manual techniques and by PG&E/Tenera using digital techniques. The photos were acquired in 1989 for both surveys. The Ecoscan survey calculated 153 acres of kelp. In contrast, the PG&E survey calculated 88 acres of kelp. We believe this difference in area is due to scale of aerial photography and measurement methodology differences.
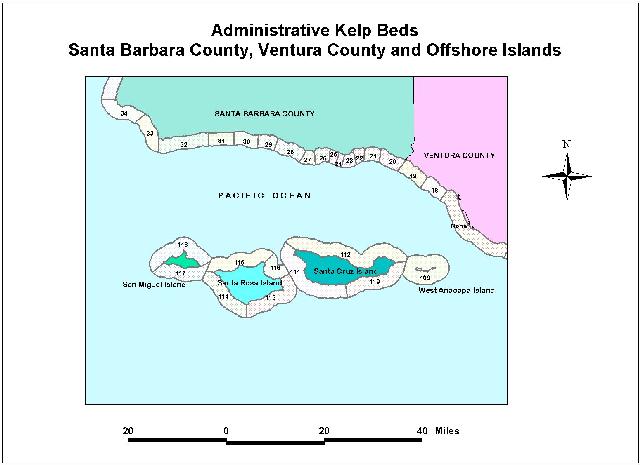
Administrative Kelp Beds from Title 14, California Code of Regulations, Section 165.5. Sample is Santa Barbara and Ventura Counties and San Miguel, Santa Rosa, Santa Cruz and West Anacapa Islands. Seaward boundary is a 3-statute mile shoreline buffer. Actual kelp zone is typically within several hundred meters offshore.
p900_012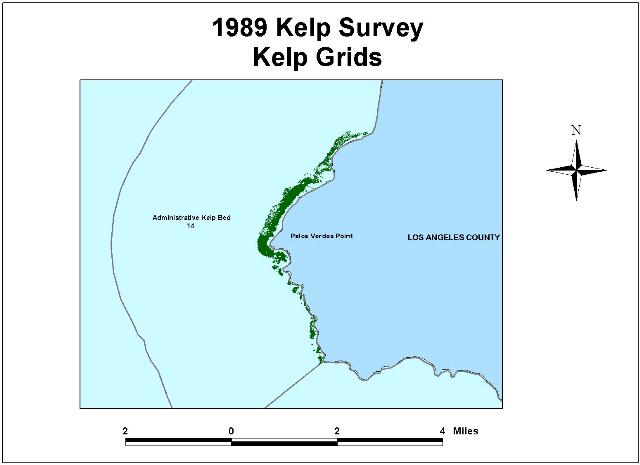
Kelp grids produced from 1989 ECOSCAN survey. Area shown is portion of Administrative Kelp Bed 14 located near Palos Verdes Point, Los Angeles County, California.
p900_013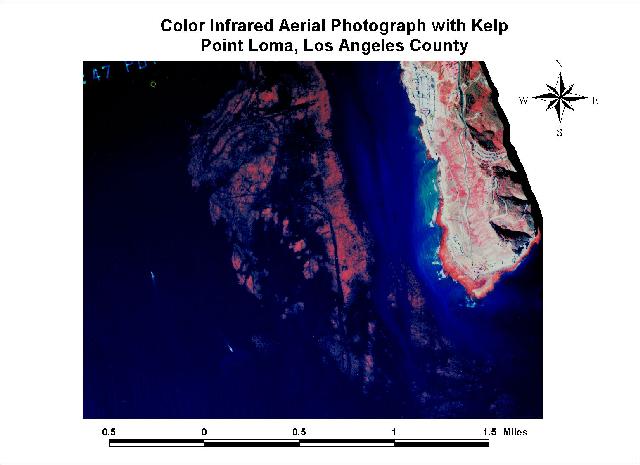
Color infrared aerial photograph taken by I.K. Curtis Services taken October 25, 1999, near Point Loma, Los Angeles County, California. A kelp harvest track is clearly visible near the center of the frame.
p900_014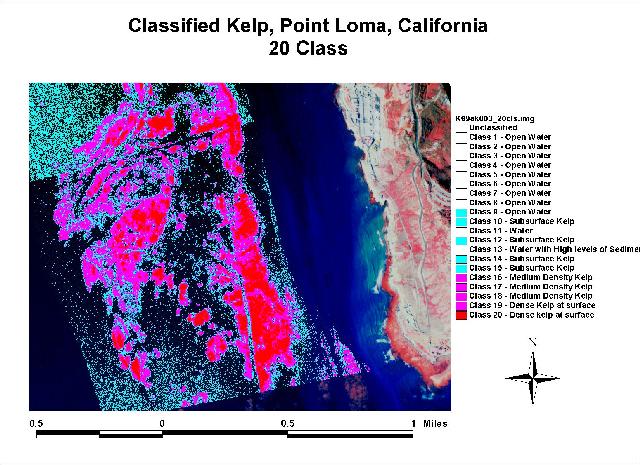
Classified kelp, 20 class categorization using ERDAS Imagine and ArcView Image Analysis near Point Loma, California. Photograph was taken October 25, 1999. The more intense red colors indicate denser kelp canopy at the ocean surface.
p900_015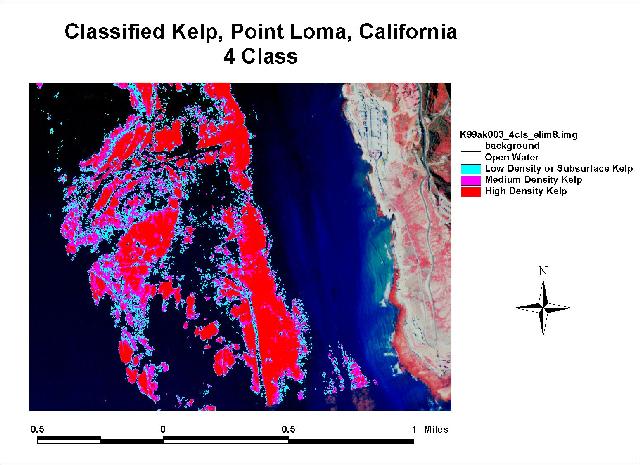
Classified kelp, after clustering 20 classes down to 4 classes. Photograph was taken near Point Loma, California on October 25, 1999.
p900016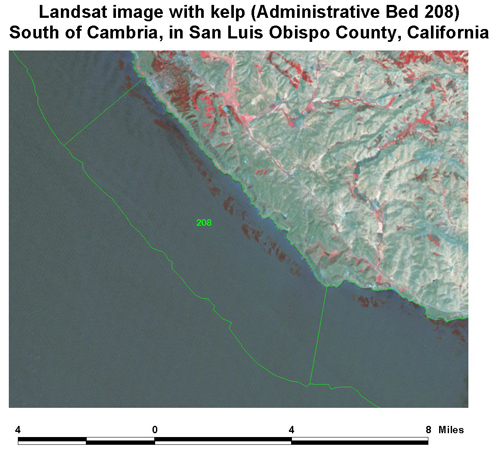
Landsat-7 satellite imagery, acquired Summer 1999, was used to validate kelp mapping from the IK Curtis photos. Satellite imagery is potentially useful for future kelp survey area calculations.
The following are subjective remarks regarding the image data quality. The quality of the 9 x 9, large-format aerial photography was excellent. The quality of the 60mm, medium-format photography ranged from fair to excellent due to weather and other logistical problems. Shapefile indexes, spatial accuracy, and attribute completeness were very good.
The quality of the georeferenced images was slightly degraded in spatial resolution due to a required resampling and smoothing of the source image during the registration process. Viewing of the original film under magnification will always be superior to digital imagery in terms of interpretive detail available.
Accuracy of registered images using ArcView Image Analysis extension was assessed based on the Root Mean Square Error (RMSE) of the affine transformation used to reproject the images. This value was in the range of 4 - 12 meters. Users may encounter greater registration errors within the coastwide photography set. Control points were selected at sea level or as near to sea level as possible. Selection of control points in elevations above sea level introduced greater errors in the target areas of interest, the kelp, due to terrain-based photo distortions. Large (tens of meters) horizontal registration errors may be detected in upland areas of the photography.
The principal application of the 1999 kelp survey was for revision of environmental documentation of kelp harvest regulations.
The Department published a Final Draft Environmental Document, Giant and Bull Kelp Commercial and Sport Fishing Regulations in January 1996 (State of California, 1996). This document, prepared in accordance with the California Environmental Quality Act (CEQA), described the kelp regulation process, environmental setting, environmental impacts, mitigation, alternatives, and conclusions. References and illustrations are included.
The most recent revision of this document is available on line at http://www.dfg.ca.gov/mrd/new_kelp/index.html
Other applications include but are not limited to: 1.) determination of critical habitat for nearshore fin fish (due to the high correlation of kelp occurrence on rocky reefs.) 2.) baseline for creation of a comprehensive time-series of kelp photos and maps, acquired from various sources and technologies. 3.) visualization of the kelp resource for public information and user conflict resolution in sectors such as commercial harvest, fishing, and sport diving.
The methods used during this project were much different than previous kelp survey projects. Care should be used in comparing the acreages acquired by varying types of data interpretation. There is great variability within kelp area as recorded by color infrared film. This can be attributed to seasonal changes, tidal changes, water clarity, timing of the aerial photography in relationship to storms and kelp harvesting. Also the identification of kelp from aerial infrared photography should be checked with field observations. The photographs are difficult to georeference when the percentage of ocean area is greater than visible shoreline. Accurate GPS center points of the images would decrease the time involved in processing. The time involved in the scanning, georeferencing and categorization of the color infrared images needs to be compared to other methods of imagery acquisition including satellite imagery. The satellite imagery would contain a larger footprint of the coastline resulting in fewer images to process. New satellites are capable of providing a one to four meter resolution image, much higher than previous satellite imagery which was in the 30-meter range.
Landsat satellite imagery, which was acquired in the summer of 1999, was used to cross-reference and check kelp mapping from the large-format aerial photos. Even though the 30-meter resolution was coarser on the satellite imagery than that of the scanned aerial photos (2-meter), the kelp signatures were very distinct and in some cases pointed to an under-representation of kelp area by photography acquired in late November.
Two, and in some areas, three sets of aerial photographs were acquired. This turned out to provide a good means to replicate, or cross-check, individual findings within the survey. Initial visual comparisons of photography showed a very high correlation of spatial patterns of kelp occurrence.
In some cases, beds were resurveyed based on the photography acquired by DFG Air Services. The situation occurred when the IK Curtis photography was acquired in late November after a series of storms, whereas the DFG photography had been acquired in early November. The measured kelp area between the two dates of photography was markedly different, with the earlier photography (pre-storm) flown by DFG Air Services, depicting a much greater amount of kelp.
Santa Rosa Island, San Miguel Island, Administrative Beds 221, 220, and 219 (Santa Cruz, Monterey, Carmel, respectively), were all surveyed or resurveyed using DFG photography. Satellite imagery was used to confirm the kelp bed extents. Area calculations were not made from satellite imagery, because of the inconsistency of resolution (30 meters) with the photography employed for the rest of the coastline (2 meters).
In the future, satellite imagery may provide a good means of conducting the entire survey. Since processing is repeated for each photo, using satellite images would translate into a reduced level of effort to perform the survey. It could reduce the amount of work in several ways. 1) Nine LANDSAT scenes cover the entire coast, compared to hundreds of aerial photographs. 2) Satellite imagery may be purchased with various levels of spatial referencing already performed. 3) The footprint of a LANDSAT image is about 100 miles on a side. This makes the images useful for organizations, such as the DFG Office of Spill Prevention and Response (OSPR), who may need coverage of both ocean areas as well as coastal marshes, bays, and estuaries.
Crandall, William C. 1912. The kelps of the southern California coast. U.S. Senate Document 190. in Fertilizer Resources of the U.S., Appendix N.
Dawson, E.Y. and M.S. Foster. 1982. Seashore plants of California. California Natural History Guides: 47. University of California Press. Berkeley. 226 p.
ECOSCAN. 1989. California coastal kelp resources - Summer 1989. Report and maps prepared under contract to the California Department of Fish and Game, Marine Resources Divison, Sacramento, CA.
Foster, M.S. 1982. The regulation of macroalgal associations in kelp forests. Synthetic and Degradative Processes in Marine Macrophytes. L. Srivastava (ed.). Walter de Gruyter Co., Berlin. p. 185-205.
State of California. 1996. Final Draft Environmental Document, Giant and Bull Kelp Commercial and Sport Fishing Regulations. The Resources Agency, Department of Fish and Game, Marine Region. January 1996.
State of California. 1980. California coastal marine resource atlas. The Resources Agency, Department of Fish and Game. Coordinated by C.E. Blunt, Jr., Marine Resources Branch.
State of California. 1967. Official Map, Kelp Beds, Point Montara to Point Arguello, March 3, 1967, True Bearings, based on U.S.C.& G.S. charts; 5302 October 12, 1964; and 5402 September 6, 1965.
State of California. 1963. Official Map, Kelp Beds, Point Arguello to U.S.A.-Mexico Border, August 1, 1963, True Bearings, based on U.S.C.G.S. chart 5020, April 1961.
Strampe, J. 1999. Personal communication. TENERA Energy, LLC (Environmental Services), PO Box 400, Avila Beach, CA 93424.
University of Southern California. 1998. Bibliography on kelp forest ecology. USC Marine Science Center, Santa Catalina Island, CA.
Robson Collins/Ecosystem Manager, DFG Project Leader; Larry Heitz/Chief Pilot, DFG Air Services and Ivan Curtis/I.K. Curtis Services and Fred Benton/Pacific Aerial Surveys, aerial photography; Mariko Ueno and Carol Clark/Student Assistants, DFG, georeferencing, data management, documentation support; Will Patterson/GIS Analyst, DFG, ARC/INFO processing support; Adrien Litton/Esri, scanning and georeferencing custom application programming; Jerry Kashiwada/Associate Biologist, DFG, tide information and flight scheduling support, and Nancy Wright/GIS Analyst, DFG, GIS applications coordination.
Authors
Paul Veisze, Alan Kilgore, Mark Lampinen