The views presented in this paper are solely those of the authors and do not reflect the views of the U.S. Environmental Protection Agency.
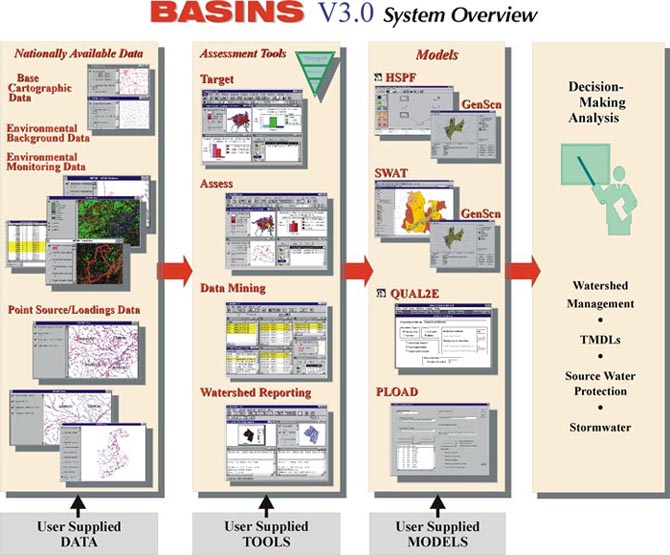
The U. S. Environmental Protection Agency developed the Better Assessment Science Integrating Point and Nonpoint Sources (BASINS)( http://www.epa.gov/ost/basins )application to provide a comprehensive watershed modeling system integrated with ArcView. It is used by EPA, States, and local agencies in performing watershed, water quality, and TMDL analysis. This paper describes the new models, utilities, tools, and data provided in BASINS version 3. Two new models are introduced which include the Soil and Water Assessment Tool (SWAT), and a simple export coefficient based model (PLOAD). A updated HSPF model is supported through a new Windows interface. BASINS 3.0 introduces ArcView's Spatial Analyst extension and provides raster data such as DEM (elevation) and MRLC/NLCD (landcover) http://www.epa.gov/mrlc .
BASINS is also conceived as a system for supporting the development of total maximum daily loads (TMDLs) as defined in Section 303(d) of the Federal Clean Water Act. A TMDL is the sum of the allowable loads of a particular pollutant from all contributing point and nonpoint sources. The calculation must include a margin of safety (MOS) to ensure that the waterbody can be used for the purposes the State has designated use (ie., drinking water, fishing, swimming, etc.). Developing TMDLs requires a watershed-based point and nonpoint source analysis for a variety of pollutants. It also lets the modeler test different best management options for the impaired waterbody.
Traditional approaches to watershed based assessments typically involve many separate steps preparing data, summarizing information, developing maps and tables, and applying and interpreting models. BASINS makes watershed and water quality studies easier by bringing key data and analytical components together on a user's desktop. Using the now familiar Windows environment, an analyst can quickly access national environmental data, apply some assessment and analysis tools, run several calculations and processes through hundreds of nonpoint source loadings, and obtain results in the form of maps, charts, graphs, and reports from a choice of water quality models in a matter of minutes.
The following components are new in BASINS 3.0:
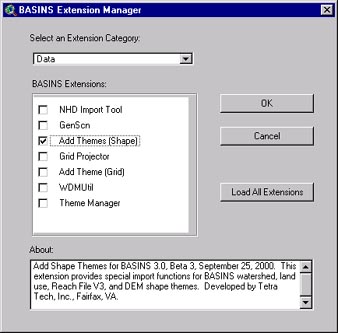
This new architecture is more open, flexible, and promotes growth; paving the way for users and other developers to create new extensions that might be useful not only to themselves but also to the entire BASINS' user community. The new architecture also allows the system to support several levels of hardware and software sophistication. For example, users might not need to acquire ArcView's Spatial Analyst extension if they do not intend to use the BASINS grid (raster) datasets that require Spatial Analyst. Also this architecture provides future developers a relatively easy modular approach in migrating to future ArcView software engineering.
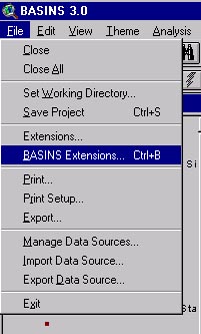
A new online "help" feature has been added to the BASINS 3 application. Help is available in a web interface in the BASINS Window for all of the tools, utilities, or functions in the application as well as the four water quality models.
BASINS Version 3.0 Data Products:
BASINS also supports the use of local data for water quality analysis. The system provides standard import routines for incorporating data into ArcView projects, supplies input data Windows for adding attribute information, uses download data tools, and provides help menus for obtaining and importing some important GIS data layers from various data sources.
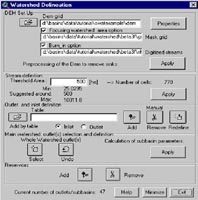
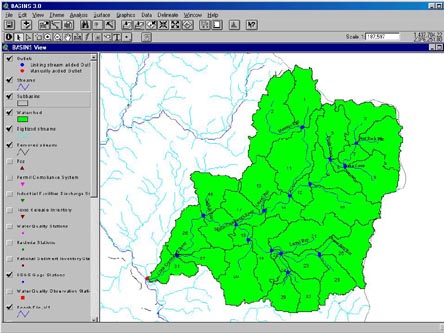
The BASINS Automatic Watershed Delineation tool, which requires ArcView's Spatial Analyst extension, carries out advanced GIS functions to aid the user in segmenting watersheds into several "hydrological" connected subwatersheds for use in the water quality models. The delineation process requires a raster Digital Elevation Model (DEM) dataset and a continuous digitized stream network (with center lines for wide rivers or lakes) in an ArcView shapefile format. Once the delineation process is finished the watershed shapefiles and watershed characterization parameters are created for input to one of the models in BASINS for further analysis.
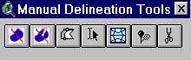
The BASINS Manual Watershed Delineation Tool which does not require ArcView's Spatial Analyst extension, provides the user an easy method to subdivide a watershed into several smaller "hydrological" connected subwatersheds for use in the water quality models. This tool has been enhanced using ArcView's dynamic segmentation procedure to allow users the flexibility in editing shapes and attributes of a watershed, to generate drainage stream network, and to identify the subwatershed pour point. Any continuous shapefile or digitized stream network such as EPA's River Reach File version 1, 3, or the NHD in an ArcView shapefile format is needed. The user can manually delineate one or several watersheds at a time. After the delineation process is finished the watershed shapefiles and characterization attributes are created for input to one of the models in BASINS for further analysis.
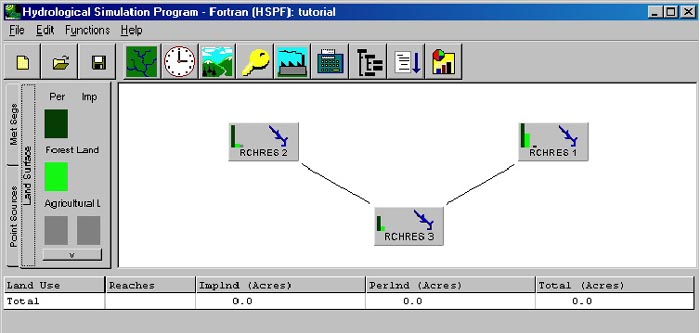
The BASINS WinHSPF Windows interface replaces the former NonPoint Simulation Model (NPSM) interface included in previous versions of BASINS. WinHSPF provides complete access to HSPF's functionality and user input data files. The model estimates landuse (rural and urban mixtures) of specific nonpoint source loadings for selected pollutants at an 8-digit HUC or subwatershed scale. The model uses GIS landscape data such as landuse distribution and elevation data together with the watershed and drainage stream network characteristics derived earlier to automatically prepare many of the input data it requires. WinHSPF is a continuous simulation model, driven by meteorlogical events, used to analyze water quality impacts from multiple point and nonpoint pollutant sources, for single or multiple hydrological connected watersheds, and designed for evaluating alternative pollution control scenarios.
A user can also simulate point source contributions in WinHSPF. Data from EPA's Permit Compliance System (PCS) are provided. This is a simplified implementation in that only a single value of flow from the facility and pollutant concentration (based on EPA's NPDES permit limit) can be specified.
HSPF has proven itself to be ideal for modeling bacteria loads to streams. It has the advantage of being able to produce a continuous simulation of both direct discharges to receiving streams such as wastewater treatment plants as well as nonpoint sources such as grazing cattle, land application of manure, and failed septic systems (see PDF file Cottonwood Creek, Idaho Case Study).
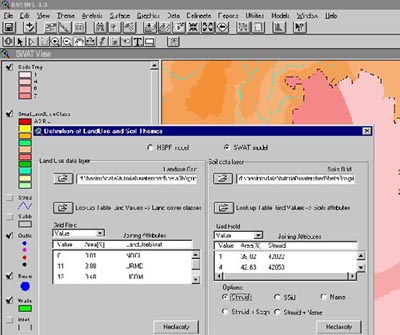
The data requirements of the SWAT model are moderate and include hydrology, soils, elevation, landuse, and meteorology. BASINS GIS utilities are used to process much of this data for input to the model. The BASINS automatic or manual watershed delineation tool must be used to create the spatial representation and characteristics parameters of the study area. These subwatersheds are then used to summarize the applicable soils and landuse data that estimates nonpoint source runoff and loading. The SWAT model operates on a daily time step and requires daily estimates for precipitation, maximum and minimum temperature, solar radiation, wind speed, and relative humidity. These data are provided in the BASINS data holdings.
The SWAT model includes a number of tools that are designed to summarize and present the results of model simulations. These tools include scatter plots, graphs, and charts of key components such as daily rainfall, runoff, sediment yield, and pollutant load. SWAT in the BASINS system has the capability to export output data directly to a postprocessor program (GenScn) for data analysis and scenario development and comparison.
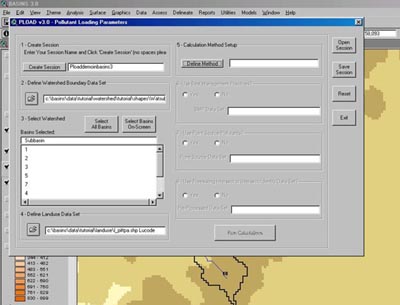
The PLOAD application requires the following GIS and tabular data which BASINS 3 provides as input:
PLOAD is designed to be generic so that it can be applied as a basic screening tool in a wide variety of application scenarios including NPDES stormwater permitting, watershed management, or reservoir protection or restoration projects. It was designed to be an analytical tool for end users. PLOAD uses the menu-driven ArcView desktop GIS.
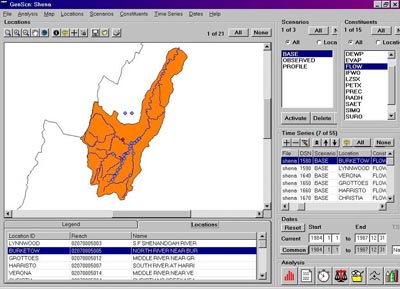
GenScn is designed for the analyst to interactively monitor and obtain results of data tables, graphs, scatter or time series plots, and the site map and the GIS data layers all on the desktop. A wide range of plots can be specified, including a standard time series plot, two time series plots on the same graph, bar charts, stream flow charts, scatter plots, and frequency plots. This tool has the ability to plot time series of water flow between the observed and the simulated as well as other saved scenarios.
By using GenScn, modelers and surface water managers can learn more about the watershed by exploring how regulatory contraints from the Clean Water Act and changes in landuse or BMPs can affect the water quality throughout a water basin.
BASINS makes the TMDL process easier by bringing together both the GIS and monitoring data, the analysis tools, the data processing utilities, the watershed models, and a robust reporting function onto a watershed analyst's desktop. BASINS provides enough capability to begin a detailed analysis and over time with better up to date data and technical improvements in software and hardware will increase the reliability and decrease the burden required to meet the regulatory requirements of the Clean Water Act.
Arnold, J.G., Kiniry, J.R., Neitsch, S.L., Williams, J.R., 2001, Soil and Water Assessment Tool User's Manual Version 2000, Grassland, Soil, and Water Research Laboratory, Agricultural Research Service, Temple, Texas.
CH2MHILL, 2000, PLOAD Version 3.0 An ArcView GIS Tool to Calculate Nonpoint Sources of Pollution in Watershed and Stormwater Projects, CH2MHILL, Herndon, VA.
Cox, S.J., 1996, A Program to Cartographically Reproject Raster Maps for Use with GRASS GIS, AGCRC, CSIRO Exploration and Mining Report 238F.
Evenden, G.I., 1990, Cartographic Projection Procedures for the UNIX Environment - A User's Manual, USGS, Open File Report 90-284.
Federal Geographic Data Committee (FGDC), Content Standard for Digital Geospatial Metadata (version 2.0), FGDC-STD-001-1998
Kittle, J., Gray, M., Duda, P., Hummel, P., Dusenbury, R., 2001, GenScn-A Tool for Generation and Analysis of Model Simulation Scenarios for Watersheds User's Manual, Aqua Terra Consultants, Decatur, Georgia.
USEPA, 1997, Compendium of Tools for Watershed Assessment and TMDL Development, EPA-841-B-97-006, U.S. Environmental Protection Agency, Office of Water, Washington, DC.
USEPA, 1998, Better Assessment Science Integrating Point and Nonpoint Sources, EPA- 823-B-98-006, U.S. Environmental Protection Agency, Office of Water, Washington, DC.
USEPA, 2000, BASINS Case Study 1: Cottonwood Creek, Idaho Fecal Coliform TMDL Modeling Analysis, U.S. Environmental Protection Agency, Office of Water, Washington, DC.
USEPA, 2001, Better Assessment Science Integrating Point and Nonpoint Sources, EPA- 823-B-01-001, U.S. Environmental Protection Agency, Office of Water, Washington, DC.
USEPA, 2001, BASINS 3.0 Factsheet, EPA-823-F-01-021, U.S. Environmental Protection Agency, Office of Water, Washington, DC.