|
Mine
Reclamation Using a Collaborative GIS-based Approach
|
| Abstract |
| The repercussions of
metal mining during the late 1800's currently threaten the Tenmile Creek
watershed. Tetra Tech EM Inc. (TtEMI), was tasked by the EPA to determine
the nature and extent of mine waste at over 100 sites and to prevent additional
mine wastes from entering Helena's water supply. To meet the demands of
this task, TtEMI implemented a GIS program which required the collaboration
of two TtEMI offices, state and federal agencies, mining companies, and
several consultants to adequately characterize the site and prevent further
deterioration of Helena's water supply. TtEMI implemented an innovative
ArcInfo and Arc View GIS solution on a watershed basis to organize thousands
of analytical results, process imagery, present model results, and monitor
clean up. As the project continues, the EPA will require all data to be
posted to a GIS-enabled web site where regulatory personnel, data users
and the public will have 24 hour access to reclamation status and data.
The enterprise GIS solution was the logical approach due to the distribution
of sites throughout the watershed and project requirements for sharing data. |
| |
| I. Introduction |
| TtEM Inc. has developed
a Geographic Information System (GIS) for the Region VIII Environmental
Protection Agency (EPA) as a means to address threats to human health and
the environment within a municipal watershed. Under the Comprehensive Environmental
Response Compensation and Liability Act (CERCLA), also known as Superfund,
the Helena municipal watershed has reached critical levels of heavy metals
resulting from over a century of mining. The primary water source for the
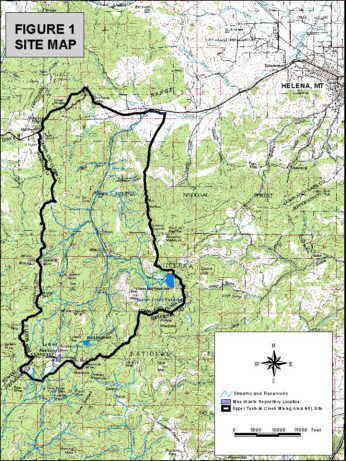
City of Helena, Montana is in the Upper Tenmile Creek watershed, located
almost entirely in Lewis and Clark County, approximately 10 miles southwest
of Helena (Figure 1). The extent of the municipal watershed
is approximately 51 square miles. Approximately 150 abandoned or inactive
mine sites are present in the Upper Tenmile Creek watershed within or near
the historic Rimini Mining District. |
|
|
| |
| II. Background |
| |
| Most historic mining
activity in the watershed took place within the Rimini Mining District and
included hard rock mining for gold, lead, zinc, and copper. Active hard
rock mining began in the 1870's and continued through the 1930's. Limited
intermittent mining activities were conducted during and after World War
II. The last active commercial mining in the Rimini Mining District ended
in 1953. The site also includes the properties of the defunct Basin Creek
Mine, an open pit gold mine located at the headwaters of Tenmile Creek,
which had operated under a Montana Department of Environmental Quality (DEQ)
permit until the mid-1990's. The Basin Creek Mine is being reclaimed by
DEQ using money from a reclamation bond forfeited by the operator upon bankruptcy.
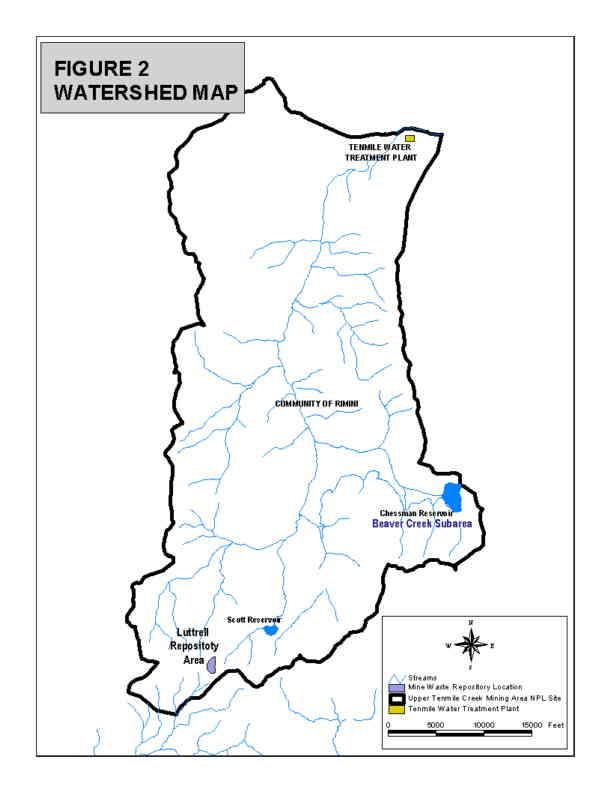
Helena's Upper Tenmile Creek water supply system includes Chessman Reservoir
and Scott Reservoir with storage capacities of 350 and 196 million gallons
of water, respectively. In addition, tributaries throughout the watershed
flow into Tenmile Creek where diversion structures convey water via underground
pipe to the Tenmile Creek water treatment plant (Figure 2).
Degradation of water quality in upper Tenmile Creek is attributed to the
residual waste rock/tailings piles and discharging mine adits at the approximately
150 abandoned hard rock mine sites located in this watershed. Environmental
data gathered from these mine sites indicate a release of high concentrations
of arsenic, cadmium, copper, lead, zinc, and other hazardous substances
that may pose unacceptable risks to human health and the environment. These
substances, which are present in the watershed groundwater, surface water,
stream sediments, mine waste material, and residential soils are located
in close proximity to the creek and often exceed established regulatory
standards for drinking water and aquatic life. Since these mine wastes may
potentially contaminate drinking water supplies for residences of both the
city of Helena and the community of Rimini, they pose a potential health
threat. Tissue samples from Tenmile Creek fish have also shown elevated
levels of arsenic. |
|
|
|
| III. A Collaborative
Approach to Reclamation |
| |
|
Cleaning up Tenmile
Creek began as a grass roots effort made up of local citizens concerned
for the health of the community of Rimini. The group has been very active
at the site and is now composed of agency representatives and private
citizens. This group, The Upper Tenmile Watershed Steering Committee,
has identified three goals in their effort address contaminant problems
in the Upper Tenmile Creek Watershed. Their goals include to 1) discuss
and offer suggestions on improving water quality in the basin; 2) educate
the general pubic about environmental problems and the potential to improve
water resources within the basin, especially drinking water for residents
of Rimini and the city of Helena; and 3) guide development of land in
the watershed in order to preserve its amenities for the enjoyment of
all, now and in the future. The group is also concerned about identifying
a potable water supply and ensuring fire protection for residents of Rimini,
controlling noxious weeds, improving the quality of the fishery, abating
road dust, and considering measures to specifically address adit discharges
to Tenmile Creek to improve water quality. From discussions among committee
members and various government agencies, the EPA has gained a broader
perspective on the concerns of people directly affected by the legacy
of historic mining and have been able to identify issues and potential
cleanup approaches that may meet the common goals and objectives of many
of the affected parties. Numerous individuals and local, state, and federal
governmental representatives have been working for many years to address
contaminant problems in the upper Tenmile Creek watershed. They include
the following:
|
| Upper Tenmile Watershed
Steering Committee |
| Upper Tenmile Technical
Subcommittee |
| Lewis and Clark
County |
| City of Helena |
| Rimini Caucus |
| Montana Department
of Fish, Wildlife and Parks (MDFWP) |
| Montana
Department of Natural Resources and Conservation (DNRC) |
| Montana Department
of Environmental Quality (MDEQ) |
| Montana Bureau of
Mines and Geology (MBMG) |
| U.S. Geological
Survey (USGS) |
| U.S. Forest Service
(USFS) |
| U.S. Fish and Wildlife
Service (USFWS) |
| U.S. Environmental
Protection Agency (EPA) |
| |
| The now defunct Basin
Creek Mine, located at the headwaters of Tenmile Creek and directly on the
continental divide, was selected as the repository site for mine waste material.
Using state of the art technology, one of the historic gold mine pits, known
as the Luttrell Pit, will be lined and store nearly 1.5 million cubic yards
of contaminated soil. The mining operation has installed several deep wells
surrounding the gold mine pits as a means of monitoring water quality. |
|
| IV. The GIS Tool |
| |
| With input from so many
sources, project purpose, scope and objectives were the focus of initial
organizational meetings. The purpose of the project is to identify the major
sources of mine waste contamination in the Upper Tenmile basin. Once the
major mine waste contamination sites were identified, remediation plans
were designed to address the sources of pollution. Focusing mainly on how
this pollution causes risk to human and environmental health required a
group of scientists to assess the situation from multi-disciplines, such
as hydrology, soil scientology, engineering, chemistry, and geology. The
issue of data retrieval, display and analysis was one that crossed over
to each discipline. The result was the obvious need for a GIS. What wasn't
obvious was the method to approach the myriad of needs for each discipline.
Following is an outline of TtEM Inc.'s approach to the establishment of
a GIS that would serve as a retrieval, storage, display and analysis system
for all tabular and graphical data. |
| |
| Step 1:
Gather Existing Data Nearly every group that was involved with the project
from its inception had gathered some form of data. For example, the USFS
identified mine locations, collected soil and water samples, and prioritizing
high-risk mine reclamation sites. The USGS collected surface and groundwater
samples. The Upper Tenmile Watershed Steering Committee not only utilized
local Rimini citizens to collect water samples at strategic locations along
the creek, the group was actively seeking a potable water supply for residents
of Rimini and looking at measures to specifically address adit discharges
to Tenmile Creek to improve water quality. The USFWS had conducted fishery
studies, and the Basin Creek Mine had installed deep wells at strategic
locations surrounding the mine to monitor groundwater contamination. Collection
of this historical data was vital to the success of the assessment. Most
scientists involved with the project were eager obtain existing data for
their disciplines so research and acquisition of data required a thorough
yet quick result. |
| |
| Step 2: Plan for
future data needs. This step required answers to unknown questions. Each
discipline was lacking the details that would steer their study. It was
important to know what each group was trying to accomplish, what data exists
to support this endeavor, what data will need to be collected, and what
are the priorities. Some issues would have to be dealt with at a later date,
such as, what depth of soil samples were required to assess soil contamination.
What became obvious after reviewing the existing data was the large extent
of contamination. Questions arose such as 'how many mine sites are we talking
about' and 'has each stream within the watershed been affected' and even
more basically, 'does every stream have a quantifiable flow?'. Some of the
groups could provide large-scale, site-specific maps of their study areas
but a visual depiction of the entire area required small-scale maps that
dropped out details. The need for a large-scale visual depiction of the
study area came to the forefront. Team scientists identified present needs
as base maps, roads, streams, ownership, physical features, and mine locations.
|
| |
| Step 3: Establish
data formats, Integrate existing data TtEM Inc. designed a standardized
framework for the tabular and graphical data prior to any data integration.
This framework gave GIS specialists guidelines for integration and consistency
for all output. The data management of the Upper Tenmile Creek project consisted
of a relational database management system (RDBMS) and a geographic information
system (GIS). Spatial information such as roads, streams, and topographical
contours, along with sampling locations of monitoring wells, surface water,
groundwater, sediments and waste rock are stored in the GIS. The spatial
data is then linked to the relational database, which stores attribute information
associated with the spatial data. This attribute information includes any
nonspatial component to a sample. When spatial data are linked to attribute
data, a clearer and more complete picture of site was developed. Tetra Tech
developed standards for both the database design and the GIS that would
accommodate the different data sources while maintaining integrity for the
life of the project. |
| |
| Relational Database
Design |
| The database
was designed in MS Access and was linked to the GIS data through standard
query language (SQL) connects. The design was an adaptation of the Montana
Department of Health & Environmental Sciences Clark Fork Data System.
Using this project as a framework reduced the work needed for initial database
development and design phase. In its initial phase, the database included
information supplied by the Mine Waste Clean-up Bureau (MWCB, a division
of DEQ) and other sources as part of available historic data. The Montana
State Library, Natural Resource Information System (NRIS), supplied Montana
statewide data. All available analytical data from past investigations,
available cultural and resource data, and other GIS data, was also entered
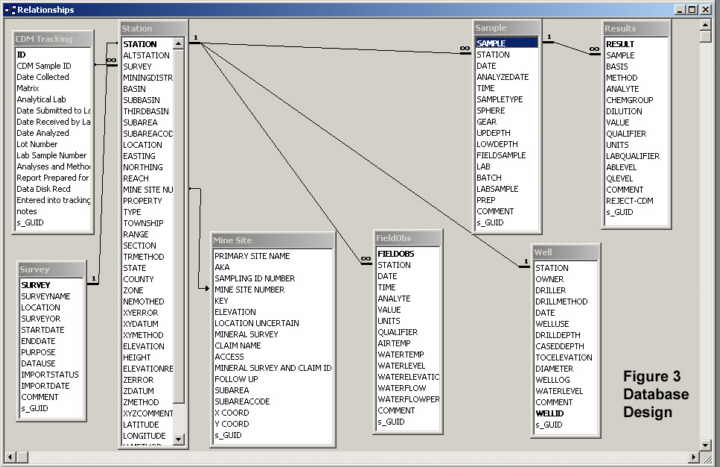
into the database. The Access attribute database contains 10 primary tables
and three supporting tables, as illustrated in (Figure 3).
Each table is analogous to a data file and is a means of modeling or logically
organizing data. The 10 tables presented in Figure 3 are considered primary
tables because they contain the principal field observation, analytical,
and survey data. The 10 primary tables are as follows: PT_KEY, WEL, STN,
ST, SU, SC, SLab, RESULTS, FOBs, and ResultsCFO. The remaining three supporting
tables in the attribute database promote standardization of essential data.
These tables contribute standard parameter names, analytical group information,
and investigation grouping information. This section explains each of the
10 primary database tables in further detail and briefly discusses the three
supporting tables. |
| PT_KEY: Table TtEMI modified the Clark Fork Data System by
adding a PT_KEY, or point key table, to the State of Montana RDBMS structure.
This table links the GIS portion to the relational database. The table consists
of a unique number and a point name. The GIS can link to the number rather
than the point name and, in so doing, will eliminate redundant or duplicate
point names in the GIS system. The PT_KEY table will be linked to the ST
table. |
| SU Table:
The SU, or survey, table will contain information from each survey event.
Data will include survey identification, survey name, date, purpose, use,
and import status. These fields will be the basis for the survey. Other
tables will use the survey identification and survey name as references.
This table is the starting point for data entry, as all information placed
in the database will be associated with the survey event. Each survey will
be maintained in a unique fashion so that data may be queried based on individual
surveys. |
| ST Table:
The ST, or station, table will hold information collected during each individual
sampling event. Details include: survey location, station name, and location
information. The spatial information contained in this table will be used
by the GIS to generate maps. This table will also include spatial information,
such as coordinate or "xy" method, "xyz" error, latitude, longitude, township,
range, and section. Other location-specific details are included such as
floodplain and surrounding geology. |
| WEL Table:
The WEL, or well, table will be used to store information about monitoring
wells. Columns are provided for recording all pertinent well?related information.
The WEL table is linked under a one?to?one relationship with the ST table,
as only one well can occupy a single location at a given time. |
| STN Table: The
STN, or substation, table will hold any additional sample information for
a given station. This table is used so that multiple sample types, for example,
soil and water, can use the same location information. The ST table is linked
to the STN table in a one?to?many fashion since it is possible that there
can be many substations at each station. |
| FOBs Table: Field
observations will be made at each station. A list of field observations
is included in the FOBs, or field observations, table. Site-specific information
such as time, temperature, water flow, and water elevation are stored here.
This table is linked to the STN table and the ResultsCFO table. |
| ResultsCFO Table:
The measured values for field observations will be stored in the ResultsCFO,
or field observation results table. This table will resemble the results
table from laboratory analysis but will hold only field observation data.
It will be linked to the FOBs table. |
| SC Table: The
SC, or sample collection, table contains data regarding the actual sampling
event. Data fields include date, time, sample type, depth, and collection
equipment used. This table will provide a link between the substation and
the laboratory information. |
| Slab Table:
Laboratory details are stored in the Slab, or sample laboratory, table.
This table is the final link between the sample collection event and the
actual analytical laboratory results. This table stores laboratory information
such as basis, method, laboratory identification, batch, and sample preparation.
The analytic results, however, are held in a separate table. |
| RESULTS
Table: Analytical results are stored in the RESULTS table. This table
contains sample collection identification, analyte, dilution, result, units
and qualifier. The RESULTS table is linked to the SC table and then to the
STN, ST, and SU tables through cascading relationships. A lookup table is
also used in conjunction with other tables to provide consistent chemical
analyte names and units of measurement. |
| ChemGroups Table: The ChemGroups, or chemical groups, table
is a lookup table that holds information used throughout the database. As
data types are added, they will be made available to the other tables automatically.
The ChemGroups table contains the chemical analyte groups such as volatile
organic compounds, semivolatile organic compounds, pesticides and metals,
as well as polychlorinated biphenyls, petroleum, minerals, and sediment
sample types. These added analyte types are present as lookup information
for the field observations. This added flexibility creates a more robust
database, with reduced possibility for data entry error. |
| EISPTY
Table: This EISPTY table is used as a lookup table in the ST and STN
tables to identify point types. The EISPTY table contains lookup parameters
for various point types provided in the UTDMS. Example parameters include
sphere, gear type, channel bank, basis for analysis, chemical type, sample
matrix, drilling method, data qualifier, data use, data validation codes,
floodplain or land, data import status, United States Geological Survey
map type, perforation descriptors, quality assurance/quality control (QA/QC)
level, sample type, well use, horizontal reference datum, horizontal coordinate
method, coordinate position, elevation reference datum, elevation method,
and coordinate zones. |
| EISPAR Table:
The EISPAR table provides data flag information used in quality assurance
procedures. When combined with the EISPTY tables, various lookups are created
that are used throughout the RDBMS. |
| |
|
|
| |
| The goal of this attribute
database structure is to promote data integrity and completeness. No data
item, such as a sample identifier or a well name, is stored redundantly
in the database. Instead, a unique numeric key is used in the PT_KEY table
to prevent update anomalies. A unique numeric key is automatically created
in all tables as data are entered. (An update anomaly occurs when a meaningful
data item, such as a well name, is stored in more than one table but the
well name is changed in only some of the tables.) All data entered into
the RDBMS has an identifiable source document, and the data is stored exactly
as shown on that source document. If data conversion was necessary, the
converted data are stored in additional columns in the database. It was
of utmost importance that direct, real?time, and end?user access to the
data was developed through RDBMS and client/server solutions that mask data
complexity and promote data exploration and interpretation. |
| |
| GIS Design |
| |
|
NRIS is a clearinghouse
for all GIS data created in the state. Much of the data that existed up
to that point could be acquired through their map object oriented web
site. Stream flow information, census information, the MWCB program files,
TIGER files, small scale ownership coverages, and USGS quads ranging in
scales from 1:24000 to 1:2,000,000 are just some of the data that is available
to the public. Access to these types of data clearinghouses greatly reduced
our data acquisition costs. Although the state is fortunate to have the
NRIS clearinghouse, much of Montana is rural which results in a lot of
data that has not yet been created. For example, the USGS is just starting
to provide digital ortho quarter quads for portions of the state.
Due to the readily available
data from the NRIS site, much of the data had already been registered
to the state mandated coordinate system which is State plane NAD83 Feet.
Other data came from Federal agencies, many of which have a custom coordinate
system. For example, the Region VIII EPA, which would be final clearinghouse
of all the data, asked that all data be delivered in the Albers projection
using a custom Northing and Easting, as well as a custom point of origin.
On the other hand, the USGS provides imagery such as digital raster graphics
(DRGs) in Universal Transverse Mercator (UTM) NAD83 meters. The MWCB provided
mine locations in both latitude/longitude (with an unknown datum) as well
as Township, Range, Section, Quarter Section format. Other Superfund data
in the state of Montana used the UTM NAD83 meters projection. Due to an
expedited schedule, TtEMI was tasked with finding the most efficient route
to convert data so that it could be easily integrated and quickly available.
Reviewing the needs of the scientists showed that calculations such as
length, area, distance to stream, and distance of hauling routes would
be the basis of their analysis. In the selection of a projection that
maintained both area and length for a site that was only approximately
51 square miles running north to south, we found that the difference in
the various projections were approximately 0.1%. Since there appeared
to be no large difference in calculations for this specific area, the
most efficient route to integrating the data was to leave the raster data
in its original projection and convert all of the vector data. As a result,
the selected projection was UTM Zone 12, NAD83 meters.
|
| |
| Step 4:
Gathering GIS data needs |
|
With an established
base map of the site, data gaps were more easily identified. The most
glaring GIS data gap was the actual location of abandoned mines. Initially,
the EPA utilized all historical records, interviews with MDEQ employees
and private consultants, and historical aerial photography to identify
as many mine sites as possible. In addition, a majority of the USGS and
USFS mine locations were provided in latitude/longitude coordinates. Many
of these coordinates were calculated manually from USGS 7.5 quad maps.
Although many of the lat/long locations turned out to inaccurate, we did
get the names and an original count of 60 abandoned mines on record. Because
the mine site locations would be the basis of analysis and assessment
of risk, it was a priority to have an accurate location of the abandoned
mines and adits. Since the watershed was situated on mostly USFS land,
the USFS provided a source for historical aerial photography. The intention
was to save time and resources by using the aerial photography to locate
additional waste rock piles at known abandoned mine locations instead
of having field teams hike to each site in search of these locations.
Unfortunately, the aerial photography was flown at such a high elevation
it provided little ground resolution and the black and white nature of
the photos left room for an unacceptable margin of error. Other issues
for aerial photography included using recent imagery since several sites
had recently been reclaimed. The more difficult aerial photography issue
was the thick canopy of evergreen trees that shrouded the watershed. Considering
the size of the base map area and the fact that accurate extents of mine
locations can only be found when there isn't snow on the ground, the field
team had approximately three months to locate the abandoned mines and
adits. It would have been very difficult to accomplish this by simply
canvassing the area on foot for these types of sites.
One solution to this
challenge was to first focus on the 'priority mine sites'. Acquiring color
aerial photography that was flown at a low elevation (7,000 feet) and
scanned at a high resolution (2500 microns) enabled the field teams to
pinpoint their canvass areas more effectively. Field teams then used a
combination of the written historical information for the mines, the projected
lat/long locations, and a global positioning system (GPS) unit to accurately
locate mines in the area. Again, the thick canopy and steep terrain of
the watershed provided challenges to collecting GPS data.
Gathering GIS data in
the field also meant having accurate property ownership coverage. Prior
to any fieldwork, the EPA had contacted private property owners requesting
access to the abandoned mines on their properties. Homes outside of the
Rimini community were built on land located in USFS managed land, or private
land in Lewis and Clark or Jefferson Counties. Creation of the ownership
coverage required research at the county assessors office where many properties
were still maintained in metes and bounds descriptions.
|
| |
| Step 5: Providing
mapping products for preliminary assessment |
|
Establishing a base
map with mine locations sped up the field effort and increased the accuracy
of the map products and related assessments. Field maps were created for
daily use, modified and edited, and re-created for quality control. The
primary focus of the field effort was to compile a comprehensive physicochemical
inventory of abandoned mines in the watershed and identify mining waste
features that could have a potentially negative impact on surface water,
groundwater, ecology (terrestrial and aquatic), and human health. During
site reconnaissance, EPA identified a total of 150 abandoned mine sites
in the watershed. The purpose of the site reconnaissance was to visit
the abandoned mine sites that could be accessed, and measure and document
physical characteristics of the site features. Field personnel also conducted
an inspection of every tributary of upper Tenmile Creek to identify mine
sites that were in direct contact with these tributaries, or that could
come into direct contact during runoff events.
The following summarizes
the information that was gathered during the survey of each mine site
and added to the RDBMS and GIS.
|
| · General mine site survey information
- The mine site name, subarea name, the AMRB preliminary assessment number
(PA#), and numerical listing by the Montana Bureau of Mines and Geology
(MBMG#). The date and time the survey was conducted, a listing of survey
team personnel, and weather conditions were recorded. |
| · Mine site location - A brief
description including directions from the community of Rimini, accessibility,
mine site elevation, latitude, and longitude. Information regarding hazards
associated with structures and historical uses of the structures also were
listed. |
| · Mine site layout and size - A
detailed sketch of the mine site layout was created and included mining
features, such as potential waste sources, adits, shafts, and staining,
and environmental features, such as stressed vegetation, surface water sources,
groundwater seeps, ponds, and wetlands. Locations of potential borrow materials
were also noted. |
| · Mine
site features - Information was noted regarding features identified at the
site. The recorded information included: |
|
1. Distance of
the feature from creek or drainage
|
| 2. Each feature's
interaction with surface water |
| 3. Estimation
of each feature's area, volume, and/or discharge |
| 4. Feature geometry - dimensions,
shape, aspect, and slope |
| 5. Feature
stability (slope conditions, erosion, etc.) |
| 6. Rock mineral
identification (visible determination of mineralogy, observation of pyrite,
etc.) |
| 7. Surface water
field parameters |
| 8. Types of samples
collected and their location |
| 9. General comments
related to the feature including the presence and condition of vegetation,
color, debris, and degree of staining |
| The collection
and retrieval of this data set the groundwork for analysis by each discipline. |
| |
| Step 6:
Using the GIS as a tool |
| The capacity to use GIS
was different for each data user group. The EPA initially used the information
as a means of educating the public at public meetings. The data was used
to display the National Priority List (NPL) designations, point source pollution
locations, and to show the threats to human health in the form of hot linked
images of raw pollution from high priority abandoned mine sites. TtEM Inc.
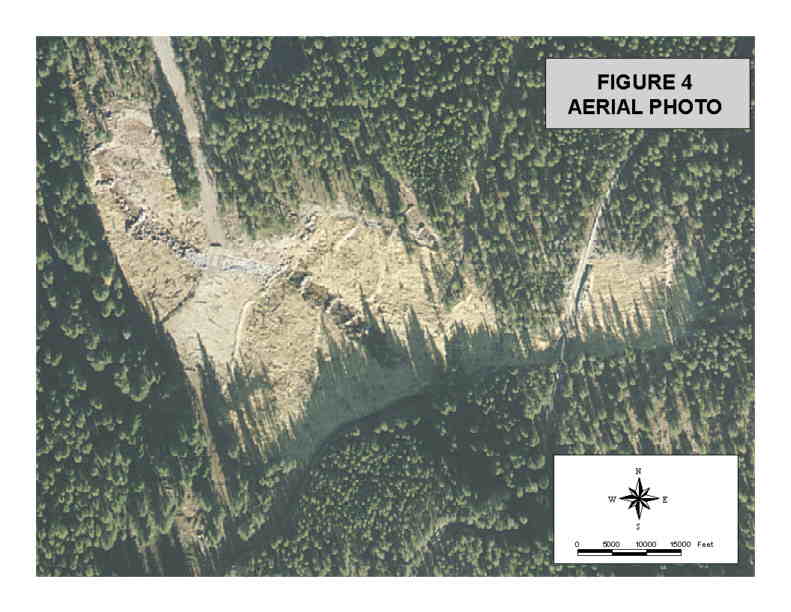
used the GIS as a method of tracking down waste rock piles from low level,
high-resolution color aerial photography. With a ground resolution of 1:600,
any exposed waste rock piles larger than 50 feet in diameter could be pinpointed
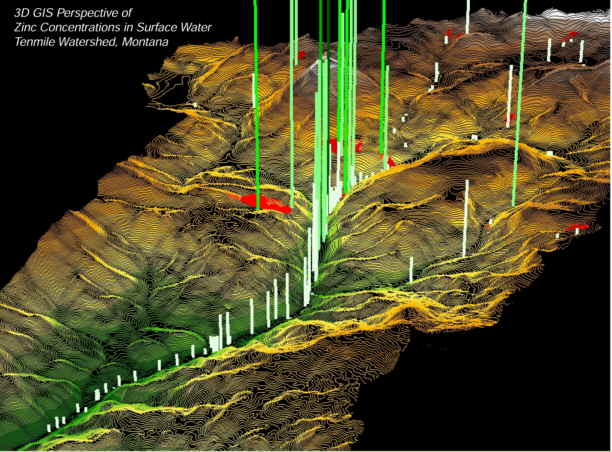
for field reconnaissance teams (Figure 4). The GIS team created
three-dimensional, color-coded graphical displays of historic arsenic, cadmium
and lead concentrations for each tributary to Tenmile Creek. Scientists
could easily see that metal concentrations in surface water were decreasing
in the downstream reaches (Figure 5). |
| |
|
|
| |
|
|
| |
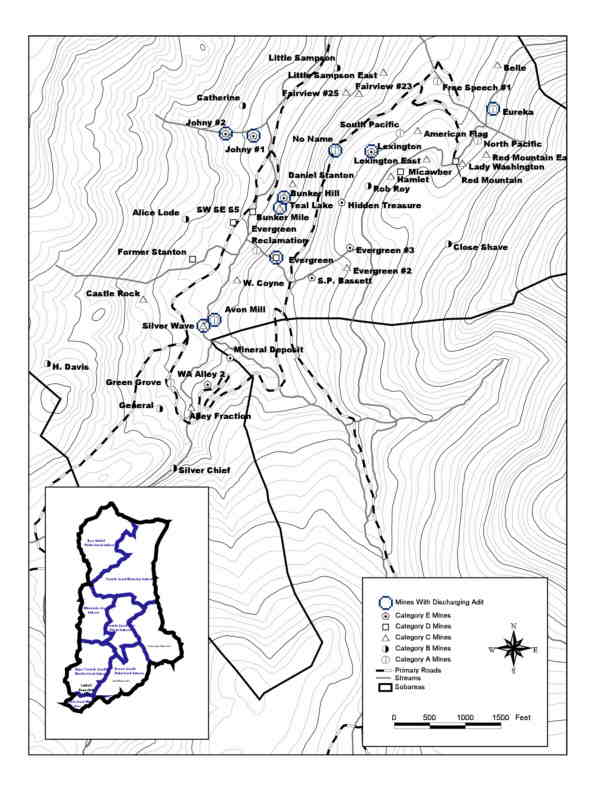
| One important product
provided by a GIS system was the establishment of hydrologic units within
the watershed. Using 20-foot contours and Esri's Spatial Analyst Tool, the
51 square mile Tenmile Creek watershed was broken down into 7 sub-watersheds
or 'Subareas' (Figure 6). This provided the engineers and
scientists the opportunity to look at each individual component of the watershed
to assess its impact on the whole. In depth studies were performed at each
subarea, including an assessment of groundwater, surface water, stream sediments,
mine waste material, and residential soils, proximity to the creek and sample
comparisons to established regulatory standards for drinking water and aquatic
life. |
| |
|
|
| |
| Based on priorities outlined
in the beginning of the project, TtEM Inc. developed a process of site prioritization
and categorization to guide and streamline the evaluation and selection
of remedial alternatives that would address the worst contaminant sources
first. With the information gathered at each site, the EPA could conduct
a precursory analysis of each site rather than a full investigation and
alternative analysis for each individual mine site. This process was referred
to as Mine Prioritization and served as criteria for ranking the risk to
human health and the associated methods of reclamation. The process for
establishing mine prioritization is a two-step process. |
| |
| · First, a numeric score was assigned to each site based on impact
of the solid media (waste rock and tailings) at the site on actual and potential
direct contact risks, surface water, and groundwater. Impacts associated
with adit discharges were addressed separately. Each mine site was ranked
relative to other mine sites based on available site data and field observations. |
| |
| · In the second step, with the help of team chemists,
hydrologists and GIS personnel, the sites were grouped into five categories
based on overall site score. The categories range from Category A (sites
exhibiting little potential for impact on human health and the environment)
to Category E (sites having the greatest potential for impact). In the detailed
analysis of alternatives for the waste rock and tailings media, all potential
remedial alternatives were evaluated for each category of sites. Since sites
with similar features and impacts generally were scored similarly and therefore
grouped together, the evaluation of alternatives was streamlined and made
more efficient by evaluating those sites as a single category. Preferred
remedies for each category of sites were presented in a proposed remediation
plan. Remediation cost estimates were developed by subarea and site category
by summing all cost elements for those mine sites in each site category
for each subarea. |
| |
| As a result, the following
potential remedial alternatives for waste rock and tailings were developed
and retained for detailed evaluation: |
| Alternative WR1: No
action |
| Alternative WR2: Surface
Controls |
| Alternative WR3: Containment
(with an earthen cap) |
| Alternative
WR4: Excavation and On-Site Disposal at the Luttrell Repository |
| |
| For Categories A and
B waste rock and tailings, all alternatives (including no action) provide
overall protection of human health and the environment and meet all evaluation
criteria to approximately the same extent. While cleanup actions at these
sites would likely reduce some potential risks, the overall risks to human
health and the environment at these sites are small and currently considered
acceptable. The environmental disturbance required to reach these sites
under Alternatives WR2,WR3, and WR4 likely offsets the benefits gained by
implementing these alternatives. |
| |
| For Category C sites,
the no action alternative is not expected to provide overall protection
of human health and the environment. These sites currently pose low to moderate
risks to human health and the environment. While Alternatives WR2, WR3,
and WR4 all satisfy the evaluation criteria, Alternatives 3 and 4 are more
costly than Alternative WR2. Although Alternative WR2 provides only slight
to moderate reduction in risks, the risks associated with Category C sites
require only a moderate reduction in order to be at acceptable levels. The
environmental disturbance required to reach these sites with the larger
construction equipment associated with Alternatives WR3 and WR4 likely offsets
the benefits gained by these alternatives. |
| |
| For Category D and E
sites, the no action alternative and Alternative WR2 are not expected to
significantly reduce risk to human health and the environment. These sites
currently pose moderate to high risks to human health and the environment.
Both Alternatives WR3 and WR4 satisfy the evaluation criteria, however Alternative
WR4 is the more effective than Alternatives WR3. In addition, for most of
these sites Alternative WR4 is expected to be less costly than Alternative
WR3. |
| |
| V. Conclusions |
| |
| The GIS that was designed
for the Tenmile Creek watershed was created as a collaborative effort from
the grassroots level to the Federal government. The purpose of the GIS was
to ensure that all key contaminant release factors were considered and that
the cleanup reduced as much risk as possible in the most cost effective
manner. Using GIS helped the EPA to focus on a watershed approach to cleanup
and to consider other needs within the watershed. For example, the state
of Montana (through DEQ) is obligated to develop a total maximum daily load
(TMDL) allocation plan for the upper Tenmile Creek watershed by 2003. The
TMDL must address metals, habitat alteration, and turbidity in the stream
reach above Rimini and metals and flow alteration in the reach from the
Helena water treatment plant to Rimini. EPA's cleanup action will address
metal load reduction. In addition, EPA has collected site-monitoring data
that will be useful to DEQ in completing the remainder of the TMDL analysis
and preparing the TMDL plan. |
| |
| Information and data
used in the GIS will be invaluable for presenting information that is understandable
to engineers, scientists and the general public in documents such as the
Remedial Investigations report and Feasibility Study. The Upper Tenmile
Creek GIS will continue to be an essential tool to evaluate potential remedial
action alternatives. |
| |
| |
| |
