New York City�s New Base Map
The Holy Grail?
![]()
Virginia Richter and Gary Ostroff, P.E.
PRESENTED AT THE TWENTYFIRST Esri USERS CONFERENCE
July 9-13, 2001
Abstract
New York City (NYC), a city dating back to the infancy of this country, is still in a state of flux. Cartographers are still trying to deal with the one city, many base map dilemma and HydroQual is no different. HydroQual has been trying to depict various aspects of the city, uniformly for the last 20 years and to no avail. We will discuss the many base maps of NYC as well as the eagerly anticipated new planimetric base map.
Background
The earliest explorers to hit the New York area arrived 25,000 years ago. They were descendants of the settlers that crossed the Bering Land Bridge from Siberia to Alaska. Manhatta (as it was called by the Indians) was far from pristine when the Europeans started to arrive. The earliest explorers, Hudson, Verrazano and Columbus all came to the "New World" in search of trade, jewels and gold. Little did they know what they would start!
The geography of Manhattan began to feel the lasting impacts of European settlers as far back as the 1600�s. Boundaries, sheep pasture, sawmills and Heerewegh, "The Long Highway" (Broadway) all started to make their marks on the landscape that would become New York City (see figure 1). Broadway is one of many irregular roads that date back to the time of the Dutch. Most of the unusual street patterns located near the tip of Manhattan date back to the early 17th century. Politics, immigration and time have all played significant parts in the alterations affecting the geography of New York City. With all these factors continually at play for over 400 hundred years keeping up with them is a monumental task.
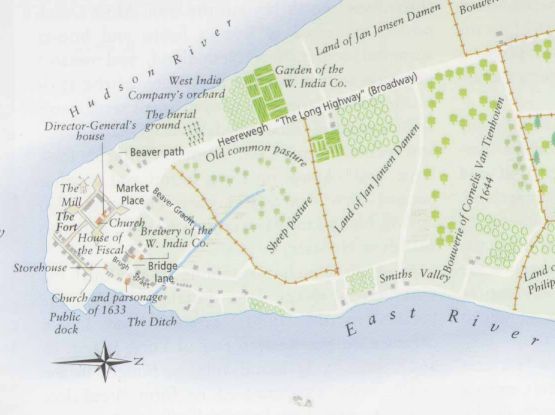
Figure 1: Manhattan Circa 1640�s (1)
Recent events in the City of New York (City) have provided a glimmer of hope for the Geographic Information System (GIS) user community. In the early 1990�s steps were taken to develop a planimetric base map for the New York City Department of Environmental Protection (DEP). This new base map provides the City GIS users with the hope that a sturdy foundation on which to build a huge warehouse of urban cartographic data can begin. And if everyone starts using it, everyone�s data will be in the right position with respect to everyone else�s.
Base Map
What is a base map? A base map is the frame to which all your ancillary data will be registered. Base maps can be river networks, shorelines or parcel maps, to name a few. This base allows all users to generate numerous data layers, such as schools, floodplains or drainage areas, at different times and places which will develop into an evolving spatial database.
The accuracy of this base map will determine how your other layers look in relation to each other as well as your base map. Every base map has its own intrinsic shortcomings. Some are appropriate for your needs and some are not. For example, a basemap containing roads would not be useful in locating floodplains within a town. However, that same roads layer would be useful to locate new development and its relationship to existing development. These are some of the more fundamental issues cartographers face while trying to present their data.
The New York City Department of City Planning (DCP) developed a copyrighted digital product known as the Bytes of the Big Apple. The Bytes of the Big Apple contain schematic representations of the block and lots for the City, a rough parcel map if you will. The block and lot files are by no means a surveyed deed map, nor do they have any legal standing.
The Bytes of the Big Apple files "were created for thematic mapping for planning applications at DCP. Spatial accuracy was not of primary concern in their creation. A limited set of control points were used to loosely fit the lines to the New York East State Plane Coordinate System." (2) The aforementioned disclaimer gives you a rough idea of what to expect. This is currently the average NYC GIS users idea of a base map for the City of New York.
Another shortcoming, once you have purchased a license from DCP, is the files are only available in *.DXF (AutoCAD format). Furthermore, they have the individual boroughs (counties) broken down into smaller jurisdictions called Community Boards. Thus making it more difficult to display larger areas. To display the whole city the user would have to "turn on" 59 community board files, as opposed to "turning on" five (5) files, one for each borough.
Through the years HydroQual has taken these digital files and assembled them into discrete shapefiles for the individual boroughs, for both the blocks and lots. The assembly process included developing a "taxlot" field in the attribute data for the lot data. The "taxlot" field is a unique identifier (key field) combining the block and lot numbers.
One must note that given all its shortcomings it is still a useful map for planning purposes as well as thematic maps, if for no other reason than its wide use. If you are able to obtain, the Department of Finances, Real Property Assessment Data (RPAD), you will be able to generate numerous thematic maps, such as land use, zoning, ownership, property values, etc. This task can be accomplished by joining the RPAD (parcel attribute data) taxlot identifier to the taxlot in the parcel file (block & lot). The RPAD file is updated annually once the tax assessment is completed for the City, to ensure the most up-to-date information available.
Before becoming involved with GIS, HydroQual used AutoCAD as a method of displaying data spatially. Through the use of AutoCAD we were able to generate a shoreline (where the water meets the land) file that is still useful to us today. This shoreline file helps supplement the work we do utilizing the Bytes of the Big Apple. As you can see in Figure 2, the parcel theme does not contain a shoreline. The waterfront lots extend well out into the surrounding rivers, terminating them at the legal bulkhead or pierhead lines. In fact, on such lots, most of the area may be under water. This proves to be problematic for analysis purposes as well as mapmaking.
Figure 2: Relationship between blocks and shoreline
Furthermore, large transportation arteries that are under the jurisdiction of New York State, e.g. Bronx River Parkway, Brooklyn Queens Expressway, are only shown by the void where the Right-of-Way (ROW) is. The edge of pavement is not shown for these roadways. (See figure 3)
Figure 3: Discrepancies with the Bytes of the Big Apple
A predecessor to the parcel map is the DCP LION files. These are the digital street centerline files that are used for address geocoding. Even though it contains nothing but streets shown as a single line, this data is a fine map for tasks in which geocoding is the dominant mapping goal.
LION, however, suffers from several defects, including its lack of ancillary data, and low level of accuracy. Also, as you recall the parcel data is available in *.DXF format, the LION layers are available as MapInfo, *.MID/*.MIF formats. Once again this provides more data conversion issues for the GIS users.
As shown below (see figure 4) the block and lot data and LION data do not align correctly, thus providing the average GIS users more alignment tasks to contend with.
Figure 4: DCP LION and Block files
The NYC Landbase, the new planimetric base map or the NYCMap (pronounced nice map) are one in the same. They all signify the new base map funded by the DEP, which will aid the DEP as well as numerous other city agencies in their desire to coordinate the services they provide.
The NYCMap, as it is officially known, contains numerous data layers, such as street centerline, hydrology, rail lines, and building footprints to name a few. All of these layers have been captured using "digital orthophoto data is accordance with ASPRS accuracy for 1" = 100� Class I Large Scale Maps. The data will be developed to correspond to 100� scale accuracy to full advantage of the photography and the capability of photogrammetric instrumentation." (3)
The NYCMap is licensed through the City�s Department of Information Technology and Telecommunications (DoITT). DoITT maintains, licenses, distributes and keeps the GIS community apprised as to the status of the base map�s updates. Currently, there are new flyovers being done to update and maintain the accuracy of the NYCMap.
The most striking feature you will find about the new planimetric base map is its complexity and comprehensive nature. Anyone who knows the City of New York realizes that nothing is ever simple or easy. The NYCMap gives you bridges, tunnels, parkways, expressways, airport runways, curblines, parks, elevations and rivers. The only thing it does not give you is a GPS to locate yourself in real time!
For most users the NYCMap provides an excellent starting point with which to perform their transportation analysis, map generation, etc. The vector data may be useful; however, HydroQual finds the digital orthophotos the most impressive for day to day activities. The raster images, although dated (1996), still give you an instantaneous view of anywhere in the city. The images are seamless, mosaicked Mr. SID images (see figure 5). They can be viewed in a variety of GIS packages, including ArcView. Also LizardTech, Inc. provides a free data viewer called Mr. SIDViewer (available at http://www.lizardtech.com ).
Figure 5 : Mr. SID image of Governor�s Island, New York
These images are the base used to generate all the vector data mentioned previously; hence it gives you a snap shot of all the data at once. The only drawbacks to the Mr. SID images are that they are static and the file size is very large (100+ megabytes each). As mentioned previously, you can view the images in the Mr. SIDViewer, this package gives you the option to crop the area (s) you need, so you can work around the large file size.
The NYCMap vector data may be impressive, unfortunately there are some issues that need to be resolved with it. First and foremost there aren�t any separate political boundary files for each of the five (5) boroughs. Although the shapefiles and images are packaged and distributed on individual CD�s there isn�t a theme (polygon) file that shows the extent of each borough. Hence the data for the borough of Queens and Brooklyn, which are adjacent to each other, overlap (see figure 6). The most noticeable of these are the street centerline and curb (end of pavement) files. These overlaps do not impede ones work flow, not does it produce inaccurate results, it just makes it a little more complicated to produce borough specific maps or analyze data on a county by county basis.
Figure 6: Areas of Overlap in the NYCMap centerline files
Even though the NYCMap does not contain a specific county layer, HydroQual was able to merge parts of the hydrology and hydrology structures layers together to make a shoreline file (see figure 7) HydroQual�s definition of a shoreline contains the shoreline, piers, jetties and wharves located on the water�s edge. These are some of the most striking features that give NYC its distinctive and ever changing look.
Figure 7: NYCMap planimetric data
You can not address geocode using the NYCMap. As mentioned previously, the DCP has produced its LION file, which it hopes to have registered to the NYCMap shortly. However, in the interim you must either geocode using the old base maps (original LION, Bytes of the Big Apple) and then reproject the data or approximate its location by comparing two data (2) views.
There also isn�t a way to join parcel attribute data to any of the NYCMap�s layers. None of the vector data layers created with the NYCMap contain block and lot data. As discussed earlier the parcel file is only a schematic of blocks and lots, but it can be joined to the parcel data. Plans are in the works to re-align the Bytes of the Big Apple to the NYCMap, but since it is only a schematic the alignment will vary.
If you were to re-project the current Bytes of the Big Apple to the same projection as the NYCMap the misalignment may be anywhere from 30 feet to 250 feet apart in the two layers (see figure 8). The degree of misalignment varies over each borough, and is the smallest in Manhattan.
Figure 8: The NYCMap (red) and Bytes of the Big Apple "aligned"
Lastly, the most problematic error contained within the NYCMap is that it is new. That�s right it�s new! For years people have been generating GIS layers and haven�t been aligning it to the NYCMap (how dare they!). The quandary that faces NYC GIS users is whether to re-project their current spatial databases or to recreate it. This in itself is no small task.
I have been dreading the day when it would become an issue and that day is here. Not only do "we" have to regenerate years worth of data we must explain to the non-GIS users the how�s and why�s of what is happening to all of �their� GIS data.
Conclusions
The NYCMap may not provide you with the ability to geocode or even join with the parcel attribute date, but it does provide an excellent start. We can wait and see how the data conversion goes for the LION and Bytes of the Big Apple and only hope that their conversion process yields a product as useful as the new planimetric base map.
In conclusion, the Holy Grail is defined as "a cup or plate that according to medieval legend, was used by Jesus at the Last Supper and that later became the object of many chivalrous quests or the object of a prolonged endeavor." (http://www.dictionary.com) The NYCMap has been in the works for many more years than I have been a professional; however, I find myself feeling some level of relief, almost as if a long search has ended.
Keywords: base map, Bytes of the Big Apple, NYCMap, DCPLION, Department of Environmental Protection, ArcView
References
1. Homberg, Eric. The Historical Atlas of New York City: A Visual Celebration of Nearly 400 years of New York City�s History. New York: Henry Holt and Company, LLC, 1994.
2. City of New York, Department of City Planning. "TAX BLOCK Base Map Files in DXF� Format USER GUIDE." Available at http://www.ci.nyc.ny.us/html/dcp/html/blodxfgu.html
3. New York City Landbase � ARCINFO Coverage Database Design, Guidance Manual, October 16, 2000.
4. New York City, Department of City Planning, "DCPLION Single Lion Street Base Map in MapInfo Interchange Format (MIF) User Guide." Available at http://www.ci.nyc.ny.us/html/dcp/html/liongui.html
5. Burns, Ric and James Sanders. New York, an illustrated history. New York: Alfred A. Knopf, 1999.
Author Information
Virginia Richter, Project Scientist (vrichter@hydroqual.com)
Gary Ostroff, P.E. Senior Project Manager (gostroff@hydroqual.com)

HydroQual, Inc.
1 Lethbridge Plaza
Mahwah, New Jersey 07430
(201) 529-5151 f: (201) 529-5728