AVERAGE
DISTANCE FOR WAGES CUSTOMERS TO TRAVEL TO NEAREST PUBLIC BUS STOP
By Dwight Danie, GIS Manager, Sifu Zhou, Senior GIS Analyst, and Osmel Lopez, GIS
Technician
ABSTRACT
This study uses ArcView® and ArcView Network Analyst® to display at a US Census
Tract Level, the average walking distance from a WAGES (Work and Gain Economic
Self-sufficiency) customer to the closest public bus stop in Miami-Dade County,
Florida. We will discuss data
acquisition and processing issues, the use of Network Analyst to find the
shortest distance between multiple (thousands) of points, data aggregation and
presentation.
INTRODUCTION
The Community Services Planning Center (CSPC)
The Community Services Planning Center (CSPC) was established by the Florida
Department of Children and Families, District 11 in Miami-Dade County Florida. Our mission
is to assist the Department and the broader community with
using geographic information systems (GIS) technology and research to support
program planning, intergovernmental coordination and community development
assistance. Throughout South Florida, CSPC delivers services to a diverse
customer base, including neighborhood indicators & asset mapping, social
services master plan development, benchmarking, regional and community planning,
policy and program coordination, data collection and analysis.
History of Welfare Reform in Florida
The Federal Personal Responsibility and Work Opportunity Act of 1996 set in motion
the present process of welfare reform in the U.S. This Act changed Aid for Families with Dependent Children
(AFDC), an entitlement program, to Temporary Aid for Needy Families (TANF), a
program with a five-year lifetime cash assistance limit beginning October 1998,
requiring some form of work or educational activity as a condition for receiving
temporary aid. [1]
The State of Florida implemented welfare reform through Work and Gain Employment
Self-sufficiency (WAGES) Coalitions that were organized into 24 districts.District Eleven covers
the states' southernmost counties, Miami-Dade and Monroe. The District Eleven WAGES
Coalition merged July 1, 2000 with the Workforce Florida Inc., a public-private
partnership that:
- promotes entry into the workforce through education and workplace
experience,
- assists families transitioning from welfare to work,
- helps employers retrain and upgrade the skills of their employees,
- aligns education and training programs with higher-paying,
high-demand jobs,
- builds a more skilled workforce, and
- enhances the efforts to attract, grow and expand job-creating
businesses.
Safe and efficient transportation services to the welfare-to-work
population, along with childcare and job training, has emerged as one of the
most significant challenges to welfare reform.Without adequate transportation services, welfare recipients would
struggle each day to reach the job.[3]
OBJECTIVE
The CSPC was contacted in September of 2000 by workgroup consisting of members from
Florida International University, Metropolitan Planning Organization for the
Miami Urbanized Area and Training and Employment Council working on a project
entitled "Improving Welfare-to-Work Transportation Planning". The workgroup requested
a list of demographic and indicator data including the "average distance from each welfare
recipient to the closest bus stop".
The CSPC receives monthly updates from the State of Florida’s computerized WAGES
system. CSPC can only provide requests for confidential WAGES data at an aggregate level, (i.e. Census Tract,
ZIP Code, etc.) Therefore, the CSPC must geocode participant-level, (we do this quarterly) then aggregate the data
before dissemination. The objective of this project was to attach the component of the shortest walking distance to
the closest public bus stop to each participant record, then aggregate the data
at the Census Tract level while computing the Average walking distance for each
Tract.
METHODOLOGY
DataAcquisition
The source of WAGES data is local WAGES monthly ad-hoc report. A WAGES file contains the origin
addresses of approximately 11,000 participants.
Miami-Dade County Information Technology Department maintains a central repository of
countywide geographic data. It provides through its Public Information Group, a comprehensive set of GIS
coverages used for this project, the year 2000 Street Network and Public Bus
Stops and 1990 US Census Tracts. [4]
Data Processing
The monthly WAGES file was provided to CSPC in dBase format. Two new fields were
added to the file to store X and Y coordinates. To save a significant amount of time, cases were then
compared to previous month’s geocoded WAGES files. The X Y coordinates for the location of previous recipients at unchanged
addresses were retrieved from our data warehouse and records were updated
utilizing a Microsoft Access update query with records having matching both case
numbers and addresses.
Only new cases or cases that have changed address needed to be geocoded.An extract of these records were
first batch-geocoded with ArcView® address style "US Streets with Zone" with Zone being the participant’s ZIP
Code and with the parameters specified in Table 1.
Table 1: Batch Geocoding Parameters
| Spelling Sensitivity | 95 |
| Matching Score | 80 |
| Minimum matching score to be considered candidate | 30 |
In this project approximately 1000 records did not "batch match" nor match with
previous geocoding jobs. Two GIS technicians were able to interactively geocode these records in one day using
the parameters specified in Table 2.
Table 2: Interactive Geocoding Parameters
Table 2: Interactive Geocoding Parameters
| Spelling Sensitivity** | 80 |
| Matching Score | 80 |
| Minimum matching score to be considered candidate | 30 |
**During an interactive match a lower spelling sensitivity offers more candidates from
which to select.
| Total records | 14,346 |
| Cash/Non-WAGES | 3,348 |
| WAGES Participants | 10,998 |
| Geocoded | 10,929 |
| Un-Geocodable | 69 |
| Public Bus Stops | 11,700 |
| Street Arcs | 97,000 |
After geocoding, the extension packaged with ArcView, "AddXY(v1.0)", was utilized
to add an X-coordinate and Y-coordinate to each record. Again using a Microsoft Access update query these coordinates
were then attached to the original file.
The original WAGES dBase file, with now updated X and Y coordinates, was then added
to an ArcView View as an event theme.
Calculate Shortest Distance
To calculate the distance from each origin point to each destination point, we used
ArcView with Network Analyst, and Shortest Network Paths® (V1.1) extensions. Shortest
Network Path extension allows computations of multi-point origins to multi-point destinations.
Hardware/Software Limitations
The extension computes all possible solutions from an origin point to all
destination points. Which means that for 11,000 participants (origins) finding the shortest distance to 11,000
bus stops (destinations) approximately 121,000,000 computations would be
involved.
Our Dell Precision 410 NT Workstation, with dual 450 MHz processors with 128 Mb of
RAM, could not handle the number of computations (i.e. stopped responding) nor
accommodate the temporary files needed for this computation. Through trial and error we determined
that by splitting the WAGES file and the Bus Stop file into approximately 100 record segments and 150 record
segments respectively we could process each segment in about one half hour each.
Our Solution
To do this we manually selected origin points within contiguous area and converted
these to a new shape file ("Origin1"). We then manually selected surrounding destinations giving enough latitude to ensure
a "closest bus stop" and also converted this to a new shape file
("Destination1"). This process was done for all of the origins (WAGES participants).Eventually we had a
series of files "Origin1" to "Origin116" with their companion files "Destination1" to "Destination116".
To keep track and to prevent processing a participant more than once, we created a
field in the original WAGES file (SPLIT#) and using CALCULATE command, updated
the field during each selection.
Calculate Shortest Distance
The next step was to run the Shortest Network Paths® extension with each segment
pair using the Miami-Dade County Street Network and with the arc length field as
the cost field.
Origin File = Origin1.shp
Destination File = Destination1.shp
Street Network present in View
Cost Field = Length of Arc
The extension performs three operations. It creates two shapefiles with associated tables then joins the
table of the 2ndshapefile to the table of the origin table (Origin1). The first shapefile
contains polylines of ALL shortest paths to ALL destinations ("Result.shp"). The second shapefile contains the
shortest path to the NEAREST destination ("Result1.shp").
The Origin1 theme with its table now joined with the Result1 containing the shortest
distance to the nearest bus stop was then converted to a new shapefile
(WAGESdist1). This process was repeated for all Origin/Destination pairs.
This part of the process required a little over 50 hours of processing
time.
Once finished, all the "split" files (WAGESdist1.shp through WAGESdist116.shp
were combined into one shapefile (WagesDistAll)using the Geoprocessing
Wizard’s Merge function.
Attaching Boundary Data and Summarizing
Using the Geoprocessing Wizard’s function "Assign by Location", with US Census
Tract Coverage in the View, census tract boundary designations (TractID) were
"attached" to each WAGES participant record. The file was then converted to a new shapefile theme
(WAGESShortDist) and added to the View.
A summary by Census Tract was obtained by opening the Table of the Theme
WAGESShortDist, selecting the field TractID and summarizing the field while and
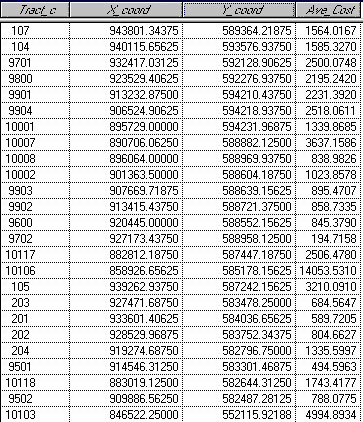
adding an average distance calculation to the output table (TractDist.dbf).This output table was then
joined to the table of the US Census Tract shapefile.
See table with average distances below.
DATA PRESENTATION
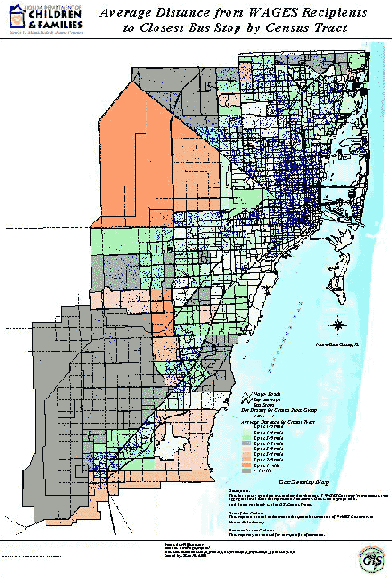
The final Census Tract table with Average Walking Distance was converted to
an Microsoft Excel spreadsheet and submitted to the Metropolitan Planning
Organization workgroup with a thematic map of the same data. See Map below.
The data along with other data supplied by the Community Services Planning
Center was incorporated into a study, "Improving Welfare-to-Work
Transportation Planning", in order to apply for a Federal Transit
Administration grant within the "Job Access and Reverse Commute"
section. The MPO was awarded $1,000,000.00 through this grant.
See Map below.
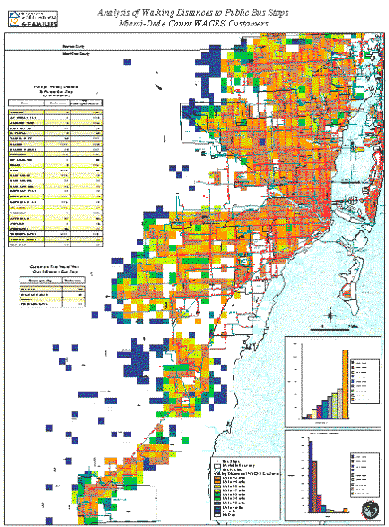
CSPC, using ArcView Spatial Analyst, also produced further analysis by producing half-mile celled
grid of the data. Image of Analysis Map.
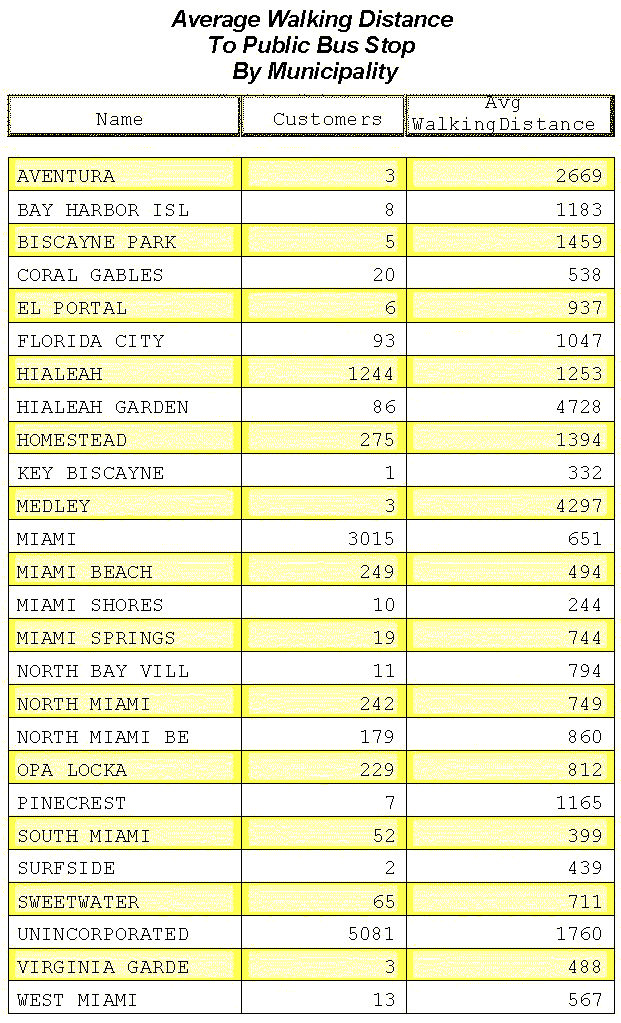
Table by Municipality
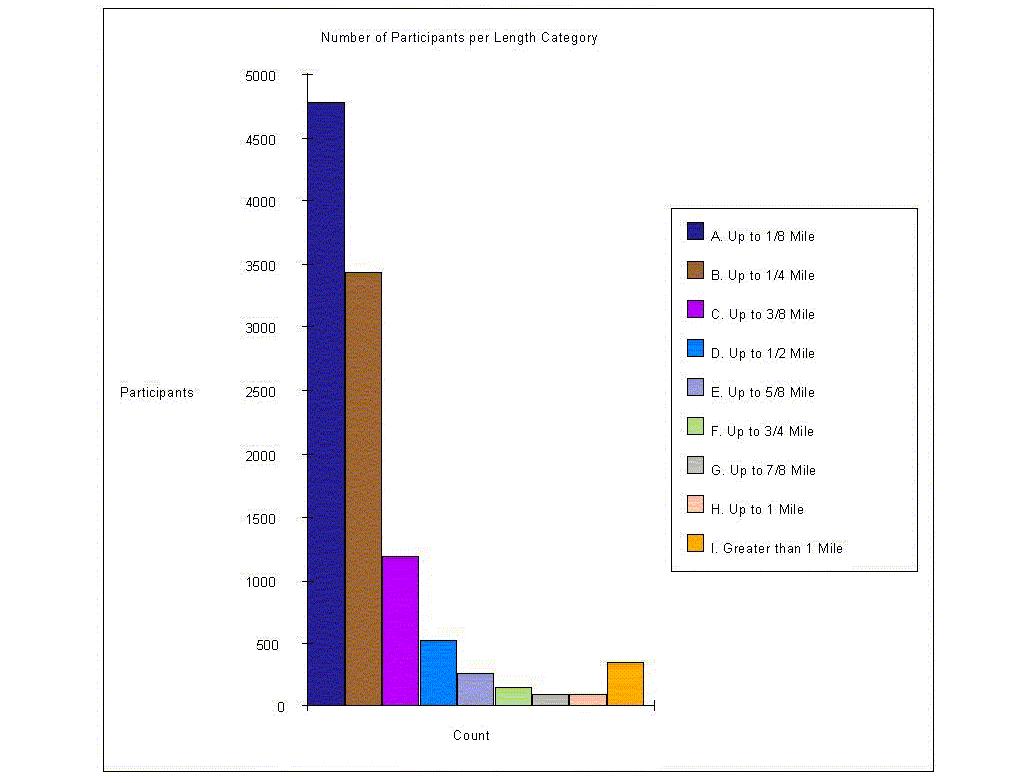
Graph of Participants in Length Category
OBSERVATIONS
Our analysis showed that about 9% of Miami-Dade County's WAGES participants
live greater than one half mile from the closest public bus stop. Studies have
shown that potential transit riders would be reluctant to walk more than this
distance. About 90% of participants who live further than one half mile from a
public bus stop live in the peripheries of western and southern communities of
the county, areas tending to be rural but undergoing development and having
population growths. Close to 1% of the WAGES participants that live within
urbanized communities in and around the greater Miami area live more that one
half mile from a public bus stop.
GIS technology offers the ability to study other factors that need
consideration in analyzing ones ability to access public transit system to
travel to work. These might include the proximity of these same transit systems
to daycare centers, to training centers and to jobs. And, one might also
consider commute time scheduling of transit systems and bus stop accommodations
(especially in South Florida), the numbers of transfers needed, and neighborhood
characteristics.
SUGGESTED USES/RECOMMENDATIONS
The Community Services Planning Center has used this same technology to
calculate averages distances clients to daycare centers, and to analyze patterns
of the placement of foster children within their own communities and school
districts. Other ways of using this technology might be: examining regional
differences in costs of care for children, or, site selection and staff
allocation studies with service centers, and protective investigation units.
The utilization of GIS technology is rapidly expanding in the field Social
Service planning. We envision and increasing use shortest distance analysis. The
Community Services Planning Center gave the Shortest Network Paths® (V1.1)
extension a thorough "workout" by processing as many points as we did.
We will continue to look for suggestions for streamlining the processing
multi-point origins to multi-point destinations efficiently.
[1] Federal Law Cite
[2] http://www.workforceflorida.com/wages/wfi/about/index.html
[3] http://thomas.loc.gov/cgi-bin/qiery/z?c104:H.R.3734.ENR
[4] http://www.co.miami-dade.fl.us/itd/Rates.htm.
