Abstract: Transportation systems evolve over time in response to changing travel demands and land use patterns. Land use patterns also experience frequent changes due to evolving human activities and transportation systems. In order to analyze interactions between land use changes and transportation system development, we need a GIS framework that takes into account the temporal component (when), the spatial component (where), and the thematic component (what) associated with these changes and their interrelationships. This paper presents a prototype temporal GIS implementation that is based on the ArcGIS 8 and is designed to facilitate exploratory analysis of land use and transportation interactions.
Time is an inseparable component of all changes that take place in the real world. A transportation system, for example, evolves over time through its construction, improvement and maintenance projects. Land use patterns also experience constant changes due to the changing needs of human activities over time. Furthermore, changes of transportation systems and land use patterns are not independent from each other. Land use changes often modify the travel demand patterns and lead to transportation system changes. Transportation system improvements, on the other hand, frequently create new accessibility levels that encourage changes in land use patterns. Many studies of land use and transportation interactions were conducted in the past few decades (e.g., Adams, 1970; Giuliano, G., 1989; Harris and Ullman, 1945; Hirschman and Henderson, 1990; Knight and Trygg, 1977; Martinez, 1995; Prastacos, 1986; Robert 1989). In recent years, there has been renewed interest in land use-transportation interaction models (e.g., Eradus, Schoemakers and van der Hoorn, 2002; Hunt, 1997; Ross and Dunning, 1999; Ryan, 1999; Wegner and Furst, 1999). Geographic information systems (GIS), which offer powerful functions of handling spatial (where) and thematic (what) data in an integrated environment, can be extended to include the temporal (when) data for studies of land use and transportation interactions. This paper presents a prototype temporal GIS implementation of ArcGIS 8 that is designed to facilitate exploratory analysis of land use and transportation interactions.
Conventional GIS are based on a static approach of data representation. Each GIS map layer is treated as a snapshot that captures the spatial pattern of a selected theme at a given time (e.g., land use of 1998). The time component of each snapshot is not recorded as part of the GIS database. Users often need to contact the original source or read a metadata document to find out the temporal component of a GIS data set. This approach of storing geographic data in snapshot GIS layers without explicit treatment of time introduces many shortcomings when we need to examine changes of spatial and attribute data over time. For example, a GIS overlay function must be repeatedly performed on pairs of snapshot land use layers in order to find out the land use change pattern from 1980 to 2000 (see Figure 1). This is obviously an inefficient and cumbersome way of analyzing land use change patterns over time.
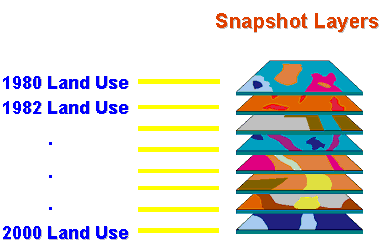
The problem becomes even more complex when we need to take into account the time lag effect of interactions between land use and transportation system changes. Certain land use changes (e.g., opening of a major shopping mall) may have an immediate major impact on traffic volumes in their surrounding areas, while other land use changes (e.g., a downtown redevelopment project) tend to induce changes in traffic patterns over a longer time period. Similarly, different transportation projects (e.g., construction of a beltway in a metropolitan area, expansion of an existing major highway, or building of a light rail system) are likely to have impacts on land use patters over different time horizons. In these cases, transportation analysts must measure the changes of one phenomenon (e.g., land use) introduced by the changes of another phenomenon (e.g., transportation) over an extended period of time. Current GIS based on the snapshot approach clearly do not provide adequate supports for such spatiotemporal query and analysis needs. There are growing research efforts of extending the conventional GIS to temporal GIS. A brief review of some selected temporal GIS approaches is provided below.
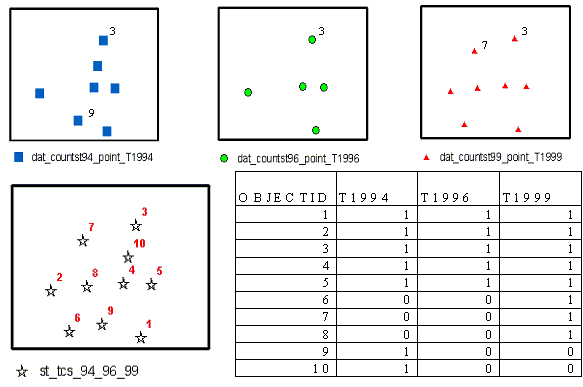
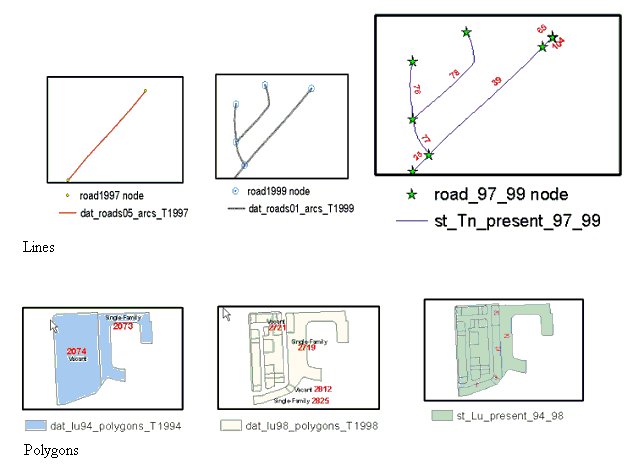
Change is a key concept of temporal GIS. Worboys (1998) suggests that a temporal information system must include a history of changes in the application world. The space-time composite data model is an attempt to improve the snapshot data model by combining the separate GIS layers representing different time points into a single GIS layer of all changes that have occurred over all time periods (Langran and Chrisman 1988, Langran 1992). In a space-time composite GIS layer, each record represents the smallest geographic unit that experienced changes in history and is assigned with time stamps to keep track of its changes over time. For example, Figure 2 shows a space-time composite layer that combines the traffic count stations of 1994, 1996 and 1999. The time stamps indicate that traffic count station #3 existed in all three years and traffic count station #7 existed in 1999 only. For line and polygon features, snapshot GIS layers of each theme for different years are again combined to derive the space-time composite layers (Figure 3). The resulting space-time composite databases are able to answer questions such as “Which locations experienced land use changes between t(i) and t(j)?” via a simple query of “Select all land use polygons where the land use type at t(i) is not equal to the land use type at t(j).”
Peuquet and Duan (1995) propose an event-based spatiotemporal data model (ESTDM) that is based on the TRIAD GIS database framework presented in Peuquet (1994). The ESTDM organizes the changes under an event list that is composed of individual event entries. Each event entry has a time stamp and consists of a set of components. A component stores the new value of all grid cells that experienced changes of a specific attribute from t(i-1) to t(i) and the locations of grid cells that changed to the new value. Run-length encoding is employed to store the locations of grid cells with changing values as token arrays in order to reduce the storage space requirement. Each grid cell is equivalent to the smallest spatial feature stored in the space-time composite model that permits the storage of its change history. The ESTDM also includes a header file with a time stamp of t(0) pointing to the base raster layer of the initial state of the entire study area. This design allows the ESTDM to record only amendments with respect to the initial and previous states.
Worboys (1992, 1994) suggests an object-oriented spatiotemporal data model that represents objects as two-dimensional spatial objects along with a third dimension for the event time associated with each object. The temporal dimension is defined as orthogonal to a 2D space to model the entities in an application domain. The basic element in the data model is a spatiotemporal atom that has homogeneous properties in both space and time. Spatiotemporal atoms (ST-atoms) are used to form spatiotemporal objects (ST-objects) that represent changes of real world entities. The data model maintains persistent object identifiers for both ST-atoms and ST-objects in order to uniquely keep track of their associations and the change history. Worboys (1998) later extends his approach to a spatio-bitemporal model that includes both event time and database time as two orthogonal axes to record the existence of an object in the real world and in a database system, respectively. Yuan (1996, 1999), on the other hand, proposes a conceptual structure of three-domain data model that consists of semantic domain, temporal domain, spatial domain, and domain links. The semantic domain defines real world entities with unique identifiers throughout the study duration. The temporal domain stores each time instance as a unique object, while the spatial domain is based on the space-time composite data model to derive a set of common spatial features with unique identifiers. Domain links are used to record the links among semantic, temporal, and spatial objects with their unique identifiers. The temporal GIS literature discussed above indicates some important considerations in the design and implementation of a temporal GIS. This study adopts and extends these key concepts to design and build a temporal GIS, which is based on the ArcGIS 8 geodatabase data model and custom programming with ArcObjects, for exploratory analysis of land use and transportation interactions.
In order to analyze interactions between different change patterns (i.e., land use changes and transportation system changes in this study), we need a design framework that takes into account the time element (when), the location element (where), and the attribute element (what) associated with these changes as well as their interrelationships. Sinton (1978) suggests a measurement framework of using location, time and attribute to serve as the “fixed”, the “controlled”, and the “measured” components when performing measurements of a single phenomenon. This results in a total of six possible measurement scenarios (see Table 1). For example, scenario 4 indicates that we can "fix" time (e.g., 1996) and "control" attributes (e.g., streets with average daily traffic higher than 10,000) to "measure" the locations of streets meeting the attribute criterion at the fixed time.
Table 1: Sinton's measurement framework.
For spatiotemporal analysis of interactions between two different phenomena, we propose a modified version of the Sinton's measurement framework (see Table 2). Under this modified framework, users can choose between transportation features, land use features and time as the "fixed", the "controlled" and the "measured" components. For example, scenario 2 allows users to “fix" locations and attributes of transportation features (e.g., select highway segments with a level of service "E" in a user-specified area) and “control" time (e.g., 1995 to 2001) in order to "measure" the land use changes in the user-specified area over time. It is important to note that this study takes an approach of using the existing GIS functions as much as possible while adding new temporal analysis capabilities to the system. In other words, this study does not attempt to develop a temporal GIS system from scratch. Instead, it aims at extending an existing GIS (i.e., ArcGIS 8) to provide additional functions of exploring spatiotemporal interactions between land use and transportation systems. We label the transportation and land use components in Table 2 as "Space-Attribute", along with time as the third component, to reflect this approach. In fact, both transportation and land use GIS databases are fully integrated with the time component in the system design as described below.
Table 2: Measurement framework of spatiotemporal analysis of two phenomena.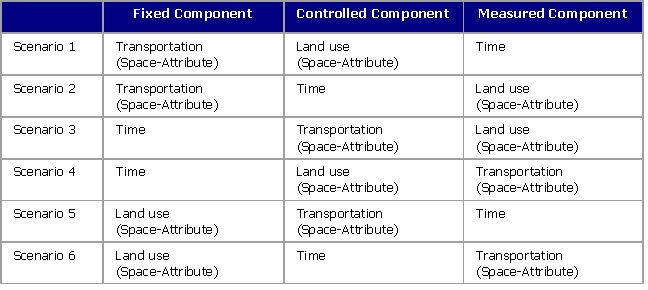
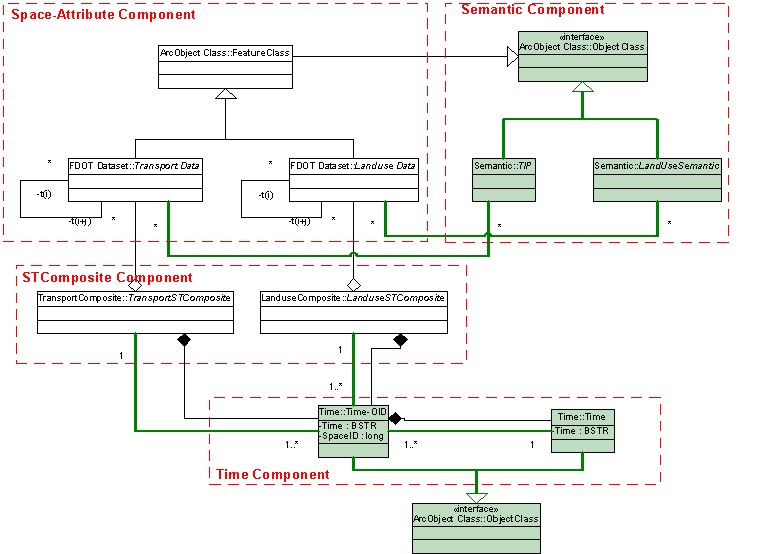
Figure 4 shows a unified modeling language (UML) diagram of the temporal GIS database design. As mentioned before, this study uses the ArcGIS 8 geodatabase and custom programming with ArcObjects to develop a temporal GIS for exploring land use and transportation interactions. The "space-attribute component" block in Figure 4 deals with the snapshot GIS layers in ArcGIS. The "space-time (ST) composite component" block consists of a set of custom Visual Basic programs to generate space-time composite GIS databases from the snapshot GIS layers. During this process, the custom programs also automatically create a Time Object Class to record all unique time instances associated with the snapshot GIS layers, as well as a Space-Time Object Class to associate each geographic unit in a space-time composite database with all time instances that exist in the individual snapshot layers (see the "time component" block in Figure 4). In addition, the custom programs keep track of the history of object identities as the geographic features change their locations from one snapshot to the next snapshot. The "semantic component" block in Figure 4 is designed to handle entities that are associated with different locations and attributes at different time instances. For example, a transportation improvement project (TIP) can posses multiple phases. Each phase may be associated with works on different highway locations and may have different attribute values (e.g., budget amount spent at each phase). To facilitate spatiotemporal analysis of such processes as transportation improvement projects and land development projects, we define Semantic Object Classes that allow linkages of a single semantic object instance to multiple locations and attributes over time.
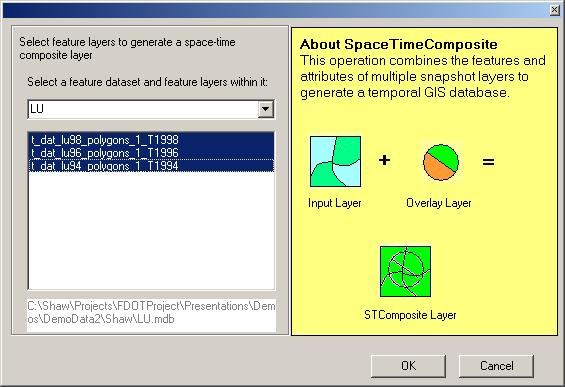
In addition to the custom programs for creating temporal GIS databases from the snapshot layers, this study also develops a set of user interfaces for exploratory analysis of spatiotemporal interactions between land use and transportation system changes. Since ArcGIS 8 does not provide built-in functions for users to work with temporal GIS data, this study develops a user interface wizard to lead users through spatiotemporal exploratory analysis of land use and transportation interactions according to the six scenarios presented in Table 2. With the open development environment of ArcGIS and ArcObjects, custom programs can be compiled into dynamic link libraries (DLLs) and added into the user interfaces of ArcGIS applications. In the prototype implementation of this study, four DLLs are added as custom tools in ArcMap. The first three custom tools provide users with functions to set global environment variables and to generate temporal GIS databases from the snapshot layers. For example, Figure 5 shows the dialog window for users to choose snapshot layers in order to create a temporal GIS database.
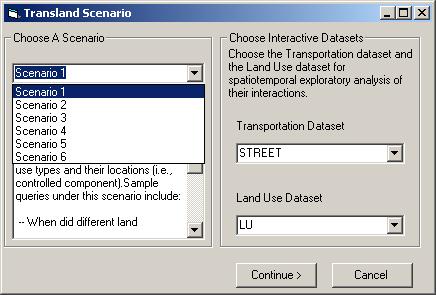
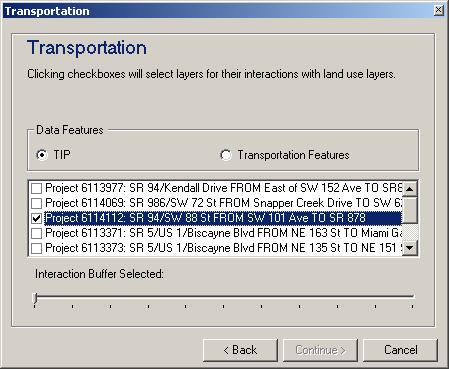
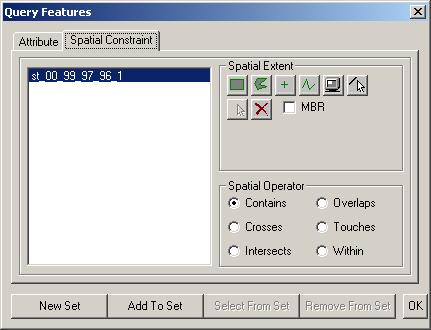
The fourth custom tool implements the six scenarios shown in Table 2 for users to explore land use and transportation interactions. A series of dialog windows will lead users to specify the spatial, attribute, and temporal characteristics of transportation and land use features to explore their spatiotemporal interactions based on the chosen scenario. Figure 6 shows the first dialog window for users to choose among the six available scenarios for spatiotemporal analysis. Once a scenario is chosen, the user interface will display the appropriate dialog windows to take users through the specifications of the "fixed" component and the "controlled" component in order to "measure" the third component. For example, Figure 7 shows the dialog window for users to specify the "fixed" transportation data for analysis under the scenario 1, which "fixes" transportation component and "controls" land use features to "measure" the time component associated with the changes. Users can choose either TIPs or other transportation features as the fixed transportation component. A buffer distance can be specified to limit the search of land use features around the fixed transportation component for exploring their spatiotemporal interactions. Users also can use queries based on attribute data and/or interactively define a spatial extent to select a subset of transportation features as the fixed transportation component (e.g., select only the highways that have traffic volume higher than a certain level and are located within a particular area; see Figure 8).
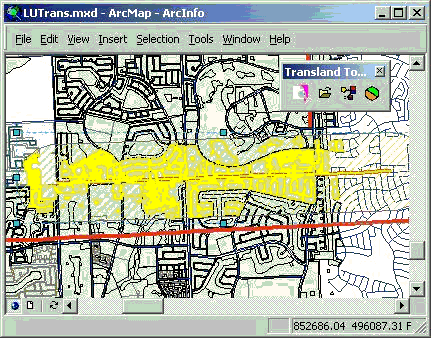
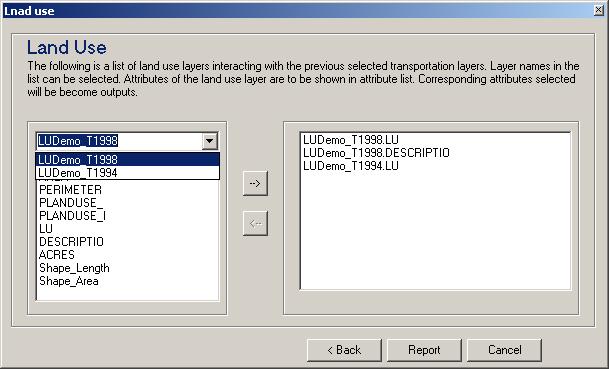
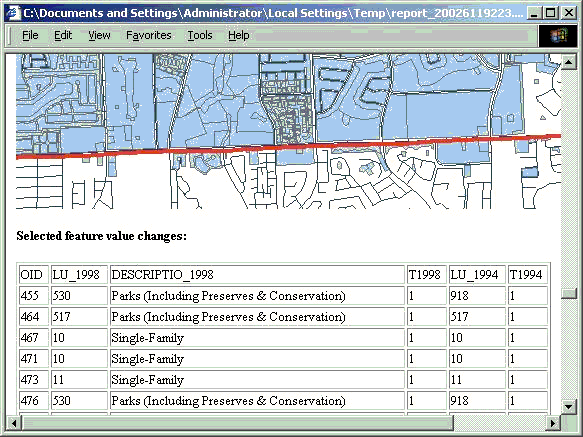
Once the fixed transportation component and a buffer distance have been specified, the custom tool then searches through the temporal GIS databases and selects all land use features that ever existed within the buffer zone around the fixed transportation component. Figure 9 shows the selected land use features within a buffer zone around a fixed transportation improvement project according to the scenario 1. Furthermore, users can control the attribute data fields in each original snapshot layer that will be included in the final summary report. For example, Figure 10 selects the land use code (LU) and the land use description (DESCRIPTION) of 1998 as well as the land use code of 1994 to be included in the final summary report. The custom tool then creates a hypertext markup language (HTML) document to present the final results of spatiotemporal interactions between transportation and land use features (see Figure 11). The HTML report uses a java applet to show an animated map display of changes over time and includes tables of attribute values and summary statistics at the time instances specified by the user.
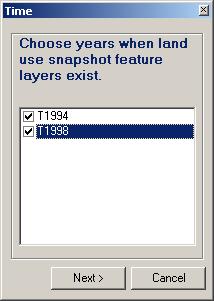
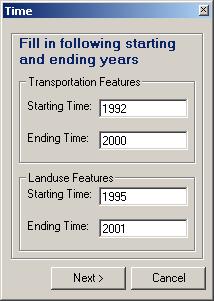
Under the scenario 2, users can "control" the time component to select the year(s) to be included in the analysis. For instance, transportation analysts may want to evaluate the land use change patterns surrounding a particular TIP one year and five years after the TIP is completed. In this case, users can use the dialog window shown in Figure 12 to control the years that land use data will be included in the analysis. For the scenario 3, time is the "fixed" component for users to specify the years that transportation data and land use data will be included in an analysis. The system design offers users with a flexibility of choosing different time periods for transportation data and land use data to be included in an analysis (see Figure 13). This allows transportation analysts to examine the time lag effects of land use and transportation interactions. Analyses of the scenarios 4-6 are similar to those of the scenarios 1-3 except for different permutations of transportation, land use and time as the "fixed", the "controlled" and the "measured" components, respectively.
Conventional GIS have provided many powerful functions of storing, querying, analyzing and displaying spatial and attribute data in an integrated environment. Given that time is an inseparable component of all changes taking place in the real world, there have been many research efforts on temporal GIS. Extending the current GIS into a temporal GIS involves many challenges as reported in the literature. With the open development environment available in commercial GIS packages such as the ArcGIS 8, it is now feasible to extend the static GIS approach into a temporal GIS. This study incorporates several temporal GIS concepts and implements them with the geodatabase data model and custom programming with the ArcObjects in ArcGIS 8 to develop a spatiotemporal exploratory analysis environment for land use and transportation interactions. The prototype implementation includes tools of converting snapshot GIS layers into temporal GIS databases and then performing exploratory analysis of interactions between land use and transportation over time. A framework of six scenarios allows transportation analysts to "fix", to "control", and to "measure" among the transportation, land use and time components such that we can examine either the impacts of land use changes on transportation systems or the effects of transportation system changes on land use patterns over different time periods.
This study demonstrates the potential of adding temporal GIS capabilities into an existing commercial GIS package. At this stage, the prototype system includes a limited set of spatiotemporal analysis and visualization functions. It also uses many existing GIS functions in ArcGIS 8 that are not designed for temporal GIS. As a result, the performance level is relatively slow for large spatiotemporal GIS databases. Future studies will focus on the development of additional class modules and functions to improve the performance level (e.g., adding temporal indexes and/or linked lists to keep track of changes over time) as well as to expand the spatiotemporal GIS analysis and visualization functions.
This project is funded by the Florida Department of Transportation's University Research Program. We would like to acknowledge the inputs from our research collaborators, Dr. Fang Zhao and her colleagues in the Department of Civil and Environmental Engineering, Florida International University, Miami, Florida. Helpful comments from Dr. Bruce Ralston on a draft version of this paper are gratefully appreciated.
Adams, J., 1970. "Residential structures of Midwestern cities," Annals of the Association of American Geographers, 60, 48-63.
Eradus, P., A. Schoemakers and T. van der Hoorn, 2002. "Four applications of the TIGRIS model in the Netherlands," Journal of Transport Geography, 10, 111-121.
Giuliano, G., 1989. "New directions for understanding transportation and land use," Environment and Planning, 21A, 145-159.
Harris, C.D. and E.L. Ullman, 1945. "The nature of cities," Annals of the American Academy of Political and Social Science, 242, 7-17.
Hirschman, I. and M. Henderson, 1990. "Methodology for assessing local land use impacts of highways," Transportation Research record, 1274, 35-40.
Hunt, J.D., 1997. "A description of the MEPLAN framework for land use and transport interaction modeling," The 77th Annual Transportation Research Board Meeting, Washington, D.C.
Knight, R. and L. Trygg, 1977. "Evidence of land use impacts of rapid transit systems," Transportation, 6, 231-247.
Langran, G., 1992. Time in Geographic Information Systems. London: Taylor & Francis.
Langran, G. and N. Chrisman, 1988. "A framework for temporal geographic information," Cartographica, 25, 1-14.
Martinez, F.J., 1995. "Access: The transport-land use economic link," Transportation Research, 29B, 457-470.
Peuquet, D.J., 1994. "It’s about time: A conceptual framework for the representation of spatiotemporal dynamics in geographic information systems," Annals of the Association of American Geographers, 84, 441-461.
Peuquet, D.J. and N. Duan, 1995. "An event-based spatiotemporal data model (ESTDM) for temporal analysis of geographical data," International Journal of Geographical Information Systems, 9, 7-24.
Prastacos, P., 1986. "An integrated land use-transportation model for the San Francisco region: 1. Design and mathematical structure," Environment and Planning, 18A, 307-322.
Robert, C., 1989. America's Suburban Centers: The Land Use-Transportation Link. London: Unwin-Hyman.
Ross, C. and A. Dunning, 1999. "Land use transportation interaction: An examination of the 1995 NPTS data," Nationwide Personal Transportation Survey Symposium, Federal Highway Administration, Washington, D.C., 129-191.
Ryan, S., 1999. "Property values and transportation facilities: Finding the transportation land use connection," Journal of Planning Literature, 13, 412-427.
Sinton, D.F., 1978. "The inherent structure of information as a constraint to analysis: Mapped thematic data as a case study," in G. Dutton (ed.) Harvard Papers on Geographic Information Systems, vol. 6, Reading, MA: Addison-Wesley, 1-17.
Wegner, M. and F. Furst, 1999. "Land use transport interaction: state of the art," Deliverable 2a of the project TRANSLAND of the 4th RTD Framework Programme of the European Commission. Institut fur Raumplanung, Univeristat Dortmund.
Worboys, M.F., 1992. "A model for spatio-temporal information," Proceedings of the 5th International Symposium on Spatial Data Handling, Vol. 2, 602-611.
Worboys, M.F., 1994. "Object-oriented approaches to geo-referenced information," International Journal of Geographical Information Systems, 8, 385-399.
Worboys, M.F., 1998. "A generic model for spatio-bitemporal geographic information," in M.J. Egenhofer and R.G. Golledge (eds.) Spatial and Temporal Reasoning in Geographic Information Systems. New York: Oxford University Press, 25-39.
Yuan, M., 1996. "Modeling semantics, temporal, and spatial information in geographic information systems," in M. Craglia and H. Couclelis (eds.) Geographic Information Research: Bridging the Atlantic. London: Taylor and Francis, 334-347.
Yuan, M., 1999. "Use of a three-domain representation to enhance GIS support for complex spatiotemporal queries," Transactions in GIS, 3, 137-159.