Local government has anxiously awaited the Census 2000 data, and now that
it is available many users are finding the multiple, large data sets difficult
to manage or query. Pierce County, Washington, solved this problem for its 400
GIS users by developing a Web-based census query application that is also accessed
by the public. A demonstration of the site will highlight information on how
to derive optimal data sets, organization and navigation, an intuitive user
interface for viewing and downloading data, and an interactive map interface
to query County census data. Enabling efficient use of census data has allowed
users to quickly prepare grant applications and perform ad hoc analysis of trends.
When the U.S. Census Office first published the Census 2000 data, county personnel and news organizations were scrambling to report the information and view the results in a map. County/city departments, local transportation agencies, and health organizations depend on demographic information in order to forecast, plan, and manage community services. The census data is also used as the basis for grant appropriations and Federal government programs, as well as research for locating new businesses in the county.
The Census 2000 data should be able to meet these needs, but the files are large and complex, and require extensive processing to be useful. Most people do not have the time, expertise, or resources needed to extract answers from the data to even simple questions.
After many data requests and discussions with census data users, it was clear that a web site containing the information for Pierce County would be a tremendous time-saver. The more we learned about users' project needs, the more the site's data requirements expanded from simple tables to maps, table searches, and interactive geographic data queries.
The Census provides two types of data: geographic and tabular. The geographic data is available in the US Census TIGER file format representing the various levels of census geography. The tabular data reports the information generated from responses for each level of geography. For the 2000 census, the US Census Bureau published the data sets over the Internet, making the data free and easily accessible for everyone. The first step in the data production process was to download both types of data.
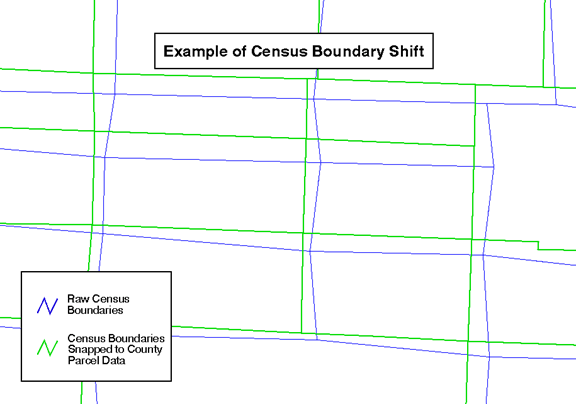
The idea was to be able to use the census geography data files with other data layers. Since the raw census geography data files were not registered to any existing Pierce County GIS data layer, the census data could not appropriately be used to perform any spatial analysis operation accurately. To get the census geography data in a useable format, it was necessary to do various conversions on the data to follow certain parameters that coincide with the rest of our data layers. This included changing the file format to function in Pierce County GIS systems, projecting the data into the Pierce County coordinate system, and registering the data to the Pierce County map base.
Instead of downloading the geographic data (TIGER files) from the US Census site, the files were downloaded from the Esri web site. This is because Esri had already converted the original TIGER files into ArcView shapefiles, which is the file format used in most Pierce County GIS applications. It was also necessary to convert the shapefile into a coverage for use in ArcInfo. The data then needed to be projected from geographic coordinates of latitude and longitude into the State Plane Coordinate System, the Pierce County standard.
Once the data was in a useable file format and in the county's coordinate system, the census geography files then needed to be registered to Pierce County's tax parcel base. The tax parcel base is the map base used for creating most GIS data layers to ensure consistency in GIS data layers. Registering the census data to this base would enable people to do spatial analysis of the census data with other data layers. The registering of the census geography was done in ArcInfo using the Pierce County's special editing application, Pierce County Mapping System (PCMS). PCMS is used for creating and editing most data layers for Pierce County GIS
Registering the census geography required actually moving the census block lines to the map feature they represent. The census geography was moved using the Census Feature Class Code Description attributed to each census block line provided by the US Census Bureau and moving it to the corresponding county data theme. County data themes used included Tax Parcels, Street Centerlines, 1990 Census Blocks (previously registered to Pierce County's tax parcel base), School District Boundaries, Municipal Boundaries, Hydrology, and other landuse layers. All county themes used were tax parcel based with a horizontal positional accuracy of +/- 10 ft. This theoretically improved the horizontal positional accuracy of the census geography which was produced from USGS 1:100,000-scale topographic quads with a best possible horizontal positional accuracy of +/- 166.67 feet. The original hardcopy census maps were also used. These helped to find which street to move the census line to when the description for the line was street. They were also an error check when the description on the census line was mislabeled.
Once the census block lines were moved, the coverage was converted back to a shapefile giving us a theme of the lowest level of geography. This produced a coverage of the 11,956 census blocks in Pierce County. To create shapefiles of other levels of census geography such as block groups and tracts, a dissolve using the Census FIPS code was used.
Pierce County GIS spent considerable time and resources converting the census geography into the appropriate file format and map projection and registering the data to Pierce County's tax parcel base. The effort has given us a complete data layer of the census geography that is integrates fully with other Pierce County GIS data layers and Pierce County GIS mapping systems.

The tabular data was downloaded directly from the US Census FTP site. The main data set downloaded as of May 2002 was Census Summary File 1 (SF1). As new data sets become available, they will also be downloaded for use. The SF1 tabular data was put in a single Access database that can be readily used.
Summary File 1 included 36 different sections of various sizes. Each section was separately downloaded and imported into an Access database. All but two of the sections were tables whose fields represented data derived by the Census Bureau of responses from the short form of the Census 2000 questionnaire. The two remaining sections were tables needed to ensure efficient use of the data. One table was the geofile which was used to tie the tabular data to the geographic entity. Each section of SF1 file had to be joined to the geofile using the field logrecno. The other was a table of the field names used to tie the columns in the data tables to a meaningful description of the column. Data from the table can be exported for use in Excel or be joined to a shapefile.
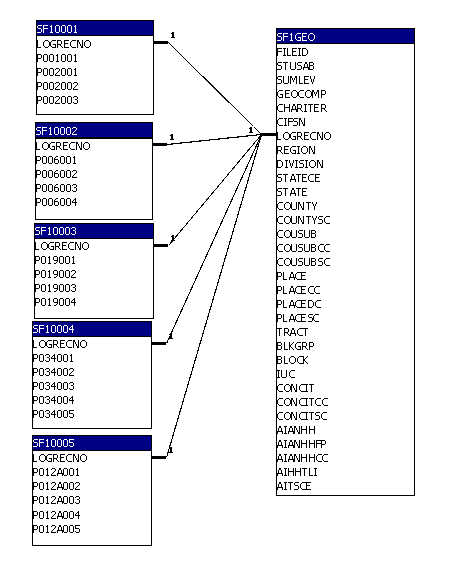
Summary File 1 came statewide, therefore, each section of SF1 needed to be condensed to only Pierce County. This was done by using FIPS County code corresponding to Pierce County (53) in the geofile. It was necessary to eliminate all but Pierce County to reduce the database to a useable size. With the reduced size of the database, queries can be performed faster.
Since it is necessary for many departments in Pierce County to have easy access to the census data, we needed to put the census data on existing Pierce County systems. The processing Pierce County GIS did of the geography files enabled the easy integration into Pierce County GIS systems. The downloading of the Summary File 1 into a single compressed Access database enabled the tabular data to be readily used by any county employee needing the data.
The census geography files with attached tabular information from Summary File 1 were put in Pierce County GIS's internal GIS system, CountyView. County employees utilizing GIS have access to CountyView. CountyView is a special ArcView project built for accessing all of the GIS data that Pierce County creates and obtains. The census data was added to the CountyView menu system with some tabular data joined to it. Themes added were; Census Blocks, Census Block Groups, and Census Tracts.
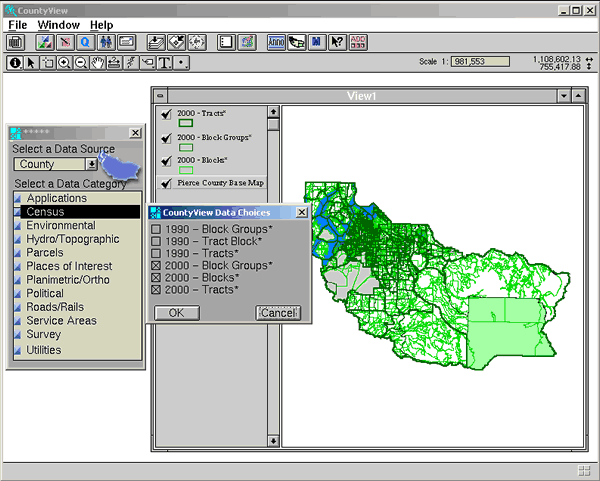
Due to the amount of tabular data available, not all data needed by county employees could be joined to the shapefiles. Since the county standard database program is MS Access, we needed an original downloaded database available for use. All County employees can now utilize the both the geographical and tabular Census 2000 data.
In fact, the census data has already been used as a necessary component in projects carried out by the different departments of Pierce County. The census shapefiles of blocks, blockgroup, and tracts with attached demographic data was used for the mandatory redistricting of the Congressional, Legislative, and Council District boundaries. The boundaries must be based on Census blocks; therefore, without the processing done by Pierce County GIS, the redistricting process would have been much more cumbersome. The census data has also been used for numerous other projects including aiding in the writing of grants, emergency and disaster mitigation planning, planning health services,and managing community resources just to name a few. With the data now in county standard formats, available in Pierce County GIS systems, and integrated with other county GIS data, the future uses are now unhindered.
As the Pierce County GIS Department received increasing numbers of census
related data requests, and held discussions with census data users, it became
clear that a web site containing census data relevant to Pierce County would
be a tremendous time-saver. The more we learned about users' project needs,
the more the web site's design expanded from simple tables to maps, table searches,
and interactive GIS-based data queries. The resulting web application, called CensusView 2000, helps people make sense
of the Census 2000 data as it pertains to Pierce County. The site features a
series of maps and charts that present census highlights on population, diversity,
age, gender, households, and families. More in-depth information can be generated
via data query tools. These database and GIS tools can be used to drill into
the data and create a variety of demographic reports for specific parts of the
county such as cities, common places, census tracts, or an area around an address.
http://triton.co.pierce.wa.us/CensusWeb/
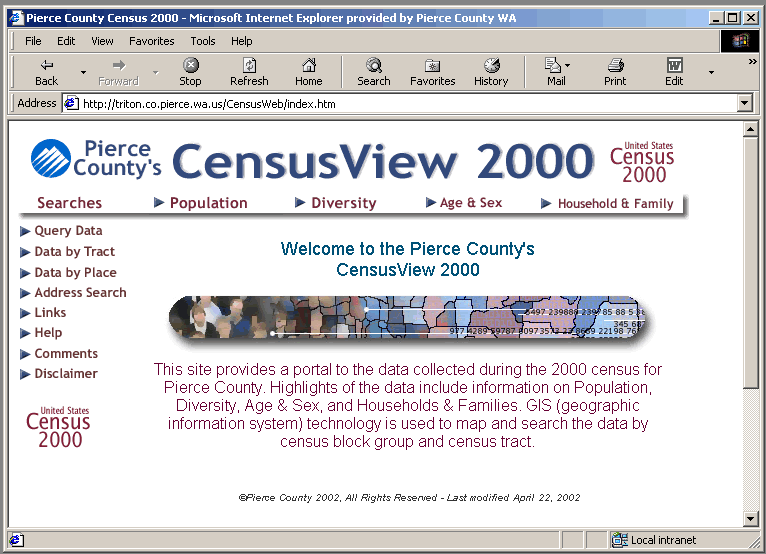
Pierce County's CensusView 2000 web site facilitates the use of demographic information by making census data easily understandable by providing specific maps and charts of commonly used demographic characteristics and avoiding misinterpretations of the data by providing downloadable tables for further analysis. The maps, charts and tables can be viewed via links under a given category at the top of the application. Demographic information was categorized under the following menu items: Population, Diversity, Age & Sex, and Household & Family.
![]()
Each category has a drop-down menu enabling the user to go directly to a page containing the maps, charts and tables of that type of demographic information along with a brief explanation of the Census data.
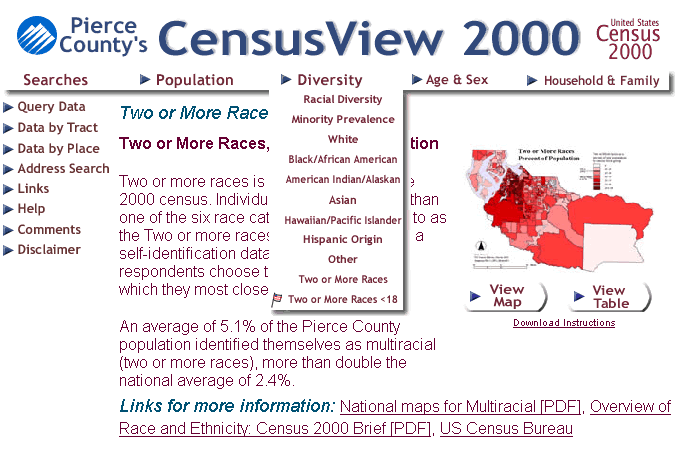
Geographic information systems technology was used to run analyses and create maps for each of the major demographic characteristics (population, diversity, age, gender, households, and families). These maps can be downloaded to a user's PC for printing or to use as the basis of research. In this way, even people who do not have mapping software can use census-based demographic maps in their work.
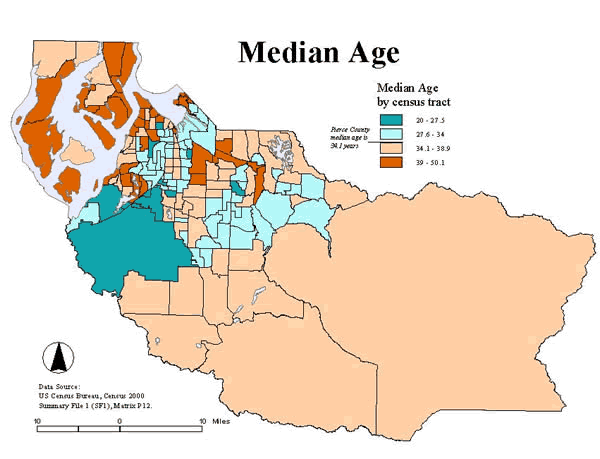
Along with being able to download maps, some demographic characteristics have a chart representing tabulations of certain demographics. The tables in Excel format were also created for people to download. The tables represent the numbers used to create the demographic maps.
The menu items listed under "Searches" can be used to run custom queries. The Query Data tool creates tables by census tract, or for the whole county, on a very wide variety of demographic topics. In the Data by Tract tool, a series of clickable maps are used to identify specific census tracts. Tables of census data for those tracts can then be created. The Data by Place tool is similar, but is based on cities, census designated places, and American Indian reservations rather than census tracts. Tables can be created by selecting a place via popup menus or by clicking on a map. The Address Search tool uses Map Objects, a more sophisticated GIS technology, to find census data around an address.
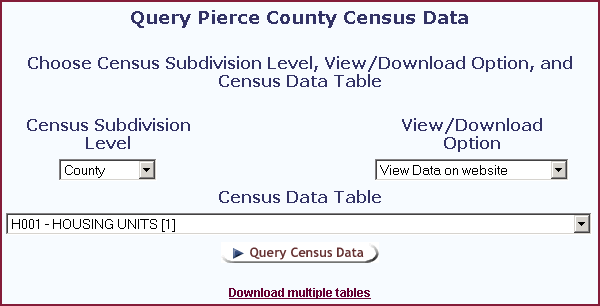
Query Data
The Query Data application enables you to query the data available in Summary File 1 for Pierce County. You can query this data at the county level or at a selected tract level. Results are either viewed on the web site or can be downloaded into an Excel 5.0 file, which is generated on-the-fly. A data table must then be selected. The tables include all 286 tables available in Summary File 1. Once the table is queried, the data for that table is generated.
The data was made available this way so that users could choose any table and tract combination they needed. There are 45,189 possible combinations of tables; given the number of census tracts, the number of tables, and the county summary (286 [tables] X 158 [census tracts] + 1 [county summary]). It would not be time efficient to create this many Excel tables for download, and this technique allowed the users the most flexibility.
The data is extracted from the condensed Access database file using Macromedia's Coldfusion 5.0. This allows users to easily create dynamic data extraction from the database without knowledge of SQL, so that they can focus on data analysis rather than data collection.
Data by Tract
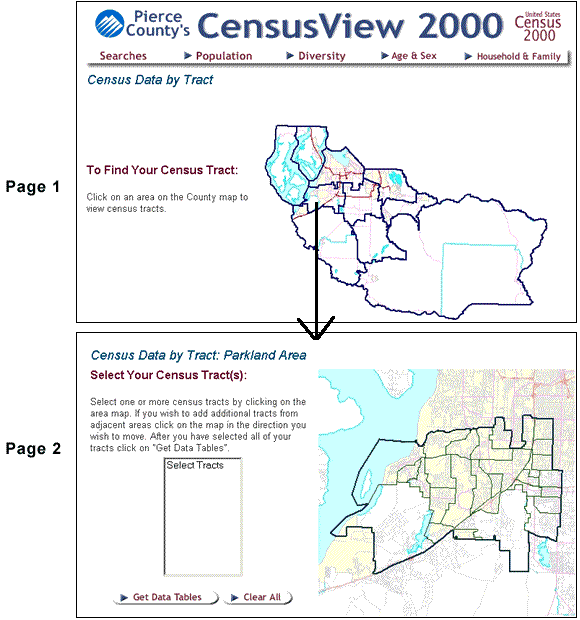
The Data by Tract application allows selection of specific census tracts for processing by the Query Data application. First an area of the County is selected on the County overview map, which sends the user to another more detailed map of that area showing census tract lines. From the more detailed map, a tract can be selected. This will take the user to the Query Data page with the specified tracts pre-selected in the form.
Finding "Data by Tract" was added to allow users who did not know their census tract to quickly find it using a easy to use "point and click" method. The user then selects single or multiple tracts and queries the database tables. The tables are summarized when the data is retrieved and can be viewed on screen or download as an Excel 5.0 file.
An Arcview extension downloaded from the Esri web site, Imagemap Tools v1.8 (written by Jim Schmidt), was used to create the imagine maps. Additional Coldfusion code was written to allow the Query Data application to do multiple queries and summarize the data.
Data by Place
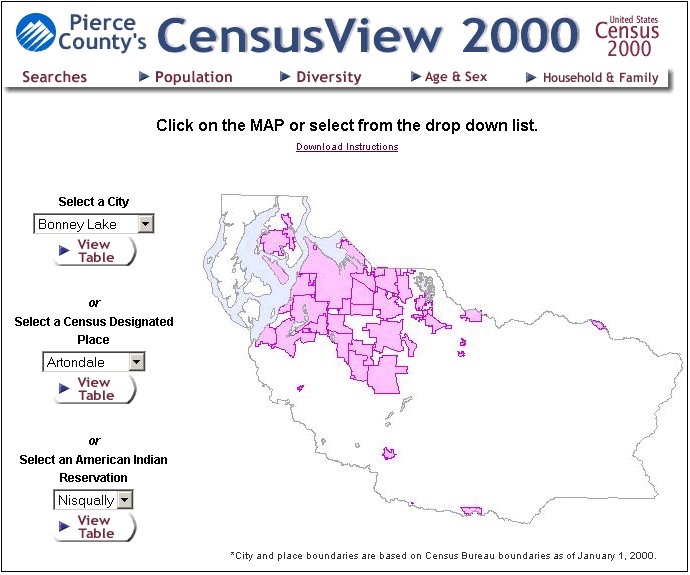
Data by Place is a page that provides links to data tables of cities, census designated place, and American Indian reservations in Pierce County. You can choose the place you want by selecting it from a drop down list or by clicking on the map of the cities and places. Selecting a place will automatically download an Excel table of demographic highlights from Summary File 1.
The Data by Place page uses two different types of input to give the user a choice of how to select the data to download. The first is a form that has three different types of select boxes; one for cities, one for census designated places, and one for American Indian reservations. Once the desired place has been selected, the user then needs to push the "View Table" button to download the table. The user can also select the place by clicking on the image map of the places in Pierce County because image maps are not able to account for two features occupying the same space. The image map was not able to feature the American Indian reservations because it overlaid some cities and census designated places. The Data by Place image map was created using the ImagineMap Tools v1.8 extension. Clicking directly on the place will download the table. The image map also uses the alt tag so each place's name will appear when the mouse rolls over it.
Address Search
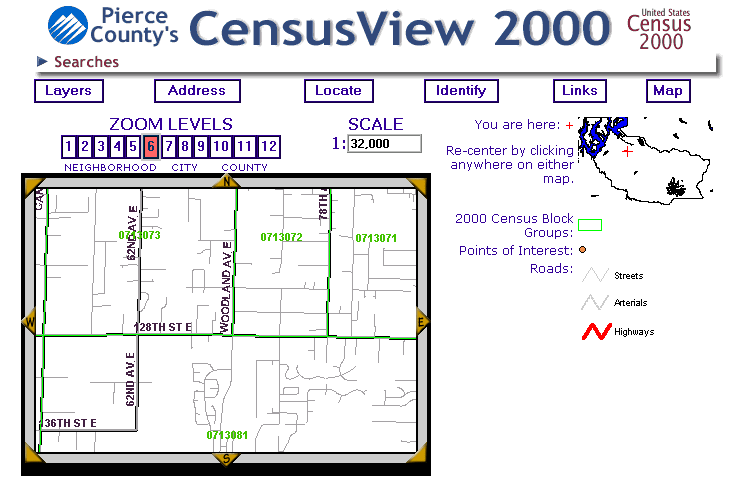
The Address Search is a Map Objects application searches for an address that is inputted by you to find out in which tract, block group, and block the site is located. Functions in this application include Identify, Locate, and Layers. With the Identify feature of the application, you can find out information about the block, block group, and tract of the current address. The Locate feature allows you to locate a specific tract, block group, or block. Layers function allows you to view different map features.
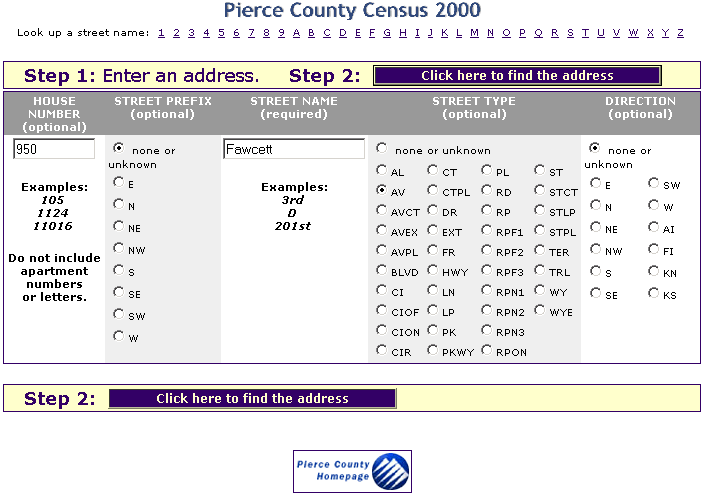
CensusView 2000 uses web-based interactive GIS technology to give users the ability to query census data around an address. A user can enter an address and the mapping system locates it in the county. Then the user can choose which data types to query, and give a radius around the address. The GIS system processes the request and returns the resulting data. Users can also customize the mapping interface by choosing the data layers and scale of the display.
An address is entered on a page designed to ensure proper address matching. Street prefixes (e.g., N, S, NE), types (e.g., AV, BLVD, CIR), and directions (e.g., N, S, SW) can all be chosen with radio buttons. There is also an index that can be used to look up street names. Address matches are listed on a results page, and each matching street segment has a Map button, which leads to the CensusView 2000 Internet mapping system.

The census geography files were create at a scale of 1:100,000 with the best possible horizontal positional accuracy of +/- 166.67'. Most of the County data is based on tax parcel data which is at a horizontal positional accuracy of +/- 10 feet. This means overlaying the Census geography file with County data and performing any spatial analyses were not possible. In order to solve this problem, we registered the census data to the tax parcel. The registration process was also problematic due to this difference in accuracy. Many times it was difficult to identify which geographic feature the Census block line was supposed to represent. The line descriptions and hard copy Census maps were used but did not always solve the problem due to the use of geography features such as ridge lines and ambiguous descriptions such as "Nonvisible boundary; major and minor categories unknown". To aid in finding some of the features the Pierce County orthophoto coverage and staff expert knowledge were used to determine the proper placement of the arc.
Importing and manipulating the Census Data took a fair amount of time. The data files downloaded from the Census Bureau are very large. The entire State of Washington needed to be downloaded (100mb zipped) and uncompressed. The size of the resulting Access database file was 2 gigabytes. The file was reduced in size by querying out all but Pierce County data, which helped in querying speed.
The changes in way the Census Bureau collected race data in 2000 caused some problems for some users. When designing the site user input was taken and inevitably the racial change was always discussed. Although there was nothing that could be done about the data already collected, frustration about the subject slowed down meetings at times and prompted special ones.
The design of the web site needed to fit certain constraints. The site needed to provide information to a wide audience, have easy navigation, incorporate different tools/applications, and have flexibility for adding future addition when SF2 is released. The original design had a major design change and then many minor ones. These changes are an inevitable part of web design that should be not be overlooked. The application links were placed on the left side of the site while the static pages were placed in a drop-down menu system underneath the header. This grouping allows for future expansion of the site's navigation tools without complete redesign of the site. Current users will be able to find the information they need in the location they are familiar with.
Query Data application, which allows users to query any of the Census data tables for any tract required some creative Coldfusion and SQL programming and a revision of the Access database. The data header table was an single table which included; table names, table subtitles, and field names. The solution was to extract the information into two tables for easier querying. Additionally, commas in the table subtitle needed to be replaced because they were causing problems in the comma delimited list being used in the SQL statements. Querying of multiple tracts introduced the problem of summarizing averages and medians. This problem was solved by create a check to not summarize on these tables.
The MapObjects component that was added to CensusView 2000 was built to be able to create mapping applications for specific projects. Such as a mapping application for a District Court office or a local city with data themes adressing their specific needs. Although, it is built in such a way that it could be plugged into other web applications some coding needed to be done. Specifically, the application needed to start from the geocoding interface, graphics needed to be inserted, and special links needed to be added.
The release of the much anticipated 2000 Census data precipitated a need to make the data readily available for agencies and individuals who use it for variety of projects. The data from the Census Department is large and complex, and difficult for most users to be immediately used. The solution that was arrived at was for the central GIS Department to distill and fix the data. The data themes are now registered to the common base used by other data themes. The Census data was trimmed down to an Access file so that queries could more easily be performed. Data was then joined to shapefiles and placed in the corporate system for use by all county GIS users. Although, geographic and tabular data was now easier to use for IT professionals experienced with ArcView and Access, there were still others that needed the data. Out of this need, the CensusView 2000 web site was developed. By using the web and even greater audience could be reached, both in and outside of County government and and maximizing the use of the Census 2000 data.
US Census Bureau, Department of Commerce, http://www.census.gov/
Esri, http://www.Esri.com/
Those involved in data production: Jared Erickson, David Grochowski, and Stan Gerber.
Those involved in web site development: Michael Payne, Paul Fly, and Dan King.
Angela Goodwin
GIS Technician, GIS Division, Information Services Department
Pierce County, Washington
Cort Daniel
Information Technology Specialist, GIS Division, Information Services Department
Pierce County, Washington