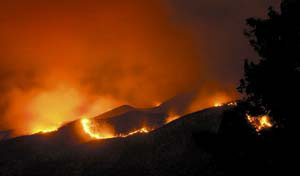
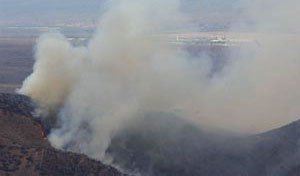
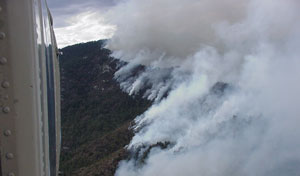
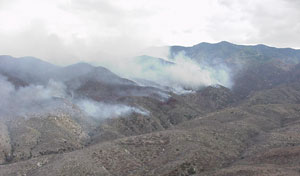
Figure 1: Bullock Fire, May 2002, Catalina Mountains, Arizona (U.S. FS Coronado National Forest, 2002 http://www.fs.fed.us/r3/coronado/bullock/).
Integrating Biophysical, Climate, and Human Factors in a Wildfire Model |
Wolfgang Grunberg, Barron J. Orr, Gary L. Christopherson, and Peter S. Johnson
The University of Arizona, Tucson, Arizona, USA
This paper discusses the development of a strategic wildfire model that integrates traditional biophysical modeling with climate, and human factors. The active nature of recent fire seasons in the southwestern United States have brought increased attention to the need for strategic planning. The components of the model will be integrated in ArcInfo and spatial data will be served via ArcIMS. This latter is particularly important because stakeholders in the region, including managers of public lands, farmers, ranchers, the business community, and property owners along the urban/wildland interface are particularly interested in the exchange of information.
Wildfire in the United States is both extensive and costly. Between 1994 and 2001, an average of 4.67 million acres have succumbed to wildfire, costing $610 million per year to suppress. Since 1960, the most extensive and costly wildfire year was 2000, when 8.42 million acres burned, requiring $1.36 billion and over 30,000 firefighters and support personnel to suppress (National Interagency Fire Center 2002) (Figure 1). The severity of these fires has increased in recent years, posing an increasing threat to human life and property, and to ecosystems more adapted to low severity fires. While immediate conditions—fuel availability and moisture, temperature, precipitation, relative humidity, wind—tend to drive both the number and extent of wildfires, climate factors and human activity are precursors to regional fire activity at a variety of temporal and spatial scales (Bessie and Johnson 1995; Baisan and Swetnam 1990; Takle et al. 1994). There is strong evidence that wildfires in the region are linked to climate teleconnections, notably the El Nińo-Southern Oscillation (ENSO) and the Pacific Decadal Oscillation (PDO) (Swetnam and Betancourt 1990; Simard et al. 1985: Grissino-Mayer and Swetnam 2000). In the longer term, changes in temperature and precipitation associated with global climate change may further alter wildfire and other disturbance regimes (Overpeck et al. 1990). Humans have a long history of using and controlling fire, and are now the primary ignition source, vector for propagation, and modifier of fuel sources (Pyne 1982; 2001). Factors such as human settlement and land use have been shown to be important correlates to fire patterns (e.g. Donoghue and Main 1985, Cardille et al. 2001), while intentional fire suppression has altered natural disturbance regimes and landscape structure (e.g. Baker 1992; Arno and Gruell 1986). Land management policies (suppression, threatened and endangered species, NEPA, etc.) can influence the risk of wildfire even as wildfire can affect the direction of land management policy (e.g. Barret 1994; Johnson et al. 1995).
Population expansion into previously open spaces has exacerbated the problem, particularly in the inter-mountain western United States. Beginning with the so-called “rural renaissance” of the 1970s, this region has evolved from one of low population densities engaged in primarily extractive economic activity (mining, farming, logging, ranching) into one of the most rapidly growing and dynamic regions in the United States (Beyers 1999; Booth 1999). Between 1969 and 1999 the region gained nearly 9 million people and more than 7 million jobs, doubling its population and tripling its employment (REIS 2002). The urban-wildland interface has expanded as well, presenting serious challenges to land managers in climatologically fire-prone environments where long-term fire suppression policies and urbanization have exacerbated the problem.
![]()
![]()
Figure 1: Bullock Fire, May 2002, Catalina Mountains, Arizona (U.S. FS Coronado
National Forest, 2002 http://www.fs.fed.us/r3/coronado/bullock/).
The ability to integrate climate and human influences on wildland fire regimes in order to quantify the fire sensitivity (the probability/risk of fire) and the vulnerability to fire impacts at various spatio-temporal scales is necessary to effectively meet these land management challenges. Geospatial technology, including remote sensing and Geographic Information Systems (GIS), provides the information and the tools necessary to integrate disparate data sources across time and space at varying scales. Internet map server technology such as Esri ArcIMS (2002) and other web visualization tools afford the opportunity to provide value-added products useful to wildland fire stakeholders through a web-based interface. An EPA STAR Grant funded initiative called “Wildfire Alternatives” (WALTER) has set out to maximize advances in geospatial analytical, as well as web delivery technology, to improve our understanding of and provide access to applied research on the relationship between wildfire, climate, and society (Grant #R-82873201-0; Morehouse et al. 2000).
The WALTER project involves research, model development, database and web programming, and educational website design. While all elements are taking place simultaneously, some have progressed further than others. Our objective is to publish research results as they are obtained, and launch web-based applications as they are developed.
The WALTER team is interdisciplinary, drawing expertise from investigators specializing in (a) the involvement of stakeholders throughout a research and development process, (b) geospatial research on wildfire behavior, (c) extracting of relevant variables from remote sensing data, (d) discerning relationships between climate and fire, (e) the role of fire history and climate as well as fire sensitivity (risk/probability of fire occurrence), (f) the influence of human activities, policy and human values on wildfire, and (g) the delivery of relevant information - including spatial data - to end users with a range of backgrounds to support planning and education.
Four study areas were chosen for the project: the Catalina-Rincon Mountains, the Huachuca Mountains, and the Chiricahua Mountains in Arizona, and the Jemez Mountains in New Mexico (Figure 2). These were selected because each has specific human-wildland interface challenges, one or more of the investigators have already accumulated crucial data and knowledge on these areas (e.g. Swetnam, Allen, and Betancourt 1999; Yool 1998), and each offers particular opportunities for integrating local fire experts and community members into the process of developing and implementing the model (Morehouse et al. 2001). We provide a detailed description of each venue and the reason for its inclusion in the project in Appendix A.
![]()
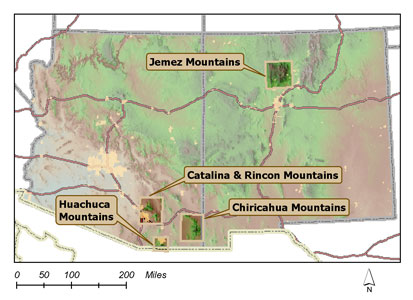
Figure 2: Study Areas in Arizona and New Mexico.
Wildfire and climate managers, as well as researchers, acknowledge the power of mechanistic spatial models for tactical management, but have expressed a need for planning tools that would integrate the climate and human dimensions of wildfire behavior for strategic management (Garfin and Morehouse 2001). In response to this demand, the WALTER team is developing an integrated model called Fire-Climate-Society (FCS-version 1) as well as a series of web-based visualization and educational tools to facilitate distributed access to and dissemination of information.
The framework for FCS-1 draws from wide range of temporal and spatial data, including biophysical and socioeconomic factors that will, as the model is developed, interact to produce maps of fire sensitivity (risk/probability of fire) and fire vulnerability (effects/consequences of fire) (Figure 3). Ultimately the strategic model will address two needs: strategic planning (using scenarios based on historic data to look at the past in order to plan for the future), and strategic management (using current climate analogs to generate longer-term “what if” scenarios). The emphasis of the model will be on identifying areas with the highest probability of wildfire, and will be designed to enhance rather than replace local expertise.
FCS-1 will be strategic fire sensitivity (risk/probability of fire) and fire vulnerability (effects/consequences of fire) model that builds from, but does not attempt to duplicate advances in tactical fire modeling. Over the past decade, natural resource and fire managers have increasingly employed GIS as a tactical management tool to consider fire at landscape levels. Models developed to simulate how fuels, weather, and topography affect fire behavior in a specific location (e.g. Rothermel 1972; BEHAVE, Burgan and Rothermel 1984; Andrews 1986) have evolved into spatial process simulations across landscapes (e.g. FARSITE, Finney 1998; FIRE!, Green et al. 1999; Sampson et al. 2000). These predictive models and advances in associated software have given fire managers powerful tools for on-site tactical management of wildfire as well as insight into the ramifications of proposed prescribed burns under specific conditions.
![]()
Figure 3. Conceptual framework for the Fire-Climate-Society (FCS-1) model.
While the long-term goal of WALTER is to provide a model in support of strategic wildfire planning, it is important to emphasize two constraints the project team is currently trying to address. First, there are fundamental science questions that must be answered before current climate data can be used to inform a projected set of future conditions. Second, despite a relatively coarse spatial resolution of 1 km, it is important to note that there is a tactical element in strategic planning due to the need to generate current conditions-based climate surfaces (e.g. interpolated precipitation map), and climate-influenced surfaces (e.g. fuel moisture map) across management areas as large as an entire forest or mountain range. WALTER researchers are actively attempting to address the first constraint, and have found a way to automate the processing and web visualization of the second constraint with one critical data type: the AVHRR (Advanced Very High Resolution Radiometer) Normalized Difference Vegetation Index data as delivered on the RangeView website http://rangeview.arizona.edu (White et al. 2002). Unfortunately, spatially distributed climate data, while available for dates in the past, are not currently generated and served in a near-real time, automated fashion that can be channeled into the web development tools described later in this paper. The WALTER team hopes to make progress in addressing this issue, perhaps through partnership with National Center for Atmospheric Research (NCAR) scientists who are generating 1 km climate surfaces that are collectively called DAYMET data (Thornton 2002; Thornton et al. 1997).
The WALTER team assessed the wide variety of modeling methods now available to create wildfire sensitivity (risk/probability of fire) maps on the basis of performance and practicality (Farris et al. 1999). In order to integrate climate and human dimensions into a strategic planning model it was essential to find an approach that did not require high spatial resolution mapping of fire determinants. One solution is an indexing method that uses fire itself to help predict locations that are likely to burn in the future. The approach Neuenschwander et al. (2000) used to index watersheds to risk of wildfire is based on the assumption that “the probability of future ignitions can be represented by the frequency distribution of the past decade…” (Neuenschwander et al. 2000, p. 39). To cover larger areas, measurements taken from satellite imagery are commonly used to inform fire potential assessments as part of the fire danger rating system used in the United States (Burgan et al. 1998). Medlar (1999) used remote sensing to map the internal burn patterns of wildfire and fire records in the San Mateo Mountains of New Mexico, which were then applied to similar terrain in the Chiricahua Mountains of Arizona to map fire risk there. The FCS-1 wildfire sensitivity (risk/probability of fire) modeling approach is based on the combination of these concepts (Figure 4).
![]()
Figure 4:
FCS-1 - Fire Sensitivity Mapping (Michael A. Crimmins and Stephen R. Yool, Department
of Geography and Regional Development, University of Arizona, 2002). DVT = Dominant
Vegetation type; IG = ignitions; PDSI = Palmer Drought Severity Index; ENSO
= El Nińo-Southern Oscillation; PDO = Pacific Decadal Oscillation
Climate and climate change are becoming increasingly important avenues for exploration of the physical world, including studies of wildfire. This particular study grew out of a yearly fire and climate conference sponsored by The Institute for the Study of Planet Earth (ISPE) and Climate Assessment of the Southwest (CLIMAS) at the University of Arizona.
Traditionally, fire models have concentrated on tactical approaches, utilizing weather information to help fight fires. Climate forecasts, with their longer view, lend themselves to the strategic nature of FCS-1. Matching historic climate data with size, intensity, extent, and other characteristics of historic fires will allow an assessment of the relationship between climate and fire. This will provide fine-scale information necessary to assess the relative contribution of climate variability and change for strategic planning based on climate forecasts.
The fire history component of FCS-1 is designed to answer two basic questions: (1) Based on historical information, what are the spatial and temporal patterns of human-caused ignitions and naturally caused fire ignitions? (2) What factors influence these patterns? GIS-based modeling of fire history data provides an essential bridge that allows a combination of human dimensions and natural science components in the integrated model. Such spatial database development and mapping facilitates analysis of the relative contribution of humans and natural events to fire regimes in different ecosystems, and allows analysis at different time and spatial scales.
Generating GIS map layers, based on fire history data, will
allow investigation of the linkages between climate variability and lightning
activity in fire regimes and outcomes for ecosystems in the Southwest. Climate
and fire history data, including lightning strikes, will be mapped at fine spatial
scales for the past 20 years using existing tree-ring reconstructions of fire
history. These reconstructions span the past 400 years, providing valuable contextual
information about fire patterns and relative contributions of human and natural
influences at longer time scales.
To address the influence of humans on wildfire sensitivity as well as the impact of actual burns, the WALTER team is working to incorporate variables to address human activity, policy ramifications, and human values into the FCS-1 model. Human activities have undeniable impacts on the location and intensity of wildfires. These human impacts can be divided into three areas: institutional and social policies, human-environment interaction, and human values placed on landscape and land use.
To address the influence of humans on wildfire sensitivity as well as the impact of actual burns, the WALTER team is incorporating variables to address human activity, policy ramifications, and human values into the FCS-1 model. Datasets identified include population density, land tenure, land use patterns, planning and zoning information, and property values, to road networks, resource uses (e.g., recreation, mining, grazing), and available fire fighting resources. We also include relevant statutes and policies (e.g., Endangered Species Act, National Fire Plan, state-level permit policies for carrying out prescribed burns) that facilitate or constrain certain management alternatives. This involves an effort to spatially depict the influence of policies as well as well as human values associated with vistas, institutions, and property.
Building a good decision support model for strategic planning for wildfire management requires a fundamental understanding of institutional factors that may facilitate or impede use of the model. It also requires knowledge about how decisions are made, what issues are of most concern to potential users of the model, and what levels of expertise exist with regard to using relatively complex GIS systems. This study includes structured interactions with managers and the public in the four study areas to answer these questions. In addition, a review of laws, policies, reports on previous fires, and other such sources will be conducted to understand how these factors influence current decision-making processes and to predict how institutions may influence use of FCS-1 and the fire simulations that the model produces. The survey and literature reviews will also provide insights needed to design workshop and training sessions to be carried out in tandem with the introduction of the model to decision makers and community members in the four study sites.
Delineating relations between humans and the environment is an essential component of FCS-1. GIS layers are being built that depict the evolution over the past twenty years of land tenure and land use patterns, roads, trails, campsites, water tanks, power lines, and other important spatial variables within the study areas. Once the database has been developed, fire start locations can be correlated with these human parameters, such as the relationship between road density and wildfires caused by humans in a particular area. Combining a variety of these types of analysis, a probability surface for human caused wildfires could be constructed (Pew and Larsen 2001) and in turn integrated with the other components of FCS-1.
The final consideration for the human dimension component is the value humans place on landscape and land use. Difficult to quantify or even to understand, there are many personal and social considerations that work together to form our opinions of landscape and land use. Furthermore, these values vary from area to area, and from person to person. One person may be interested strictly in extractive economic value, while another may be most interested in view, or even spiritual considerations. For example, in their article on ecosystem valuations, Costanza et al. (1997) assign a dollar amount of zero to desert landscapes, very different from the value assigned by those who actually live in such environments.
These values, no matter how they are assigned, have important consequences for wildlands. Assigning values to landscape, FCS-1 will allow managers to determine in advance those areas that require the most intensive efforts at fuel reduction, fire remediation, etc., allowing them to concentrate resources in those areas. The model will use a variety of data to assign monetary and non-monetary values that reflect the importance of land use and landscape to both public and scientific communities.
In order to make WALTER basic research and model development useful to stakeholders we have invested in the transition from validation to application. Our method for delivering research results, operational tools, and educational materials is through a web service designed specifically to be relevant to a variety of user constituencies who want to learn more about the relationship of climate and human dimension to wildfire in the southwest.
The sustainability of a web service like that proposed for WALTER depends on the commitment, both now and into the future, of stakeholders and researchers. The communication lines are an institutional part of the WALTER project. On the one hand, WALTER investigators assess the needs of stakeholders like fire managers, public land managers, and climate researchers at regular intervals. On the other hand, intermediate research results and conceptual web applications are shared with these stakeholders so that their comments can be used to inform, and where possible, appropriately modify the research and development process. This includes verification of web content, web applications and visualization tools. This two-way knowledge exchange facilitates the transition from validated research to the creation of relevant, operational applications requested by the stakeholders. It equally serves to keep those stakeholders comprised of current research on climate and human influences on wildfire.
As the FCS-1 model is finalized and data are made available, the programming effort will produce a scenario generator that will permit the user to model the influence of varying climate conditions and preferences among policy options and changes in human values. For example, different seasonal climate analogs (e.g. a wet winter that increases biomass followed by a dry spring results in higher potential for fire) have different impacts on the sensitivity of the landscape to wildfire (Grissino-Mayer and Swetnam 2000). Humans can influence the wildfire regime through a process (e.g. population growth and associated development patterns) or through a policy decision (e.g. limited forest thinning to maintain a vista or an endangered species).
In preparation for the FCS-1 model, it was necessary to address the problem of viewing variation over space and time using the same set of tools. Development efforts have resulted in the creation of database-driven ArcIMS tools that bring change into an interactive interface that combines the capability of an animation tool to capture temporal dynamics with the power of ArcIMS to evaluate spatial variability across a landscape or between specific locations (Figure 5). Users will have the ability to set environmental variables, select overlay themes to enhance geographic recognition, and then render a time-series animation over a user-determined time frame. The user will have the freedom to change the spatial and temporal extent of the animation window, permitting the ability to move through time and space simultaneously. Specific time series data to be animated includes weekly NDVI greenness imagery, daily-interpolated precipitation surfaces, and vector data such as fire history polygons. The database design incorporates frequent updates and customization (Figure 6).
![]()
Figure 5: Dynamic
Animation Tool Application Model (Ann-Maree White and Wolfgang Grunberg, Arizona
Remote Sensing Center, 2002).
![]()
Figure 6: Dynamic Animation Database Diagram - The database facilitates flexibility
and ease of updating (Ann-Maree White, Arizona Remote Sensing Center, University
of Arizona, 2002).
The Dynamic Animation Tool uses ArcIMS 3.1 with its Active-X connector (ASP object library) to render the individual time series frames that are then animated in a thin, JavaScript based web client. The interface to the animation tool is split into three pages. The first page (Figure 7) lets the user set and preview the map extent, animation time frame, data type to be animated and optional reference layers and labels. All user-defined options on this page are governed by a database (Figure 6). The database integration into the animation application enables greater flexibility in updating current data and adding new data. The rendering of the animation frames takes place on the second page (Figure 8), which also displays the rendering progress to the user. The final page (Figure 9) is the actual animation page with the JavaScript animation controls.
![]()
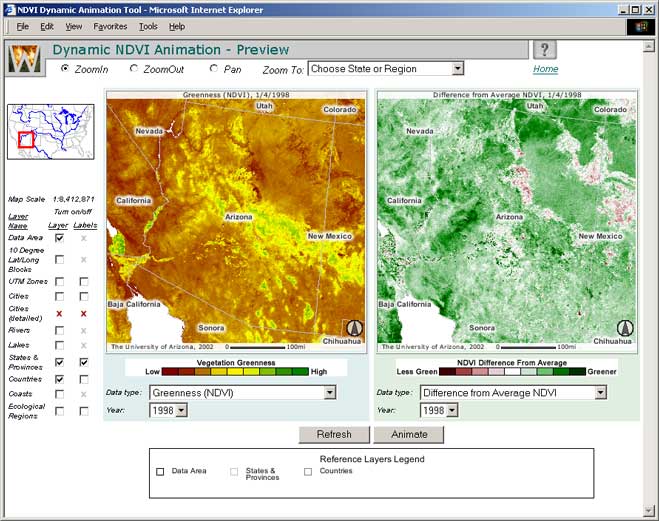
Figure 7: Dynamic
Animation Tool - The preview page lets the user select the spatial extent, temporal
extent, and the reference layers for the custom animation.
![]()
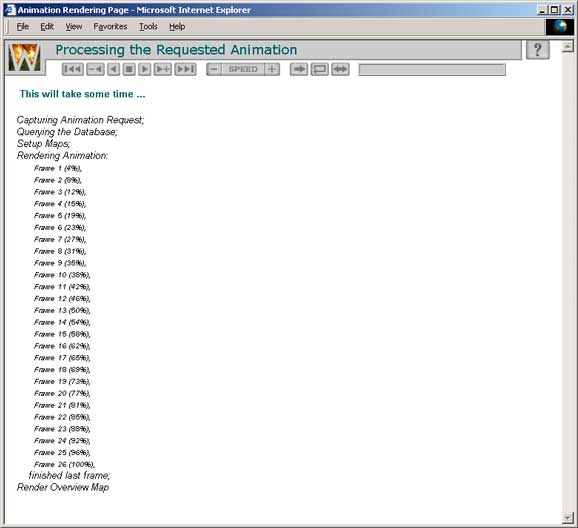
Figure 8: Dynamic
Animation Tool - The rendering page informs the user of the custom animation
rendering process.
![]()
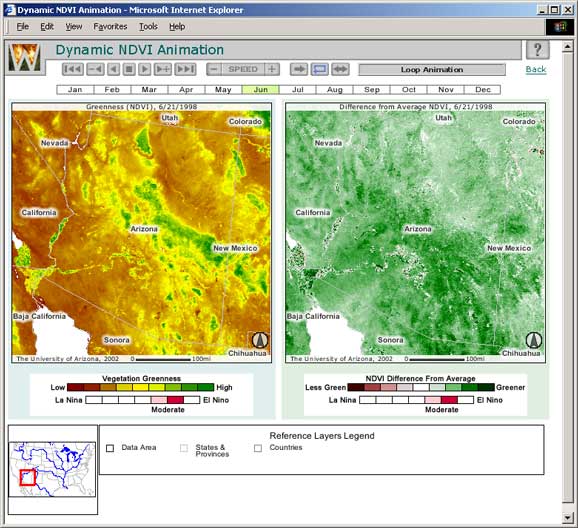
Figure 9: Dynamic
Animation Tool - The animation page gives the user complete control of animation
speed and direction as well as provides information on climatic conditions through
the ENSO-Meter.
Initial web content development has concentrated on describing the WALTER project, its objectives, and its research and development teams, while also collecting and compiling background information on the four project venues. The information on the venues includes fire history, land use, population, and economic trends. The project information section will include publications and presentations, and a “who’s who” about the project groups and individuals. In addition, users will be able to query indices such as a glossary of terms and links to related sites are being developed.
Decisions on web content and design are based on a web information architecture best described as fitting a “peel the onion” analogy. In this analogy, the outer layer is accessible to all potential website visitors, regardless of their level of expertise in the subject matter, and inner layers become more tailored for specific types of users. In order to improve the utility and efficiency of the website for particular types of users (educators, students, fire managers, climate and fire researchers, etc.), navigation cues will be integrated throughout the website to guide the user to whatever layer of depth needed. To facilitate this process while maintaining user choice, irrespective of background, we are testing a hyperlink development analogous to the “break out box” found in most textbooks. A series of easily recognized icons based on characters representing specific user-group interests is being developed to help users identify and move seamlessly to targeted explanatory or educational content tailored to their more specific needs.
Parallel model development and web applications development made it difficult to schedule development tasks until the model became mature enough to visualize on the web. The model developers had difficulties perceiving what kind of web applications were possible and the applications developer had difficulties conceiving what applications were needed to deliver FCS-1 on the Web. This was resolved by presenting the research teams with a variety of visualization tools to generate dialogue, and involving the development team in the science meetings. Some of the challenges all teams encountered in the development of FCS-1 were: (1) research constraints that limit the operational execution of the model, (2) difficulties in finding relevant data such as the growth of road networks over time, (3) normalization of data with varying spatial and temporal scales and resolutions, and (4) lack of adequate metadata.
The Wildfire Alternatives initiative seeks to develop and deliver a strategic wildfire model and associated educational tools to improve forest/grassland ecosystem health and sustainability through better understanding of the consequences of interactions between human factors, climate, biophysical processes, and fire in the Southwest. WALTER involves scientific research across disciplinary lines that engages stakeholders in an iterative process in order that validated research can be converted into operational, web-based tools to support strategic wildfire planning and management. Critical to this process is the need expressed by stakeholders to visualize time series data where the user can select the time frame and the location at will. The Dynamic Animation Tool, through ArcIMS technology, brings the user this functionality. For more information and a chance to test the prototype of this tool, please visit WALTER at http://walter.arizona.edu.
The vision behind the WALTER project and the decision to integrate climate and human dimensions with wildfire modeling was initially proposed by Barbara Morehouse of the Institute of the Study of Planet Earth at the University of Arizona.
We thank the WALTER team at the University of Arizona for their efforts with the WALTER project: Chris Baisan, Gary Christopherson, Andrew Comrie, Michael Crimmins, Calvin Farris, Wolfgang Grunberg, Pamela Holt, Peter Johnson, Shoshona Mayden, Jay Miller, Barbara Morehouse, Barron Orr, Jonathan Overpeck, Merick Richmond, Heather Severson, Thomas Swetnam, Anne Thwaits, W. Ed Wright, and Steve Yool
We specifically would like to thank Steve Yool, Michael Crimmins, Barbara Morehouse, Heather Severson, Anne Thwaits, and Ann-Maree White, and Chuck Hutchinson who provided critical content and carefully reviewed this paper.
Andrews, P.L. 1986. BEHAVE: Fire behavior prediction and fuel modeling system – BURN subsystem, Part 1. USDA Forest Service General Technical Report INT-194.
Arno, S.F. and G.E. Gruell. 1986. Douglas-fir encroachment into mountain grasslands in southwestern Montana. Journal of Range Management 39:272-276.
Baisan, C. H. and T. W. Swetnam. 1990. Fire history on a desert mountain range: Rincon Mountain Wilderness, Arizona, USA. Canadian Journal of Forest Research 20:1559-1569.
Baker, W.L. 1992. Effects of settlement and fire suppression on landscape structure. Ecology 73(5):1879-1887.
Barret, S.W. 1994. Fire regimes on andesitic mountain terrain in Northeastern Yellowstone National Park, Wyoming. International Journal of Wildlife Fire 4(2):65-76.
Bessie, W. E. and E. A. Johnson. 1995. The relative importance of fuels and weather on fire behavior in subalpine forests. Ecology 76:747-762.
Beyers, W. 1999. Employment growth in the rural West from 1985 to 1995 outpaced the nation. Rural Development Perspectives14: 38-43.
Booth, D. 1999. Spatial patterns in the economic development of the Mountain West. Growth and Change 30: 385-405.
Burgan, R.E. and R.C. Rothermel. 1984. BEHAVE: Fire behavior prediction and fuel modeling system – FUEL subsystem. USDA Forest Service General Technical Report INT-167.
Burgan, R.E., R.W. Klaver, and J.M. Klaver. Fuel models and fire potential from satellite and surface observations. International Journal of Wildland Fire 8(3):159-170.
Cardille, J.A., S.J. Venture, and M.G. Turner. 2001. Environmental and social factors influencing wildfires in the Upper Midwest, United States. Ecological Applications 11:111-127.
Coronado National Forest. 2002. http://www.fs.fed.us/r3/coronado/fire/fire.html. Accessed 2002 May 20.
Costanza R., d’Arge R., R. de Groot, S. Farber, M. Grasso, B. Hannon, K. Limburg, S. Naeem, R.V. O’Neill, J. Paruelo, R.G. Raskin, P. Sutton, and M. van den Belt. 1997. The value of the world’s ecosystem services and natural capital. Nature 387:253-260.
Donoghue, L.R. and W.A. Main. 1985. Some factors influencing wildfire occurrence and measurement of fire prevention effectiveness. Journal of Environmental Management 20:87-96.
Farris, C.A., C. Pezeshki, and L.F. Neuenschwander. 1999. A comparison of fire probability maps derived from GIS modeling and direct simulation techniques. Proceedings from the Joint Fire Science Conference and Workshop “Crossing the Millennium: Integrating Spatial Technologies and Ecological Principles for a New Age in Fire Management” Vol. I. June 15-17, 1999, Boise, Idaho. University of Idaho and the International Association of Wildland Fire, pp. 131-138.
Finney, M.A. 1998. FARSITE: Fire Area Simulator - model development and evaluation. RMRS-RP-R. USDA Forest Service, Rocky Mountain Research Station, Ogden UT.
Garfin, G. and B. Morehouse. 2001. 2001 Fire and Climate Workshop Proceedings, February 14-16 and March 28, 2001. Tucson, Arizona: CLIMAS-ISPE, University of Arizona.
Green K., M. Finney, J. Campbell, D. Weinstein, and V. Landrum. 1995. Using GIS to predict fire behavior. Journal of Forestry 93(5):21-25.
Grissino-Mayer, H.D., and T.W. Swetnam. 2000. Century-scale climate forcing of fire regimes in the American Southwest. The Holocene 10:213-220.
Halvorson, W.L., K. Thomas, L. Graham, M.R. Kunzmann, P.S. Bennett, C. van Riper, C. Drost. 2001. The Arizona GAP Analysis Project: Final Report. Tucson, Arizona: U.S. Geological Survey Sonoran Desert Field Station.
Johnson, E.A., K. Miyanishi, and J.M.H. Weir. 1995. Old-growth, disturbance, and ecosystem management. Canadian Journal of Botany 73:918-926.
MacDonald, D. 2001. No lives lost, the Cerro Grande fire. In: Renee Sansom Flood (ed.) Under Fire: The West is Burning. Fenske Company, Billings, Montana. pp. 37-52.
Medler, M.J. 1999. Modeling fire hazards with remotely sensed data from recent fires. Proceedings from the Joint Fire Science Conference and Workshop “Crossing the Millennium: Integrating Spatial Technologies and Ecological Principles for a New Age in Fire Management” Vol. II. June 15-17, 1999, Boise, Idaho. University of Idaho and the International Association of Wildland Fire, pp. 49-57.
Morehouse, B.J., G. Christopherson, C.A. Farris, B.J. Orr, J.T. Overpeck, T.W. Swetnam, and S.R. Yool. 2001. An Integrated GIS Tool for Wildfire Management in the Southwestern United States. Fourth Symposium on Fire and Forest Meteorology.12-15 November 2001, Boise, Idaho.
Morehouse, B.J., T.W. Swetnam, J.T. Overpeck, S.R. Yool, G.L. Christopherson, and B.J. Orr. 2000. Assessing the consequences of interactions between human activities and a changing climate. Proposal submitted to the Environmental Protection Agency, 2000-STAR-F1, April 25, 2000.
National Interagency Fire Center. 2002. Wildland Fire Statistics. Online: http://www.nifc.gov/stats/wildlandfirestats.html. National Interagency Fire Center, Boise, Idaho. Accessed May 2002.
Neuenschwander, L.F., J.P. Menakis, M.Miller, R.N. Sampson, C. Hardy, B. Aveerill, and R. Mask. 2000. Indexing Colorado watersheds to risk of wildfire. In: Sampson, R.N., R.D. Atkinson, and J.W. Lewis. (eds). Mapping Wildfire Hazards and Risks. Co-published simultaneously as Journal of Sustainable Forestry 11:(1/2). New York: Food Products Press pp. 35-56.
Overpeck, J.T., D. Rind, and R. Goldberg. 1990. Climate-induced changes in forest disturbance and vegetation. Nature 343:51-53.
Pew, K.L. and C.P.S. Larsen. 2001. GIS analysis of spatial and temporal patterns of human-caused wildfires in the temperate rain forest of Vancouver Island, Canada. Forest Ecology and Management 140:1-18.
Pyne, S.J. 1982. Fire in America, a Cultural History of Wildland and Rural Fire. Princeton University Press, 654 pp.
Pyne, S.J. 2001. Fire: A Brief History. Cycle of Fire Series. Seattle: University of Washington Press, 204 pp.
REIS. Selected years. Regional Economic Information System. Online: http://fisher.lib.virginia.edu/reis/. University of Virginia’s Geospatial and Statistical Data Center. Accessed May 2002.
Rothermel, R.C. 1972. A mathematical model for predicting fire spread in wildland fuels. Ogden, UT: USDA Forest Service, Intermountain Forest and Range Experiment Station, Research Paper INT-115.
Sampson, R.N., R.D. Atkinson, and J.W. Lewis (eds). 2000. Mapping Wildfire Hazards and Risks. Co-published simultaneously as Journal of Sustainable Forestry 11:(1/2). New York: Food Products Press pp. 343.
Simard, A.J., D.A. Haines, and W.A. Main. 1985. Relations between El Nińo Southern Oscillation anomalies and wildland fire activity in the United States. Agricultural and Forest Meteorology 36:93-104.
Southwest Area Wildland Fire Operations. 2002. Fire Information http://www.fs.fed.us/r3/fire/. Accessed 2002 May 15.
Swetnam, T.W., and J.L. Betancourt. 1990. Fire-southern oscillation relations in the southwestern United States. Science 249:1017-1020.
Takle E.S., D.J. Bramer, W.E. Heilman, and M.R. Thompson. 1994. A synoptic climatology for forest fires in the NE US and future implications from GCM simulations. International Journal of Wildland Fire 4:217-224.
Thornton, P.E. 2002. Spatial Bioclimatology: DAYMET. Online: http://www.forestry.umt.edu/ntsg/bioclimatology/daymet/. National Center for Atmospheric Research (NCAR) at the University of Montana; http://www.atd.ucar.edu/. NCAR Atmospheric Technology Division in Boulder, CO. Accessed June 2002
Thornton, P.E., S.W. Running, and M.A. White. 1997. Generating surfaces of daily meteorological variables over large regions of complex terrain. Journal of Hydrology. 190:214-251.
U.S. Census Bureau, 2000 City and County Data Book. http://www.census.gov/prod/2002pubs/00ccdb/cc00_tabD1.pdf. Accessed 2002 May 15.
White, A-M., A. Thwaits, S. Marsh, B. Orr, G. Oldham, K.
Mauz, and C. Wallace. 2001.
RangeView: Geospatial Tools for Natural Resource Management. Online: http://rangeview.arizona.edu/.
University of Arizona, Tucson Arizona. Accessed April 2002.
Yool, S.R. 1998. Land cover classification in rugged areas using moderate-resolution multi-spectral data and an artificial neural network. International Journal of Remote Sensing 19(1): 85-96.
The model will be applied to the Chiricahua, the Santa Catalina-Rincon, and the Huachuca districts of the Coronado National Forest in southeastern Arizona, and to the Jemez Mountains in the Santa Fe National Forest of north-central New Mexico. These are areas of elevated wildfire hazard, and encompass a wide range of urban-wildland interface types. The venues include a large metropolitan area (Catalinas), a small urban center that is growing rapidly (Huachucas), a relatively rural location (Chiricahuas), and an area of national importance (the Jemez Mountains include the home of Los Alamos National Laboratory). These locations were also the site of previous research activities that have produced considerable information relevant to this project. These locations will serve as an extensive test of the model to ensure its adaptability in uses for other locations where fire in the urban-wildland interface constitutes an important factor in ecosystem sustainability.
The fire season in the Coronado National Forest typically runs from April through November. The entire Coronado National Forest averages 150 fire occurrences a year, burning a total of 9,000 acres. Sixty-nine percent of the total fires each year are lightning caused, averaging 74% of the total acreage burned (Coronado National Forest 2002). As of May 2002, there had already been 63 wildfires in the Coronado National Forest burning 43,582 acres. Of this total, 94% are human-started, burning 99% of the total acreage (Southwest Area Wildland Fire Operations 2002). These numbers are especially troublesome because the Coronado National Forest is situated next to rapidly expanding urban areas (Tucson and Sierra Vista). Approximately 34,000 acres of the Forest are in urban interface areas, and in the Tucson area alone there are nearly 60 miles of interface (Coronado National Forest 2002).
The Santa Catalina-Rincon complex is located to the north and east of the Tucson, Arizona metropolitan area (Figure 10). It ranges in elevation from 670 meters on the valley floor to 2,789 meters at the top of Mount Lemmon in the Catalinas. Vegetation in the complex varies from Sonoran-Paloverde-Mixed Cacti at the lower elevations through semi-desert mixed grasses and chaparral, up to Ponderosa Pine and Douglas Fir forests at the higher elevations. Land ownership of the area is principally divided between State Trust land (37.1%), Private land (33.2%) and USDA Forest Service land (22%).
The Santa Catalina-Rincon Mountains were included in this study because of the interface between wildlands and a large urban area. Major population centers surrounding the forest include Tucson (population 486,699), Oro Valley (population 29,700), Oracle (population 3,563), and San Manuel (population 4,375). There are an additional 300,000 people living in unincorporated regions adjacent to forested lands (U.S. Census Bureau 2002).
![]()
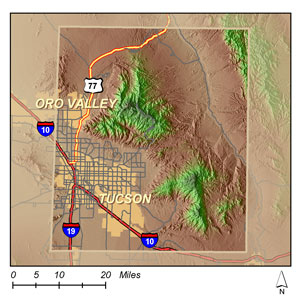
Figure 10:
Catalina and Rincon Mountains, Arizona.
The Huachuca Mountains are located approximately 60 km south-southeast of Tucson, Arizona and directly west of the city of Sierra Vista, Arizona (Figure 11). These mountains range in elevation from 1,199 meters at the base to 2,882 meters at the top of Miller Peak. Vegetation in the Huachucas varies from Chihuahua Whitethorn Scrub and Semi-desert Mixed Grass/Mixed Scrub, at the lower elevations, to Encinal Mixed Oak, and then transitions into Ponderosa Pine at the highest elevations. Like the Catalinas, the Huachuca Mountain area is owned principally by three entities: the USDA Forest Service (41%), private land (32%), and the U.S. Army (20%). Sierra Vista is the main population center (37,775 inhbitants), but there are a number of smaller communities, including Fort Huachuca, in the region as well.
The Huachuca Mountains provide this study with a location that is experiencing rapid population growth in a formerly rural area. Sierra Vista’s expansion is pushing population right up along the eastern base of the mountains. Compared with Tucson, where most of the growth is occurring in areas away from the mountains, Sierra Vista will provide an opportunity to study how growth along the urban-wildland interface affects wildfires.
![]()
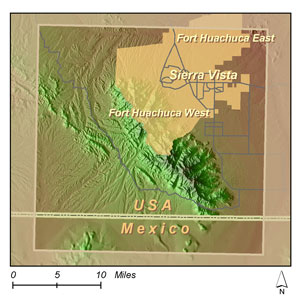
Figure 11:
Huachuca Mountains, Arizona.
The Chiricahua Mountains are located in extreme southeastern Arizona along the border with New Mexico, about 30 km north of Mexico (Figure 12). These mountains range in elevation from 1,096 meters in the valley and rise to 2,975 meters at the summit of Flys Peak. Vegetation in the Chiricahua Mountains is similar to both the Catalina and Huachuca Mountains. At lower elevations, Semi-desert Mixed Grass-Mixed Scrub and Chichuahuan Creosote bush dominate. As elevation increases, the Semi-desert Mixed Grasses give way to mixed oak and pine chaparral type vegetation, finally climaxing at the highest elevations in Ponderosa pine and Douglas Fir communities. The U.S. Forest Service owns about 24% of the land, the Bureau of Land Management (BLM) owns 7%, and another 21% is in private hands. The Chiricahuas only have one nearby population center, Wilcox (population 3,733), as well as a few other smaller communities. However, none of these directly contact the forest.
The Chiricahua Mountains are particularly important to this study because they provide a baseline against which the other areas can be compared. These mountains are located in a primarily rural and agricultural area. They will serve as a source of data on how people impact the ignition and size of wildfires before urbanization of the surrounding area.
![]()
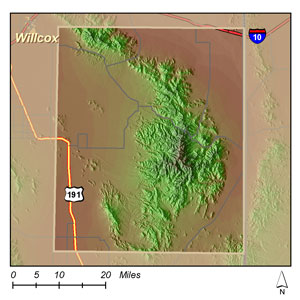
Figure 12:
Chiricahua Mountains, Arizona.
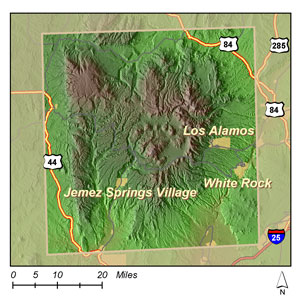
Recorded fire information in the Jemez Mountains of New Mexico dates back to the 1600s and reflects ground fires occurring every 5-15 years until the 1890s. In the late 1890s, overgrazing was the rule, and natural fire incidents lessened to the point of cessation (MacDonald 2001). As of May 2002, the entire Santa Fe National Forest, including the Jemez Mountains, has reported 23 wildfires that consumed 618 acres. Of the 23 fires, 20 (87%) were caused by humans and destroyed 615 acres of forestland (Southwest Area Wildland Fire Operations 2002).
The Jemez Mountains of New Mexico are located in the western section of the Santa Fe National Forest, immediately west of the city of Los Alamos, and only about 20 km northwest of Santa Fe (Figure 13). They sit on the Pajarito Plateau, marked by mesas and steep canyons, with the Rio Grande River on the eastern side. The mountains vary in elevation from about 1,583 meters to a maximum elevation of 3,525 meters at the top of Redondo Peak. Due to the higher elevations in this region compared to the three in Arizona, there is very little desert vegetation present. Vegetation in the forests consists of grasses, pińon, juniper, fir, and ponderosa pine. Land ownership in the Jemez Mountains is split between five groups: the USDA Forest Service (51%); Native American reservations, (18%); private lands (13%); the Bureau of Land Management (5%); and the Valles Caldera National Preserve (5%). There are relatively few urban areas, with only Los Alamos (population 11,909) and Whiterock (population 6,045) having more than 1,000 people.
The Jemez Mountains were included in this project for three reasons: (1) A large amount of data on wildfires has been collected. (2) The only relatively large urban center found within a WALTER study area is the city of Los Alamos. (3) Los Alamos is home to Los Alamos National Laboratory, a facility that works with nuclear and other hazardous materials, presenting special considerations in constructing a model that will, in part, describe areas people believe are worth protecting.
Wolfgang Grunberg
Research Specialist
Center of Applied Spatial Analysis
&
Arizona Remote Sensing
Center
Office of Arid Lands Studies
The University of Arizona
1955 E. 6th Street, Suite 205
Tucson, AZ 85719
E-mail: grunberg@email.arizona.edu
Phone: (520) 621-5694
Fax: (520) 621-3816
Barron J. Orr
Assistant Professor and Geospatial
Extension Specialist
Office of Arid Lands Studies
-- Arizona Remote Sensing
Center
University of Arizona Cooperative
Extension
Arizona Space Grant Consortium
1955 E. 6th Street, Suite 205
Tucson, AZ 85719
E-mail: barron@ag.arizona.edu
Gary L. Christopherson
Director
Center for Applied Spatial Analysis
Harvill Building 460
The University of Arizona
Tucson, AZ 85721
E-mail: garych@casa.arizona.edu
Peter S. Johnson
Research Specialist
Center for Applied Spatial Analysis
Harvill Building 460
The University of Arizona
Tucson, AZ 85721
E-mail: peter@casa.arizona.edu