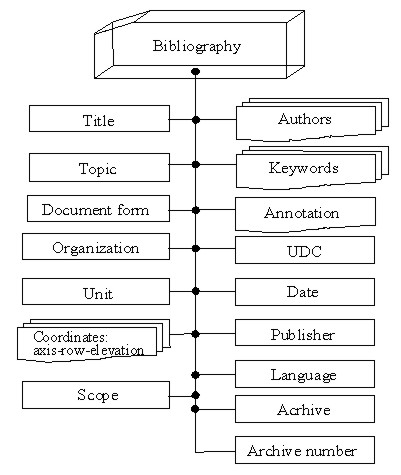
Fig. 1 Structural chart of the "Bibliography" section
|
APPLYING GIS-TECHNOLOGIES FOR CREATING OF THE "SHELTER" OBJECT CONSTRUCTION MODELS |
|
Yuriy
I. Nemchynov, NIISK, Kyiv, Ukraine |
Within the framework of implementation of the German
- French Initiative declared by the governments of Germany and France in April
1996 in Vienna at a conference dedicated to the problems of Chornobyl, an international
project "State of Safety of the "Shelter" Object" started
in 1998. The main idea of the project is to create an Integrated Database containing
acquired, analyzed and verified data that describe the up-to-date state of the
"Shelter" object along the following lines:
– building structures;
– systems and equipment;
– radiological situation;
– nuclear fuel and radioactive waste;
– environmental impact.
All information is accumulated in the integrated Database (DB) developed in
MS Access environment. For visualization of the displayed information and as
a navigator for its retrieval, the Database uses a Geographic Informational
System (GIS) in ArcView environment.
The State Research Institute of Building Constructions (NIISK) performed sub-project #1 for presentation of information about the state of Chornobyl NPP "Shelter" object building structures.
In order to identify the state of building structures, a list of the main sources of information, which allow solving such a task, was created. The structural chart of the said DB section is given in Fig. 1.
As information sources, design/engineering documentation of pre- and post-accident periods, scientific/technical reports, executive/checking documentation, certificates for structures and rooms, field examination documentation, etc. are given in the "Bibliography" section.
Based on an analysis of the acquired information sources, description
of each individual room was performed. The structural chart of presentation
of the room information is given in Fig. 2.

Fig. 1 Structural chart of the "Bibliography" section
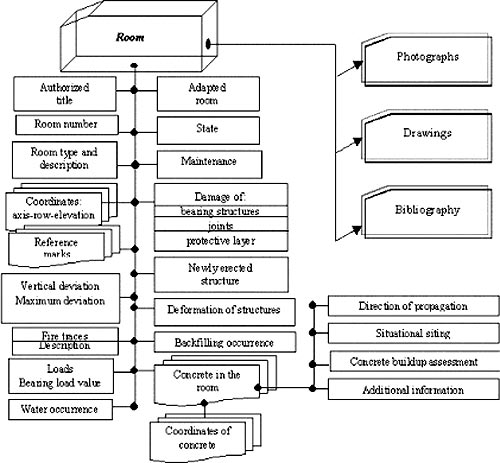
Fig. 2 Structural chart of the "Room" section
As follows from the structural chart given in Fig.
2, description of building structures of a room includes their state,
occurrence of damages, deformations, concrete buildups, fire impact and a number
of other parameters. An example of the completed interface about a room is given
in Fig. 3.
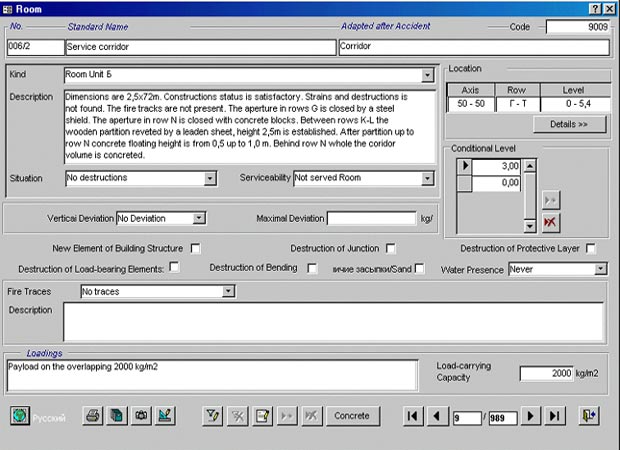
Fig. 3 Example of completing the interface form for a room
At present the DB "Room" section comprises information about the state
of 980 rooms of the following units: B (reactor compartment), D (deaerator stack
and turbine hall), C (makeup water demineralization) and RCA (reactor compartment
auxiliaries).
In order to localize the accident at the 4th generating unit it was necessary to turn the damaged structures into an integrated and, if possible, compact edifice. In view of the fact, protective walls were raised along the perimeter, and roofing of metal beams and shields was erected on top during the "Sarcophagus" erection. In terms of design, all new structures have characteristics that differ from information envisaged for description of rooms. Therefore, in order to present information about new structures (erected after the accident), an individual structural chart was developed, which is presented in Fig. 4. In order to complete the DB for new structures, identification of information sources relating to them and containing data about their state, loads, design deviations and changes, etc. was implemented. An example of completing the interface for a new structure is given in Fig. 5.
For all rooms and new structures references are made to information sources in the "Bibliography" section, as well as to the media information (drawings, photographs) placed in an individual catalog.
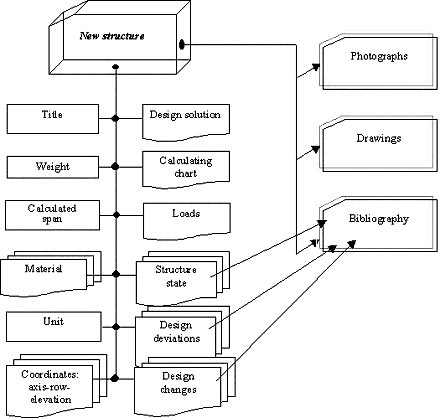
Fig. 4 Structural chart of the "New Structure" section
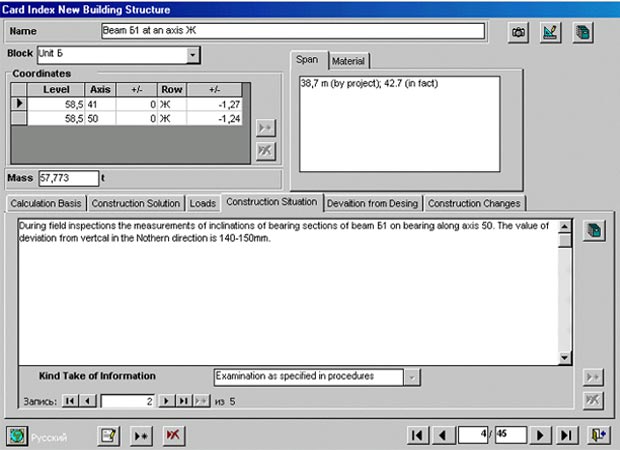
Fig. 5 Example of completing the interface form for a new structure
It was already mentioned that a geographic informational approach had been laid
as a basis for construction of the Integrated Database. The system consists
of a relational DB (Microsoft Access) and a geographic informational DB (ArcView
3.2a). The most part of data in the relational DB is spatially distributed and
can be displayed in the geographic informational dB Plans of the "Shelter"
levels were constructed by ArcView means. In so doing, building documentation
data were taken as a basis. Since the GIS itself is not a relational dB, Access
tables are connected with corresponding ArcView plans, using common fields,
for efficient operation with tables.
The "Shelter" GIS was developed as both 2D and 3D
versions. Retrieval of information about structures using the GIS-navigator
for a subject area is possible for every elevation of the "Shelter"
object. Any elevation of the "Shelter" object can be selected in ArcView,
any individual room can be scrutinized, i.e. every degree of object detailing
is possible. Then the necessary Access tables can be addressed and required
information about the state of building structures can be obtained.
As an example, Fig. 6 shows a 2D view of
the "Shelter" object at elevation 19.5 m.
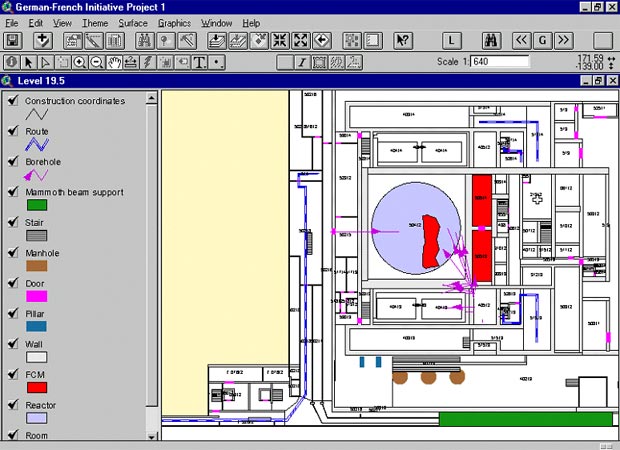
Fig. 6 Plan of the "Shelter" object at El. 19.5 m
In Fig. 7 a 3D image of height level 0.00
m is plotted. It shows the newly filled concrete during and after the accident
to stop the release of radioactive aerosols to the environment. Near image the
original photo of selected room is indicated.
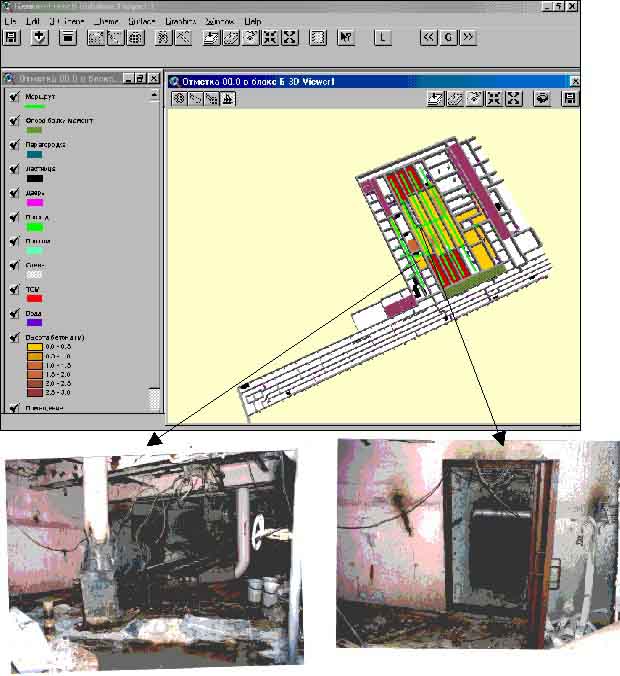
Fig. 7. 3D image of height level 0.00 (top) and the original photos of selected
room (bottom)
AUTHOR INFORMATION
Prof. Yuri I. Nemchinov
State Research Institute of Building Constructions
5/2 I. Klimenko str., Kyiv, 03680, Ukrain
TEL: 0038 044 249 72 36
FAX: 0038 044 248 89 09
E-MAIL: niisk@nemch.kiev.ua
Dr. Aleksandr K. Khavkin
State Research Institute of Building Constructions
5/2 I. Klimenko str., Kyiv, 03680, Ukrain
TEL: 0038 044 249 71 95
FAX: 0038 044 249 37 79
E-MAIL: khavkin@niisk.kiev.ua