GIS For a Large Chemical Warfare Materiel Investigation/Remediation Project in Washington, DC
Author: Marianne Cardwell
Abstract: This paper covers the use of GIS for a large chemical warfare materiel (CWM) investigation project in northwest Washington, D.C. The goal of the Spring Valley FUDS project is to identify and remediate CWM and chemical contamination for more than 1,200 residential properties in one of D.C.'s most exclusive neighborhoods. A variety of off-the-shelf and customized Esri GIS solutions have been applied to support daily sampling efforts, conduct historical photographic analyses, perform footprint analysis to identify areas of likely contamination, focus geophysical investigation work, and perform a number of data/database management tasks. An ArcIMS Web site has also been created to facilitate stakeholder involvement.
I. Introduction
During World War I, the U.S. Government established the American University Experiment Station (AUES) to investigate testing, production, and effects of noxious gases, antidotes, and protective masks. The AUES was located on the grounds of the current American University and used additional portions of property in the vicinity to conduct this research and development of chemical warfare materiel (CWM), including mustard, Lewisite, and Adamsite agents, irritants, and smokes. Immediately after the war, these activities were transferred to other locations; the site was restored, and returned to the owners.i
Over the years the area was developed to its current point, comprising approximately 1200 homes, multiple residences of foreign ambassadors, a university, a seminary, and various commercial properties. Figure 1 shows the location of the Spring Valley Formerly Used Defense Site (FUDS). In 1993, a contractor digging a utility trench in the area uncovered buried military ordnance.ii So far, approximately 700 pieces of ordnance have been collected in the neighborhood, and extensive testing has been conducted to determine CWM-contaminated locations.
The Spring Valley FUDS project is a high visibility project:
from late 2000 to mid 2002, it appeared three times on the cover of the Washington
Post, and four times on the cover of the metro section of the Washington Post.
Additionally, it has had extensive coverage in the local media, as well as
a feature article in the Washingtonian magazine.
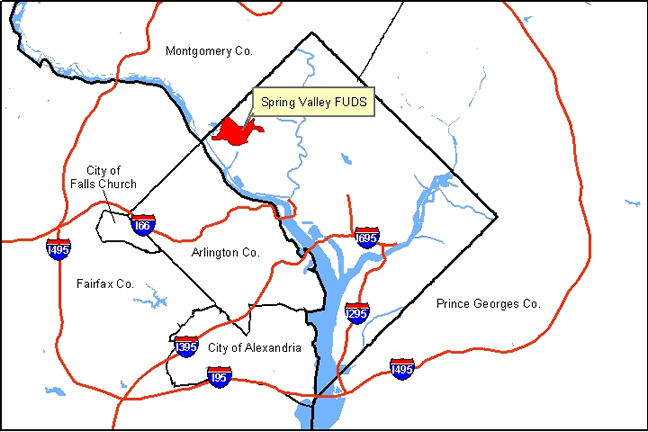
Figure 1
The Spring Valley FUDS project has been ongoing, intermittently, for over nine years, and has, over that time, greatly increased in scope. Since 1993, some five major phases of sampling, or operable units, have taken place, up to the current phase (called OU-5), which involves a comprehensive Spring Valley FUDS-wide soil sampling for arsenic contamination with additional testing for other contaminants at remaining points of interest of concern. This effort involves the sampling of approximately 1200 residential properties and 300 half-acre non-residential lots.iii
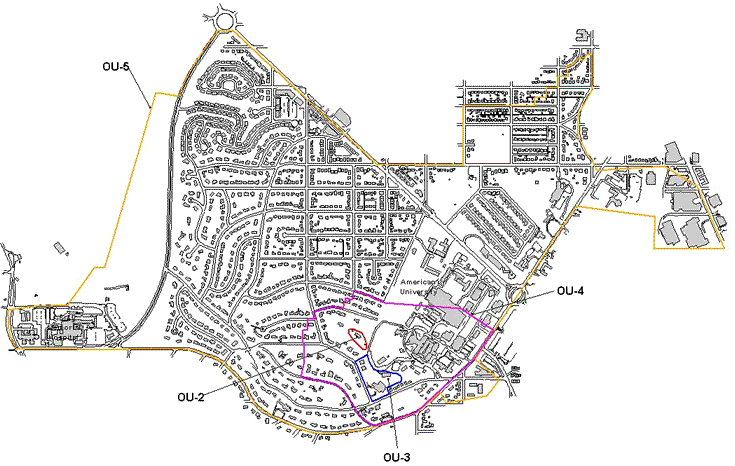
Figure 2
II. GIS Applications to Spring Valley
Within the larger scope of work, GIS has been used to achieve project goals in a number of ways. As can be seen above, the sampling extent at Spring Valley has steadily increased over time. This, and the length of time since the start of the project, has proved to be a challenge in managing the GIS database. The following sections will detail some of the off-the-shelf and customized solutions that have been developed to help the management of the GIS database, as well as some interesting spatial analyses done for the project and the efforts in providing information to all stakeholders through a web site containing various reports, sampling results, and an ArcIMS mapping service.
a. Determining Sample Locations
The sampling process was determined by the Environmental Protection Agency (EPA) and consists of two main steps, illustrated in Figure 3. First, a property is quadrant or half sampled. Properties located in the Central Testing Area (CTA) are quadrant sampled, with 6 samples taken in every quadrant. Each quadrant's subsamples are mixed together to obtain a composite arsenic result for each quadrant. Properties located in the Comprehensive Sampling Area (CSA) are half sampled, with 8 samples taken in every half. Each half's subsamples are mixed together to obtain a composite Arsenic result for each half. If one of the composite samples' arsenic result is elevated (greater than 12.6 parts per million), grid sampling is performed. The same 20' x 20' grid was used for the entire site. The elevated grids are then remediated according to the United States Army Corps of Engineers's (USACE) recommendations, and the resident's preferences.
For each sampling phase, a right-of-entry (ROE) is required from the resident or property owner.
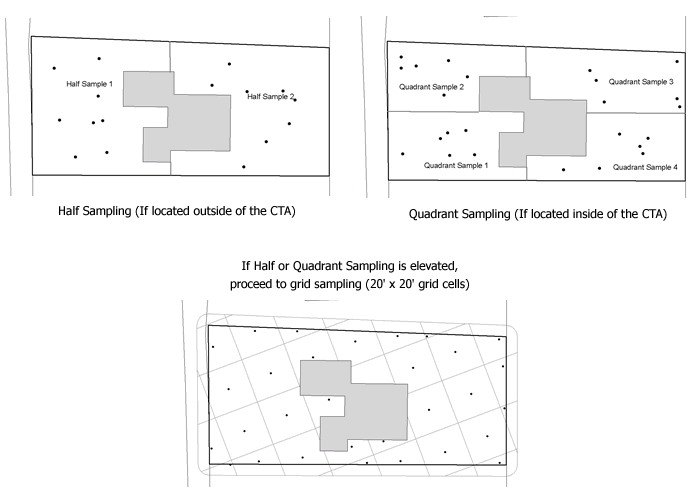
Figure 3
b. Data Integration
As noted earlier, the sampling effort has been extensive, and has required extensive coordination between different parties. GIS has played a large role during this phase of the project. Figure 4 illustrates the different steps required for sampling.
GIS helped during the creation of a sampling plan as well as during every step of the sampling process. There was also extensive coordination between different parties, such as the surveyor, the laboratory, the realty division of the US Army Corps of Engineers (USACE), which tracked ROEs, and finally, field personnel, and the management team. GIS was used to prepare maps for the sampling plan as well as to provide counts of houses for every area, provide field maps for the field sampling team, update the Access database created to track all ROEs, sampling status and results, display sampling results on small and large scale maps, as well as provide data to the surveyor, and incorporate data received from the surveyor.
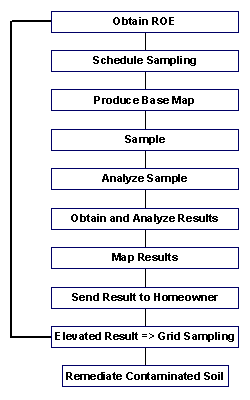
Figure 4
c. Stakeholder Involvement
With the comprehensive sampling involved in OU-5, it was necessary to provide information to the residents so that they may keep informed as to the details of the project. Reports were available at a local library, but it was determined that a website would be useful to make these reports available digitally. In addition, an ArcIMS mapping service was created to allow residents to look at information for their property and their neighborhood. Finally, sampling results were made available online so that USACE employees involved in the project were able to see the latest sampling results. These results are password-protected and only available to USACE and Parsons employees for privacy issues.
Figure 5
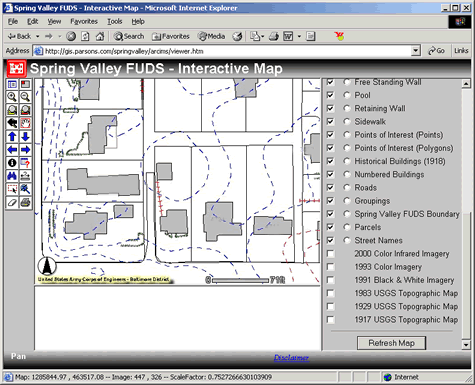
Figure 6
d. Spatial Analysis
During 2000 and 2001, the Environmental Protection Agency's (EPA) EPIC branch analyzed historic photographs from 1918, 1922, 1927, and 1928. The result of this in-depth analysis was the creation of 8 GIS layers showing ground scars and stressed vegetation for each year. A ground scar is an area of bare soil, apparently the result of human activity. A ground scar could be an indication of some type of environmental significance, such as contaminated soil. Stressed vegetation, on the other hand is a manifestation of vegetation stress and damage, such as mortality or defoliation, that is potentially attributable to external environmental factors.iv
In 2001, during the extensive and comprehensive sampling of the entire Spring Valley FUDS, it was established that further work needed to be done to find any buried ammunition that might still be located in the ground. This is meticulous and expensive work, which could not be conducted for the entire FUDS. It was determined properties needed to be identified that were most likely to contain such ordnance. To do so, the USACE devised a classification scheme that would take a look at historic ground scars and stressed vegetation areas determined by EPA EPIC, the difference in elevation from 1917 to 2000 (determined from a 1917 USGS map and a 2000 aerial survey), and arsenic results from any operable unit. Each residential property and half-acre non-residential lot was assigned a four-digit number based on the following scheme: