Canin Associates has developed a MapObjects based application that also uses Arc/Info for distributing population and employment forecast data. The Land Use Forecast Allocation Model (LUFAM) has been developed for local and regional governments in an effort to provide them with a standard process for distributing population and employment forecasts to the parcel level. Distributing the forecast data to the parcel level allows the end user to aggregate forecast totals up to any desired level of geography. The distribution of forecast data is controlled through the analysis of existing development, developable land, developable land suitability ranking and development factors.
Canin Associates
(CA) developed a Land Use Forecast Allocation Model (LUFAM) for Snohomish
County, Washington to facilitate the distribution of the Puget Sound Regional
Council (PSRC) Socioeconomic Data (Zdata). The PSRC provides Zdata for population and employment forecasts at
the Forecast Analysis Zone (FAZ) level.
LUFAM will distribute these population and employment forecasts down to the parcel level based on the availability of developable land, future land use designations, zoning designations, and historical development trends. The distributed population and employment is then aggregated to the Micro Analysis Zone (MAZ) and Traffic Analysis Zone (TAZ) levels for growth management and transportation planning needs.
LUFAM’s main graphical user interface, in Figure 1, contains all of the menus (File, Edit, View, Update, Analysis, Zdata, and Help) and buttons (Zoom In, Zoom Out, Pan, Zoom to Layer Extent, Previous View, Zoom to Full Extent, Identify, Select MAZ, Show Zdata, Select TAZ or FAZ, Add External Layers, Remove Active Layer(s), Print Preview, Print and Clear Selection) that the user needs to run the analysis.
LUFAM was also developed with a navigation window in the upper right corner. This navigation window allows the user to track where they are in the county when they zoom into an area. The red box in this window will represent the extents of the main window. The lower right corner has a zone button and an exit button. The user can zoom to a specific zone (MAZ, TAZ, FAZ) by typing the zone number in the white box and clicking the zone button.
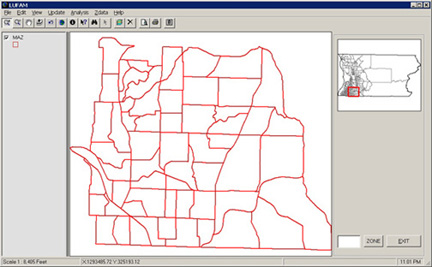
Figure 1: Start Up Window
In the summer of 2001, the Snohomish County Department of Planning and Development Services, Washington, performed a national search to find a Land Use Forecast Allocation Model that could distribute population and employment forecast data at the parcel level. Like many agencies that are involved in distributing forecast data, Snohomish County was looking for a parcel-based approach that identified existing development, developable land and used future land use and zoning to develop distribution scenarios.
The Department of Planning and Development Services receives population and employment forecasts from the PSRC that they disaggregate down to the Micro Analysis Zone level for Long Range Planning and Traffic Modeling purposes. LUFAM has replaced a legacy system that used a 40-acre grid cell database approach to distribute population based on current estimates, generalized land use plan assumptions, and historic growth trend analysis. This system was used for several years, but became obsolete with the availability of new GIS technology and parcel-level data. The Washington State Growth Management Act also requires Snohomish County to take a more detailed approach to land availability and growth forecasting.
Snohomish County has several GIS data layers that are still under development, but wanted to be able to take advantage of the all of the essential data layers in their new LUFAM. The County developed prototype layers in a study area within the county in order to enable Canin Associates to complete the application development.
LUFAM provides the end user with a step-by-step approach for setting up their database to performing forecast data distributions. The steps in the process include; Updating the Base Data, Developable Land Analysis, Identification of Existing Development Patterns, Calculation and Review of Existing Socioeconomic Data, Developable Land Suitability Ranking, Review of Forecasted Demand Numbers and Holding Capacity, Forecasted Development Pattern Review and Calculation and Review of Forecasted Socioeconomic Data.
In developing the project approach, CA reviewed the county data files that were available, discussed the project with County Staff and drew on previous project experience closely related to the development of LUFAM. The key tasks of this project included:
Canin Associates worked closely with County Staff and the LUFAM Steering Committee to ensure the completion of each task and the success of this project.
The approach incorporated a few key elements to improve accuracy and provide the end-user with the ability to modify input variables and quickly re-calculate current year and forecast year socioeconomic data. This approach uses parcel level data and a combination of “top-down” and “bottom-up” methodologies to distribute and aggregate socioeconomic data.
Parcel level data is used to identify existing development and calculate current year socioeconomic data. The parcel data is then overlaid with features that will constrain development such as lakes, wetlands, 100-year floodplain, critical slope areas, bull trout habitat areas and Chinook habitat areas. The use of a moratorium layer was also incorporated into the process to allow for an administrative constraint on development.
The top-down approach to socioeconomic data development has been the traditional approach and generally the easiest way to stay within control totals. The bottom-up approach is theoretically more desirable but difficult to calibrate in order to stay within specified control totals. LUFAM uses a modified approach that incorporates both the top-down and bottom-up approaches. County level control totals are distributed down to residential and non-residential sub-markets within the county, and then Micro Analysis Zone (MAZ) level development factors are used to grow residential and non-residential data at the parcel level based on the future land use, zoning designation and existing development trends.
In determining the build-out pattern of developable land, LUFAM allows the end-user to perform a developable land suitability ranking. This ranking process incorporates land value, proximity to employment centers, proximity to roads, proximity to similar development, and proximity to utilities. The weighting of these factors can be adjusted in order to produce various build-out patterns for forecasting socioeconomic data.
Population and employment forecast data is received from the PSRC at the Forecast Analysis Zone (FAZ) level. This data is then distributed to the parcel level and aggregated up to the MAZ level. The MAZs can then be aggregated to Traffic Analysis Zones (TAZ). LUFAM also has the capability to distribute forecast data at the Urban Growth Area (UGA) or Municipal Boundary levels down to the parcel level for aggregation to the MAZ level. LUFAM will allow the user to input up to three sets of forecast data.
LUFAM will allow the County to perform future land use forecasts through a GIS and will provide staff with: a standardized method; a direct link between forecast data and GIS data; an historical database of forecasts; time savings; and convenient access to development parameters and control totals.
The development of LUFAM focused on five main sources of information that were incorporated into the analysis process. These sources include:
· Existing Land Use (Existing Development)
· Future Land Use and Zoning (Developable Land)
· Land Use Development Factors (Consumption Rates and Ratios)
· Growth Projections (Population and Employment)
· Staff Review and Input
A detailed data flow model was reviewed with staff and the LUFAM Steering Committee. A generalized version of the LUFAM Data Flow Model is included in this document. The main components of the data flow can be found in Figure 2.
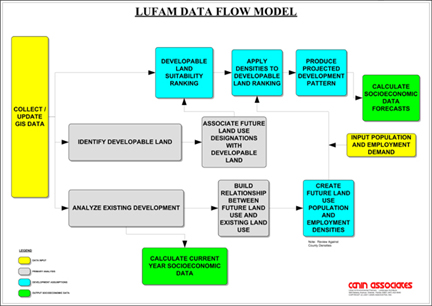
Figure 2: LUFAM Data Flow Model
Each component of the LUFAM Data Flow Model was diagramed in detail to show the flow of data and the analysis procedures. The process flow model should provide a reference for the flow of data through the model and analysis procedures.
Canin Associates worked closely with County Staff to review and collect all relevant GIS data layers and input tables. This data included;
These data sources were used to formulate the methodology for the development of the Land Use Forecast Allocation Model.
LUFAM uses a data update interface to load all of the required data layers and to identify their associated attribute fields. (See Figure 3) The data update interface has several tabs that step the user through all of the input data that is required.
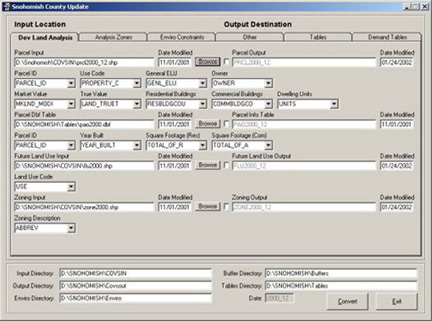
Figure 3: Developable Land Analysis Tab
The Developable Land Analysis is run through the Developable Land Analysis menu. (See Figure 4) The Developable Land Analysis requires that all 11 of the required data sets (Parcels, Enviro, FLU, Zoning, MAZ, TAZ, FAZ, PAO Table, UGA, Municipal Boundaries, and Redevelopable Parcels) are present in order to run. If the Data Update has been completed successfully, each of the required files will have a check in the check box to the left of the layer name and a path to the data set to the right of the data set name.
If the box is not checked and the data set is not loaded, the users can browse for the data set or return to the Data Update GUI to load the data.
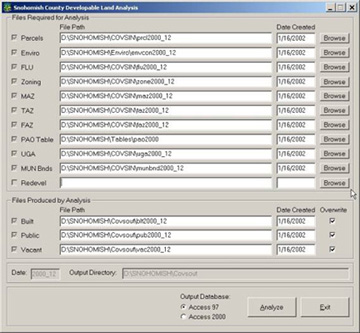
Figure 4: Developable Land Analysis
The Developable Land Analysis is used to identify vacant developable land. The results of this analysis depend greatly on the accuracy of the input data sources. The Developable Land Analysis is performed through an exclusionary process. Land that is developed or committed is removed by querying the Assessor’s parcel database and the committed land use layer. (See Figure 5: Built Parcels)
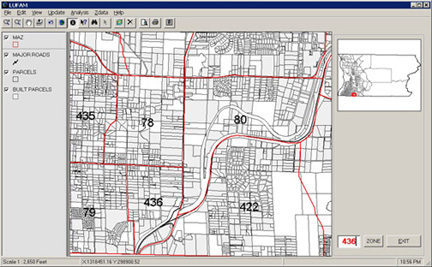
Figure 5: Built Parcels
Environmental constraints such as wetlands, lakes, 100-year floodplain and areas of
significant slope will be extracted from the undeveloped land (the white area
in Figure 5) to create a developable land layer. Publicly owned land will also
be identified because, although it may be developable, these lands are not
available during a typical development scenario. (See Figure 6)
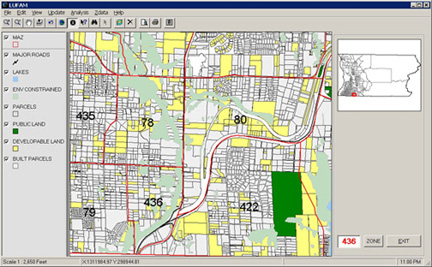
Figure 6: Developable Land
The remaining land, which is represented by yellow in Figure 6, is vacant developable land. The Future Land Use and Zoning layers are then used to associate the appropriate designations with each of the parcels in the developable land layer.
County Staff developed criteria to identify potential redevelopment areas. County Staff identified redevelopable areas and created a layer with specific parcels that is used in the process of allocating redevelopment. Each parcel has a redevelopment weighting (encumbrance factor) that will impact its development potential when ranked against all of the other developable parcels.
The encumbrance factor reflects obstacles or incentives related to the redevelopment potential of each parcel. If there are significant obstacles associated with a parcel the staff may assign it an encumbrance factor. A Factor of 1.5 would cause a parcel with an original rank of 100 to increase to 150 and make it less desirable for development. If the same redevelopable parcel had specific incentives associated with it, the staff may assign a factor or 0.5 to the parcel and, the rank would decrease to 50 making it more desirable for development.
The existing population and employment associated with parcels that are selected in a redevelopment scenario is held as displaced population and employment and is redistributed within the same FAZ.
Analysis of existing development is performed at the parcel level. The type of development on a parcel is identified with information contained in the County Assessor’s Parcel Database. This information is collected and maintained by the County Assessor’s Office.
LUFAM uses the following attributes from the Assessor’s Parcel Database:
· Parcel Identification Number
· Use Code
· General Existing Land Use
· Ownership
· Market Value
· True Value
· Residential Building Count
· Commercial Building Count
· Residential Square Footage
· Commercial Square Footage
· Year Built
· Units
The Use Code and General Existing Land Use attributes provide LUFAM with detailed information to identify the use that occurs on each parcel. The Use Codes are consolidated into residential and non-residential categories in order to identify the location of existing population and employment by parcel.
Ownership information is used to assist in the identification of publicly owned land.
Market Value and True Value information is used to identify parcels that have existing structures. These parcels will be coded as being currently developed.
The Residential Building Count and Residential Building Square Footage attributes are used to determine the number of housing units on a parcel and to calculate the existing population.
The Commercial Building Count and Commercial Building Square Footage attributes are used to determine the number of commercial buildings and the total commercial square footage on a parcel in order to calculate the existing employment.
The Year Built attribute is used for historical growth trend analysis. This assists in forecasting future development patterns.
The Units attribute is the number of dwelling units located on a parcel. This information is summarized by housing type at the MAZ level and used to calculate population.
The results of the existing land use analysis are combined with the County’s Employment Ratios and Population Densities to refine the existing population and employment distributions. These Ratios and Densities are discussed in detail under the Calibration of Land Use Development Factors section.
The current year socioeconomic data is calculated as a result of the Existing Development Analysis. Each parcel is assigned population and/or employment based on the existing land use and what the typical yields are in that area.
The current year socioeconomic data can be adjust through the Calculate Existing Zdata window in Figure 7. Adjustments can be made at the MAZ level.
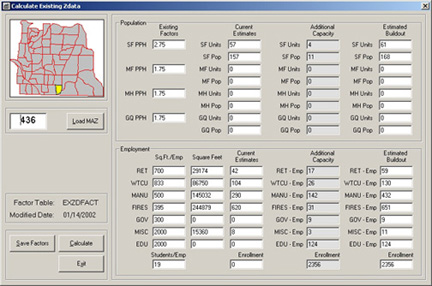
Figure 7: Calculate Existing Zdata
The Existing Factors field represents the people per household (PPH) factors for each of the dwelling unit categories. The user can modify these factors by clicking on the box and typing in a new factor. The user can click the Calculate button to refresh the other fields and then click on the Save Factors button to save the revised factors for that MAZ. The PPH factors are independent by MAZ.
The Current Estimates field represents the estimated population and dwelling units by residential category. This data is calculated using the Dwelling Unit field in the Parcel Layer. The number of dwelling units is summarized to the MAZ level and the population is calculated by multiplying the PPH number by the number of dwelling units.
The Additional Capacity field is derived from the holding capacity that is calculated during the developable land analysis.
The Estimated Buildout field is calculated by adding the Current Estimates to the Additional Capacity.
The Square Feet per Employee (Sq. Ft./EMP) field is the factor that is used to calculate the number of employees based on the total developed commercial square footage. The user can modify these factors by clicking on the box and typing in a new factor. The user can then click the Calculate button to refresh the other fields and then click the Save Factors button to save the revised factors for that MAZ. The Sq. Ft./EMP factors are independent by MAZ.
The Square Feet field displays the total developed square footage by employment category. This data is derived from the Parcel Layer.
The Current Estimates field is calculated by dividing the Square Feet by the Sq. Ft./EMP factor.
The Additional Capacity field is derived from the holding capacity that is calculated during the developable land analysis.
The Estimated Buildout field is calculated by adding the Current Estimates to the Additional Capacity.
This relationship is built by overlaying the Future Land Use layer onto the Existing Development layer to identifying how future land use is consumed. Typically a 10 to 20 year historical trend is used to develop the land use ratios. Non-conforming land uses are also removed from the consumption information.
County Staff developed a land use development factors table that is used in the LUFAM analysis. (See Figure 8) This table is used with the developable land to determine the population and employment holding capacity of each developable parcel based on the Future Land Use (Designation) and Zoning that is associated with it.
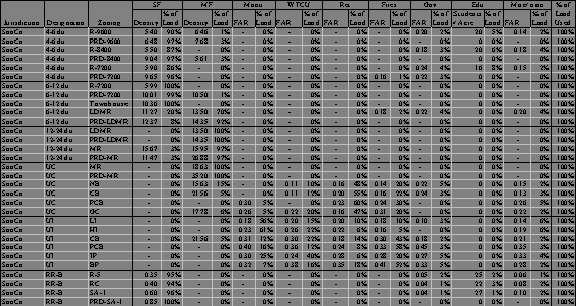
Figure 8: Sample Development Factors Table
Each of the developable parcels is then analyzed to determine their potential for development. (Please see Developable Land Suitability Ranking for further discussion.)
These densities are derived
from the relationship between future land use and existing land use in
combination with existing population and employment data. Snohomish County developed a set of
development factors within a development trend spreadsheet that they aptly
named “Crystal Ball.” These factors
were used to run tests of the model and adjustments to these factors can be
made in the future.
This process overlays the future land use and zoning layers onto the developable land layer in order to calculate the amount of developable land available in each future land use category. This data was used with the calculations in Figure 4 to determine the holding capacity of the developable land.
The developable land suitability ranking is used to determine the development potential of each parcel by land use and incorporates land value and a proximity analysis to features that may induce development. This ranking process includes proximity analysis to similar development, recent development, roads (arterials and highways), employment centers, and accessibility to water and sewer utilities. Each of the factors can be weighted which allows the users to run various development scenarios. (See Figure 9)
The Land Value ranking will be determined on an appraised cost per acre and then ranked relative to all of the other developable parcels. A lower cost per acre will receive a higher development suitability ranking.
Proximity to Similar Development is used to determine current market trends and availability of utilities (in the absence of utility data). The previous 15 years of Similar Development is used in this suitability ranking analysis.
Proximity to Employment Centers is used to determine the attractiveness of building near employment centers. Employment Centers are defined with polygons as an input layer.
Proximity to Major Roads is used to assess the accessibility to the transportation network. The major roads include existing and proposed roads.
Proximity to Utilities is used to determine if the current utility infrastructure is accessible. The utilities data file was still under development at the time of the LUFAM installation.
Setting the Number of Buffer Rings and the Distance of each ring is very important. The number of rings and the distance between them will determine the detail of your analysis. It is important to ensure that the Buffers cover the entire analysis area. Any areas outside of the buffers will not be ranked and therefore will not be considered during the distribution process.
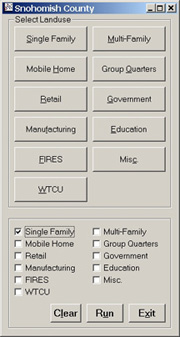
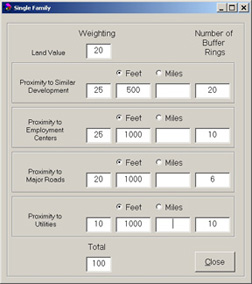
Figure 9: Developable Land Suitability Ranking and Weighting
Snohomish County receives population and employment forecasts from the PSRC. Snohomish County uses these forecasts in their Zdata development efforts. These forecasts also serve as inputs for population and employment demand numbers for the forecast analysis zones that LUFAM uses for distribution purposes.
The Demand Numbers window, in Figure 10, is used to access the Forecasted Control Totals and make revisions if they are necessary. The Demand Numbers window also displays a summary of the population and employment data for each zone. There are seven fields in this window; Current Estimates, FAZ Demand Year1, FAZ Demand Year2, FAZ Demand Year3, Total Demand, Additional Capacity and Total Capacity. (Note: Total Capacity = Additional Capacity – Total Demand.)
The Current Estimates field displays population and employment totals based on the current development.
The FAZ Demand fields contain the population and employment demand for the forecast years.
The Total Demand field displays the FAZ demand total of all forecast years.
The Additional Capacity field displays the additional population and employment capacity that exists in the zone. This calculation is based on the amount of developable land and the factors in the Future Land Use / Zoning Matrix which allow additional growth.
The Total Capacity field displays the total population and employment capacity that exists in the zone. Numbers displayed in red represent demand that exceeds capacity.
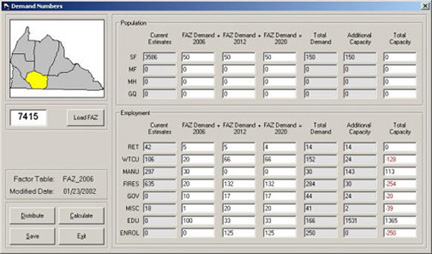
Figure 10: Demand Numbers
The user can navigate between FAZs by entering the FAZ number and then clicking on the Load FAZ button. This will load the data for that FAZ and also highlight the FAZ on the navigation map, or you can simply click on the navigation map to select an FAZ. The user can also edit the Demand Numbers by clicking in the box and typing a new demand number.
The user can click the Distribute button to distribute the population and employment demand numbers after they have been reviewed. LUFAM distributes demand numbers for all forecast years.
The development factors and associated densities from Create Future Land Use Population and Employment Densities are applied to the Developable Land Suitability Ranking process to produce a projected development pattern.
The projected development pattern is produced to allow County Staff the opportunity to review the ranking results before the data distribution occurs. Review of the projected development pattern can be useful in determining the impact of weighting changes in the suitability factors. Staff can review larger areas to determine how their assumptions may shape development patterns and trends.
The Development Patterns windows, in Figures 11 and 12, depict the forecasted development pattern as determined by the suitability ranking. The user can view the landuse development patterns by Suitability Rank or by Forecasted Year Built to check for consistency with county development objectives. The user can click the radio buttons along the bottom of the window to view the various uses and to switch between Rank and Year Built.
This window also has a full set of navigation buttons and an Identify tool for reviewing the Forecasted Development Pattern in detail.
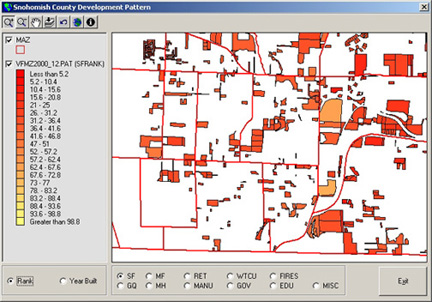
Figure 11: Development Pattern By Suitability Rank
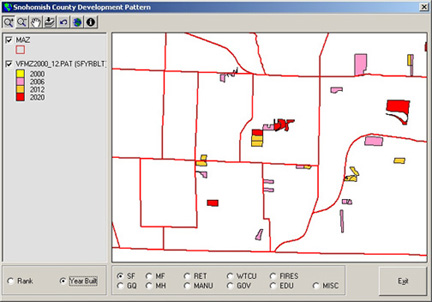
Figure 12: Development Pattern By Year Built
The PSRC population and employment data is distributed to the developable and redevelopable parcels after a satisfactory review of the projected development pattern. The distributed data is then aggregated up to the MAZ level for planning and demographcis purposes.
The user can access output data through the LUFAM interface under the Zdata menu or by opening the output DBF files that are stored in the Tables directory. To open the output files through the interface, the user can click on the Zdata menu and select Population or Employment. This will open the output data, for the MAZ that is currently selected, see Figure 13. The user can click on the Population and Employment tabs to switch between the population and employment data for the specific MAZ. The windows will display the population and employment current year and all forecast years that are available.
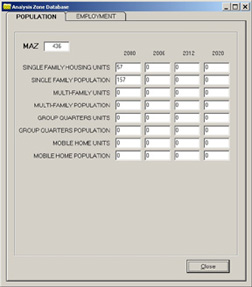
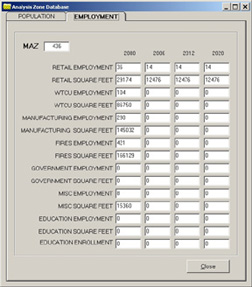
Figure 13: Population and Employment Output Windows
The user can also access the output tables directly in the Tables directory. Figure 14 lists all of the output tables that LUFAM generates.
Note: <year> is a variable that represents the current year and all forecast years.
<res> is a variable that represents each of the residential categories (SF, MF, MH, GQ).
<emp> is a variable that represents each of the employment categories (RET, WTCU, MANU, FIRES, GOV, MISC, EDU, ENROL)
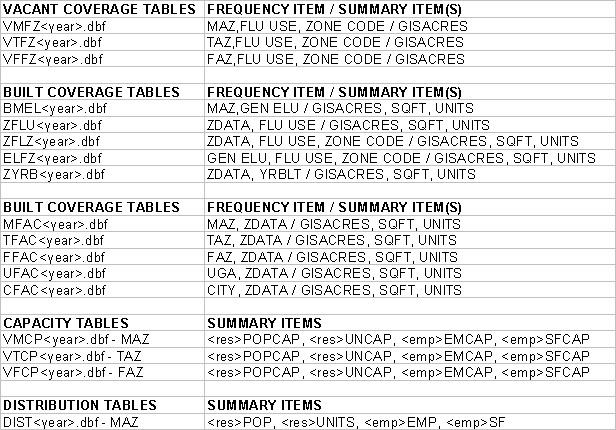
Figure 14: Output Tables Generated by LUFAM
These tables will be used by county staff outside of LUFAM for various types of land use, transportation, and environmental planning purposes.
Population and employment forecasts are based on the developable land analysis, holding capacity and suitability ranking. LUFAM will distribute growth projections based on all of the information that is loaded into the application. County Staff will review the results of these analyses. The LUFAM process can be run multiple times to produce different development scenarios. LUFAM will output housing and employment data summarized to the MAZ level.
The development of the LUFAM application has involved a collaboration of efforts from various Snohomish County staff members that will use and benefit from the LUFAM results. Input on the application design and output data was received from staff in the Planning and Development Services, Public Works, Finance, and Information Services Departments. Staff members from these departments were focused on Demographics, Land Use Planning, Redevelopment Issues, Transportation Planning, Moratorium Issues, Financially Feasible Planning, and Integration with other applications and processes. This input was valuable in developing an application that would benefit this large and diverse group of users.
Requests for application interface and data output requirements were reviewed and implemented where possible. Most of the application design work was performed within the original project scope. Some interface functionality and output data was added beyond the original scope where it was logical to make adjustments in order to provide functionality to satisfy staff needs.
The LUFAM application should provide staff with the capabilities to distribute the PSRC forecast data and run alternative development scenarios. This will require the coordination of a number of data sets and staff review to achieve the desired results. The LUFAM application has been developed in a flexible manner that should allow for future enhancements to be incorporated into the application framework. Some of the future enhancements that the county may consider incorporating may include:
·
Incorporate the Buildable Lands Analysis
·
Access to Forecast Factors
·
Add Level 2 Output to Satisfy Transportation Planning
Requirements
· Built and Vacant Acreage
· Improve Data Output and Mapping Capabilities
· Add ArcIMS Component
Snohomish County has invested a considerable amount of time and resources into developing their Buildable Lands Analysis. This effort uses a considerable amount of GIS data and staff review. Components of the Buildable Lands Analysis have been incorporated into LUFAM due to the requirement to be consistent with ongoing work by county staff.
Incorporating a fully functional Buildable Lands module into the LUFAM application would allow staff to review and edit the results within LUFAM. This would allow for a seamless transition into the process of distributing the forecast data and provide an added level of control over the data throughout the process. Data review and editing tools could be developed that would allow staff to review development information and perform edits if necessary.
During the development of LUFAM there was a considerable amount of discussion about the output that would be provided by LUFAM. The output that is currently produced by LUFAM (Level 1) is consistent with the PSRC forecast data. The distribution of this forecast data will meet the requirements of most of the Snohomish County Departments that will be using the LUFAM data. The Transportation Planning Department requires a more detailed set of land use data (Level 2) in order to perform their transportation modeling assignments. The Level 2 outputs would be similar to the information contained in the Crystal Ball Spreadsheet that has been developed by the Planning and Development Services Department.
LUFAM currently summarizes Built and Vacant acreages into a DBF summary file. The ability to track Built and Vacant Acreages by land use is a valuable tool for long range planning purposes. Additional report generating modules and tracking capabilities could be incorporate into LUFAM if the entire Buildable Lands Analysis was performed within the LUFAM application.
Windows could be developed in order to provide quick reference to built and vacant acreage at any level of analysis. LUFAM could be configured to enable the users to make modifications to development information at the parcel level.
The Data Output and Mapping Capabilities that are currently incorporated into LUFAM are adequate to provide output from the analysis process. The application development focus for LUFAM has concentrated on data analysis and the ability to distribute the PSRC forecast data. Data Output is currently available in a DBF file format and the Mapping Capabilities are limited to an 8.5” x 11” template for generating quick exhibits. Enhancements to the Data Output and Mapping will be contingent on staff needs.
An additional method for distributing the results of LUFAM could include an ArcIMS (Esri’s Internet Map Server) Component. An ArcIMS front end could be developed to allow county staff to view the LUFAM results without having to load LUFAM on their computer or run the analysis independently. This would give the County the ability to distribute the data and information in an organized format and limit the amount of raw or unformatted data that would be distributed.