Driver Inattention in Fatal and Injury Traffic Crashes
Janace A.
Pierce, Research Data Systems, Dale Cooper, Leslie Upledger Ray, Patricia A.
Murrin, County of San Diego Health and Human Services Agency, Division of
Emergency Medical Services
Introduction:
Following the surge in the number of cell phones in use, many jurisdictions have considered banning their use while driving. The assumption has been that drivers are inattentive to driving while using the phone and therefore the phone use causes crashes.
In
California, data has been collected on driver inattention, without reference to
the cause of inattention, for a number of years. However, little attention has been paid to this data element.
Starting
in January 2001, the cause of inattention is being recorded in 10
categories: Cell phone use, electronic
equipment, radio/CD, smoking, eating, children, animals, personal hygiene,
reading and other.
While
it is not possible to draw any conclusions about cell phone use causing crashes
using available data, we can look at and assess the role of inattention as a
causal factor in crashes.
Methods
This
study investigates crashes for which inattention of the driver-at-fault was
reported as a factor in the crash. The following aspects of inattention crashes
are examined:
- Trends in the number and percent of inattention crashes over a five-year period
-
Violation
categories with which inattention is associated
-
Age
and gender of drivers-at-fault in inattention crashes
-
Road
type
-
Time
of day/Time of week
-
Interaction
of age and gender with violation categories, road type and time of crash
-
Subregional
areas of the county
The SWITRS GIS Data
System
The data used for the study are from the Statewide Integrated Traffic Records System (SWITRS) data system. The data set used consists of all fatal and injury crashes that occurred in the County of San Diego. These data are maintained by the County of San Diego Health and Human Services Agency, Division of Emergency Medical Services (EMS).
SWITRS data are collected by the CA Highway Patrol, City Police, and Sheriffs, depending on the type of roadway jurisdiction. Included in this extensive data set are variables describing the crash, the various parties in the crash (drivers, pedestrians, etc), and each of the victims injured or killed in the crash. The crash location is defined by a municipality designation and the intersection of two streets/roads with a directional offset. For crashes that occur on state highways, a postmile location and direction of travel are also reported.
A program, written in Avenue, is used to automatically locate each of the crashes in the data set. The program also provides a special interface to manually locate crashes that the automated system could not locate. When all of the crashes in a given data set have been located, zipcode and SRA (codes for subregional areas) are assigned, based on shape-files provided by SanGIS. These data fields are exported and later merged with the data analysis files that are maintained in SPSS (Statistical Package for the Social Sciences) format. This allows us to produce statistics about drivers and victims as well as about crashes according to any geographic region as long as the geographic region can be represented as an aggregate of either zipcode areas or subregional areas. The mapping versions of the crash files, augmented by variables calculated in the analysis databases, are used to create dot maps of crashes that, for example, show crashes in which inattention was reported for the driver-at-fault.
Results
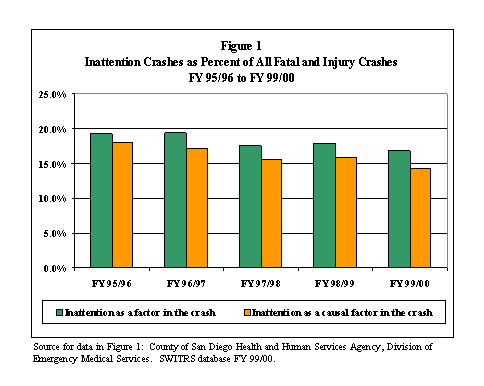
Trends over 5 years: During the last decade, there has been an explosion of the use of cell phones and other electronic devices by drivers. The common assumption has been that the increase in use of these devices would be reflected in a comparable increase in inattention-related crashes. Therefore, it comes as a surprise that over the past five years, the number of fatal and injury inattention crashes has decreased, both in numbers and as a percent of all fatal and injury crashes. These trends can be seen in Table 1 and Figure 1.
Table 1 shows the number of fatal and injury crashes for which inattention was reported, for five years, from FY 95/96 (July 1, 1995 to June 30, 1996) to FY 99/00 (the last year for which geographic data is currently available). Inattention is considered a causal factor in a crash if inattention was reported for the driver-at-fault in the crash. The number of crashes with inattention as a causal factor dropped from 2698 in FY 95/96 to 2243 in FY 99/00. There was a similar drop in the number of crashes in which inattention was reported for any driver in the crash: 2890 in FY 95/96 to 2636 in FY 99/00. During the same period, there was an increase in all fatal and injury crashes from 14970 to 15651.
Figure
1 shows the percent of all fatal and injury crashes for which inattention was
reported. “Inattention as a factor” and
“Inattention as a causal factor” show similar drops over the 5-year period.
In
summary, there has been a decrease in both the absolute numbers and the
percentages of inattention crashes among those crashes where someone was
injured or killed.
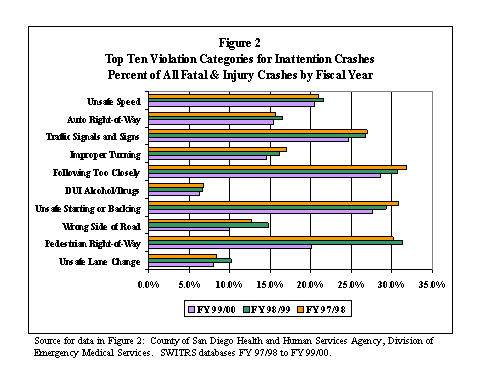
Violation Categories: The top ten violation categories associated with inattention crashes are essentially the same as for all fatal and injury crashes. Unsafe Speed, Auto Right-of-Way, Traffic Signals and Signs, Improper Turning, Following Too Closely, DUI Alcohol/Drugs, Unsafe Starting or Backing, Wrong Side of Road, Pedestrian Right-of-Way, and Unsafe Lane Change. In Figure 2, you can see that inattention is differentially
associated
with these violation categories.
Inattention is a causal factor in about 30% of
crashes
where the violation categories are Following Too Closely, Unsafe Starting or
Backing, and Pedestrian Right-of-Way.
In contrast, inattention is a causal factor in only about 7% of DUI
crashes and 9% for Unsafe Lane Change.
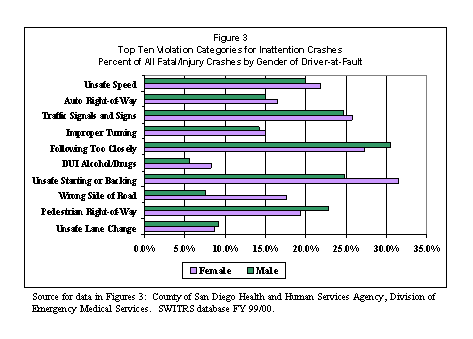
Inattention
by male and female drivers is associated with the violation categories somewhat
differently, as can be seen in Figure 3.
The percent of inattention crashes for males is higher than for females
when the violation category is Following Too Closely
(Males
30.5%, Females 27.3%) or Pedestrian Right-of-Way (Males 22.7%, Females
19.4%). The percent is higher for
females when the violation category is Unsafe Starting or Backing (Males 24.8%,
Females 31.5%) or Wrong Side of Road (Males 7.6%, Females 17.6%).
Gender and
Age: In order to understand the
role of gender more completely, it is useful to see how gender and age are
represented among the drivers-at-fault in all fatal and injury crashes, and
inattention crashes in particular.
Figure
4 shows crashes by gender and age of driver-at-fault: all fatal and injury
crashes and inattention crashes. In all
age categories, the number of crashes for males is higher than the number of
crashes for females. Male inattention crashes total 1290, female 891.
In Figure 5 we see that for nearly all age groups, the percent of drivers-at-fault that are inattentive is larger for females than for males. The exception is the age group 35 to 44 where the percent is nearly the same for males and females. On average, male drivers-at -fault are inattentive in 15.8% of their crashes while the percent for female drivers-at-fault is 18.0% (FY 99/00).
Road Type. For an examination of crashes by road type, State highways
(including Interstate highways) were divided into two classes: Major Freeways and Other State Highways. Major Freeways were defined as: I-5, I-8, I-15, I-805, 52, 94, 163, 905, and
78 (except in zipcodes 92027, 92070, 92036, and 92004). The other State highways are called “Other
State Highways.” All roads not
identified as State highways are called “Other Streets and Roads.” This latter group of roads contains all the
surface streets in the cities and in the jurisdiction of the County. Figure 6 is a map showing inattention
-caused crashes categorized by road type.
Table
2 shows the inattention of the driver-at-fault by road type. Inattention is reported as a causal factor for
only 7.4% of crashes on major freeways.
In contrast, inattention is reported as a causal factor for 17.0% of
crashes on “Other Streets and Roads”.
(Note that included in the “Not Reported” column are crashes in which
fault was not assigned.)
Figure
7 shows that females have a higher percent of crashes on Other Streets and
Roads. This occurs in all crashes as
well as inattention crashes. This
suggests that the higher rate for females in inattention-caused crashes results
from women travelling and having their crashes more frequently in the complex
environment of surface streets.
Time of
Day/Week: It was hypothesized that
rush hour traffic would create many conditions favoring inattention
crashes. Therefore time categories were
set up to explore this. Categories used
were:
-
Wee
Hours, Tuesday to Friday (12:01 a.m. to 6:00 a.m.)
-
Morning
Rush Hour, Monday to Friday (6:01 a.m. to 9:00 a.m.)
-
Daytime
Monday to Friday (9:01 a.m. to 4:00 p.m.)
-
Evening
Rush Hour, Monday to Friday (4:01 p.m.
to 7:00 p.m.)
-
Evening,
Monday to Thursday (7:01 p.m. to Midnight)
-
Weekend
Night, Friday to Sunday (7:01 p.m. to 6:00 a.m. the next day)
-
Weekend
Day, Saturday and Sunday (6:01 a.m. to 7:00 p.m.)
Figure
8 shows the location of inattention crashes that occur during the week in the
daylight hours. Morning and evening
rush hour crashes appear to be more clustered, especially the evening rush
hour. (The appearance of differential
clustering may result from the fact that the evening rush hour is the top layer
of crashes.)
The
number of crashes in each of the seven time periods and the crash rate per hour
are shown in Figures 9 and 10. A number of things stand out from
examination of these two charts.
-
Inattention
crashes are much more frequent on surface streets (Other Streets and Roads)
than on any of the State highways.
-
The
time of day/week pattern is very different between surface streets and
freeways.
-
The
largest number of inattention crashes on surface streets occur in the daytime
hours (9:01 a.m. to 4:00 p.m.) during the week, but the highest hourly rate is
during the evening rush hour.
-
The
largest number and hourly rate of inattention crashes on major freeways occur
during daytime hours on the weekend.
-
On
the major freeways, the morning rush hour has a higher rate of inattention
crashes than the evening rush hour.
Interpretation
of these results is not straightforward because the number of miles of surface
streets is large relative to the number of miles of freeways. Further, and perhaps most importantly, the
number of vehicle miles traveled on the freeways and on surface streets is not
a known quantity.
Subregional
Areas: Subregional areas (SRA’s)
are used widely throughout the County of San Diego for monitoring and planning
activities. Many statistical measures
are calculated and available to the public describing these areas; for example:
demographic data, area, miles of road, etc.
For this analysis, we examined the number of crashes, the crash rate per
mile of road, and the relationship between crash rate and road density.
Figure
11 maps the number of crashes per mile of road by SRA. Table 3 shows the data
for each of the SRAs: The number of
crashes, the number of miles of road, the number of inattention crashes per
mile of road and the road density (miles of road per 1000 acres of area). These data are sorted by the number of
inattention crashes per mile of road.
The
SRAs with the highest rate of inattention crashes per mile of road are:
-
National
City (0.512 inattention crashes per mile of road)
-
Central
San Diego (0.510 inattention crashes per mile of road)
-
Santee
(0.509 inattention crashes per mile of road)
-
Mid-City
(0.345 inattention crashes per mile of road)
-
Oceanside
(0.337 inattention crashes per mile of road)
-
Lemon
Grove (0.333 inattention crashes per mile of road).
The
per mile rates for National City, Central San Diego and Santee are
substantially higher than in any other part of the County.
The
SRAs with the highest number of crashes are:
-
Central
San Diego (203 inattention crashes)
-
Oceanside
(185 inattention crashes)
-
Kearny
Mesa (157 inattention crashes)
-
Escondido
(134 inattention crashes)
-
Mid-City
(109 inattention crashes)
-
Carlsbad
(103 inattention crashes)
Central
San Diego, Mid-City, and Oceanside SRAs are in the top 6 rank for both total
number of inattention crashes and crashes per mile.
It
seems logical that the number of crashes per mile of road might be correlated
with the density of roads – miles of road per 1000 acres. A Pearson correlation coefficient was
calculated: r = 0.725 which is
statistically significant with p = .01.
Figure 12 shows the scatter plot for these two variables.
Summary and
Conclusions:
Trends. There has been a small, but consistent decrease in both the number
and proportion of inattention crashes from FY 95/96 to FY 99/00. This suggests that the increase in cell
phone use by drivers does not cause fatal or injury crashes. However, this does not preclude the
possibility that property-damage only crashes might be caused by such cell
phone use. Further, it’s possible that
cell phone use does cause fatal or
injury crashes, but that major improvements in controlling other distractions
in vehicles counteracts the increase.
Gender. Overall, inattention was a causal factor in 14.5% of all fatal
and injury crashes in FY 99/00. In
those inattention crashes where fault was assigned, crashes caused by
inattentive male drivers outnumber those caused by inattentive female drivers
(males 1290, females 891). However, proportionately
(relative to all crashes), females have a higher rate of inattention crashes
(males 15.8%, females 18.0%).
Violation
Category. High rates of inattention were reported for
the following violation categories (FY 99/00):
-
Following
too closely (31%)
-
Pedestrian
Right-of-Way (30%)
-
Unsafe
Starting or Backing (30%)
-
Traffic
Signals and Signs (27%)
-
Unsafe
Speed (22%)
Male drivers were more likely to have had the violation categories Following Too Closely, or Pedestrian Right-of-Way. Females were more likely to have had the violation categorie Unsafe Safe Starting or Backing.
Road Type. An overwhelming percent of inattention crashes occurred on surface streets/roads – 82%. Only 13% occurred on major freeways. Females are more likely than males to have inattention crashes on surface streets.
Time of Day/Week. The rate per hour of inattention crashes varied by time of week and type of road. The highest rate of inattention crashes on surface streets/roads is the evening rush hour (4:01 p.m. to 7:00 p.m.), followed by the daytime hours during the week (9:01 a.m. to 4:00 p.m.). The highest rate for major freeways is on the weekend during the day (6:01 a.m. to 7:00 p.m.).
Subregional
Areas. Central San Diego, Mid-City, and Oceanside
are the worst areas in the County for inattention crashes—they rank in the top
six for both the total number of inattention crashes and the number of
inattention crashes per mile of road.
There is a significant correlation between the rate per mile of
inattention crashes and the road density of the SRA. (r = .725, p = .01)
Conclusions:
-
Inattention
has decreased as a causal factor in crashes in spite of more pressure on police
to report inattention.
-
Inattention
is reported more frequently on surface streets than on freeways and other state
routes.
-
The
frequency of inattention crashes varied by gender of party at fault relative to
-
Type
of Road
-
Violation
Category
-
Time
of Crash
-
Central
San Diego, Mid-City, and Oceanside SRAs are the worst areas in San Diego County
for inattention crashes.

 |
