Introduce communities currently applying CommunityViz to local planning issues; specifically the Tacoma Dome Area Plan, Impervious Surface Impacts to Watersheds, and Visualizing Future Community Growth in the Town of South Kingstown (Rhode Island). Each Case Study Presentation will include an overview of the community issues explored, the methodology used, and lessons learned. The presentations will address multiple perspectives in the community planning process - visual, analytical, and predictive.
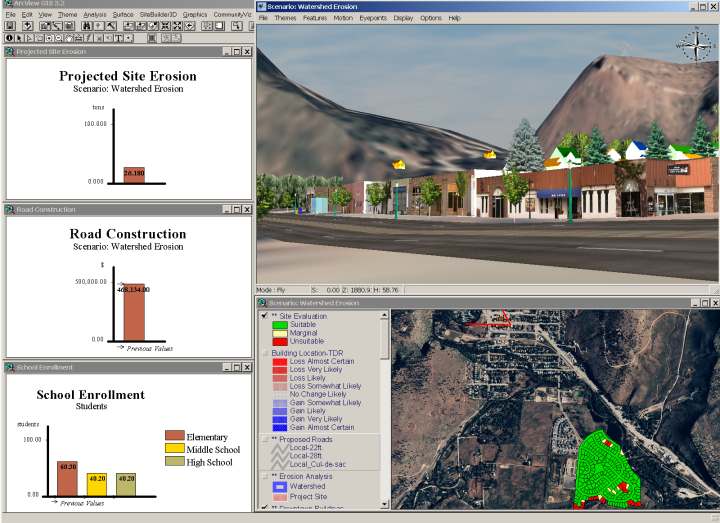
SiteBuilder 3D™ is used to visualize the potential development of the Tacoma Dome area. This is not the final configuration and the building textures are only an approximation of the possible design. SiteBuilder 3D is being used to explore and model different height proposals for the mixed use development and 3D visuals have been created for specific proposed developments. Several views from prominent positions around the development have been created and presented to the Planning Commission. SiteBuilder 3D will also be used for future 3D visualizations of a pedestrian plaza adjacent to the Tacoma Dome.
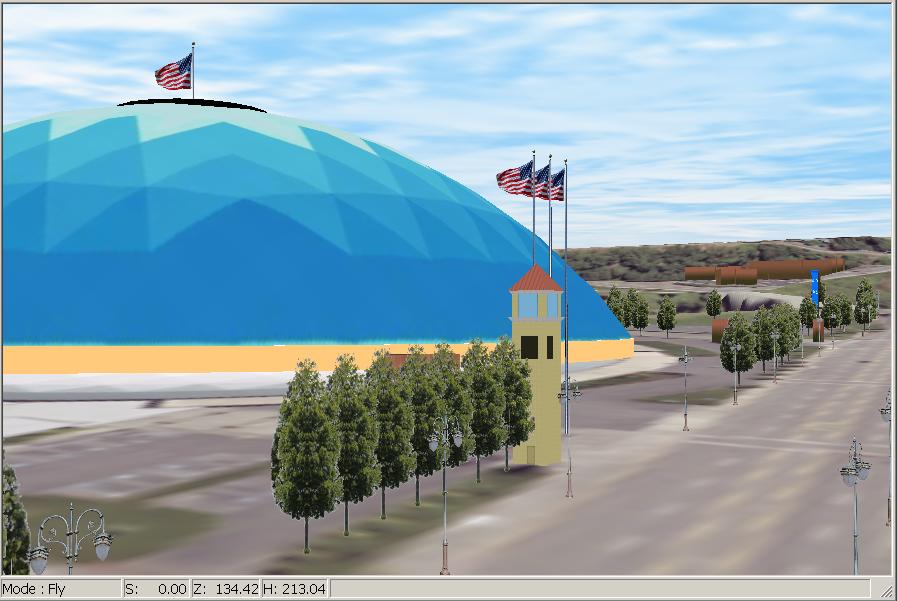
The power of this 3D scene is that it is tied tightly to the 2D ArcView GIS themes.When the buildings are changed in shape or position, the 3D scene gets changed without needing to re-extract data as is the case with some 3D software. Features such as trees can come from the GIS tree inventory and are not merely 3D objects.Having the 3D features tied to the 2D themes enables the planner to interact with citizen groups to make changes to the development and get immediate feedback of indicators as well as the landscape visualization.
Two other CommunityViz™ projects are described in this paper, a build-out of a residential neighborhood to zoning maximums, and a scenario prototype for a parks capacity study.
In May, 2002, Tacoma was involved in the beta test for a Scenario Constructor™ application, Build-Out Analysis. The software was tested in a small residential area south of the Tacoma Tribune building where some Habitat for Humanity houses have been built. The area is in the process of being rezoned to a combination of single family and multifamily. The object of the build-out is to see what the eventual density could look like and to measure the dwelling units per acre.
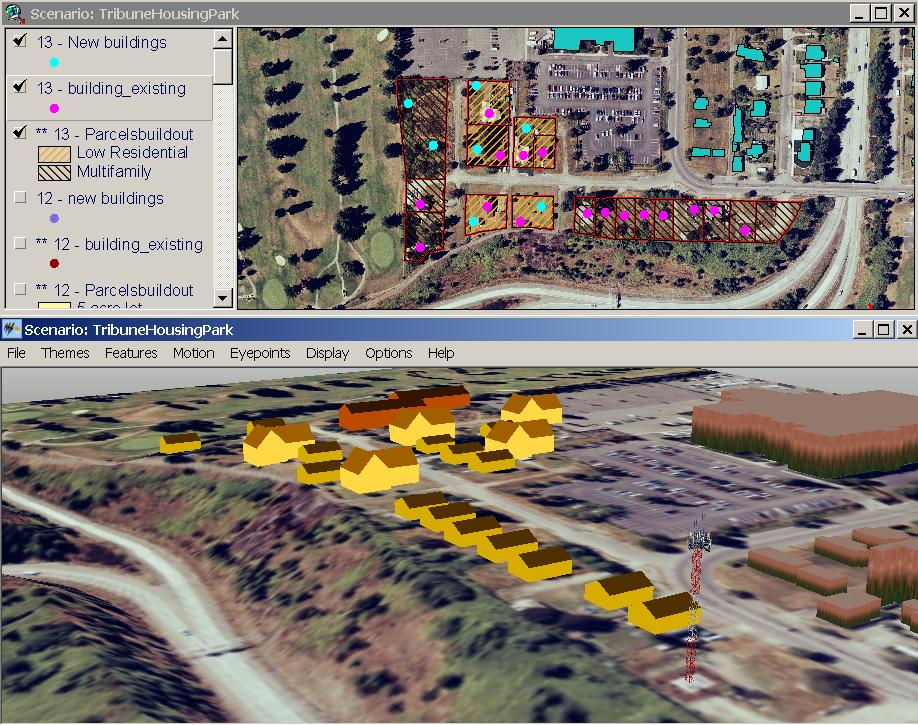
The data for build-out is fairly simple, zoning information and land uses for current buildings. Of course, it is nice to have the ortho photos and terrain for the 3D visualization of the results of the build-out. A wizard is used to set up the data.
ForeverGreen is a group of private and public agencies concerned with planning for future population growth and regional park capacity. Their web site can be found at http://www.tacomaparks.com/ForeverGreen/ForeverGreen.htm. Work has just commenced on this project, so as of June, 2002, only the first prototype of this project has been started. Pierce County GIS has set up a web site for capturing park data. Park data entry has just begun, so only a few parks are present in this prototype.
CommunityViz™ Scenario Constructor™ was used to do a traditional model of park usage by service radius. A radius of 0.5 miles, then 0.75 miles, was used to accumulate population served by local parks. The radius from the park was set up as a variable which can be changed using a slider bar. When the new radius is entered, indicators and linked indicator charts are immediately updated with the new population totals. Previous population totals for the half mile radius are shown on the charts with the arrows.
The NEMO CommunityViz project quantifies the percentage of impervious surface cover (pavement, sidewalks, etc.) in a generic study area. Several variables, involving design and engineering practices that affect the quantity of impervious surface cover, can be used to explore impacts.
NEMO (Nonpoint Education for Municipal Officials) is an educational program for land use decision makers that addresses the relationship between land use and natural resource protection, with a focus on water resources. The NEMO Project was created in 1991 by the University of Connecticut Cooperative Extension System, in partnership with the Department of Natural Resources Management and Engineering and the Connecticut Sea Grant Program. The Project has won national awards from the American Planning Association and the National Environmental Education and Training Foundation. NEMO assists communities to better protect their natural resources while charting the future course of their towns. The Project uses advanced technologies — geographic information systems (GIS), remote sensing, and the internet – to help create effective education programs. NEMO presentations, publications and Web-based services form an integrated package of information centered around the theme of natural resource-based planning. Linking Land Use to Water Quality, the ‘’basic” NEMO educational presentation, explains the links between land use, water quality and community character. The Project then offers follow-up presentations and materials to help communities get started on natural resource-based planning. These programs assist communities to move forward on the two major aspects of natural resource-based planning — planning for areas to be preserved, and planning for developed or developing areas.
This project was put together by Sandy Prisloe at the UCONN Cooperative Extension System. Sandy also works closely with the national NEMO Project (Nonpoint Education for Municipal Officials), which is based at UCONN.
This project was set up to demo adding features and to show through the indicators how new construction will impact impervious cover. Several variables are set up to incorporate various possible best management practices (BMPs).
The study area is in Marlborough, CT. It was selected, or sized if you will, to clearly show houses on the aerial image, which actually is a small part of an IKONOS satellite image. It was set up to have any bearing on a watershed. Watersheds, by the way, vary greatly in size depending on the study area topography, the purpose of the study, etc. In CT the smallest watersheds mapped by the state are around 1 sq. mile. The site in the demo is about 1/3 sq mile.
BMP_pervious Use of pervious pavement rather than regular stuff. Could also be used for driveways although it's not set up for that right now. The BMP coefficient is a variable because there is debate about how effective BMPs are. Using a variable allows you to test sensitive of indicators to changes in the variable, one of the great features of SC.
BMP_Swale Use of grass swale along roads rather than storm drains. Storm drains collect and convey water directly to rivers and streams whereas swale are designed to capture runoff from roads to allow it to infiltrate the ground. Again, this is set up as a variable so sensitivity can be tested.
The default values that are used for the BMPs are just questimates at this point. One question I hope to put before the NEMO audience is "What are good default values to use?" and "Is this a research area that the group, EPA, others should be investigating?"
The Town of South Kingstown, Rhode Island is located approximately 30 miles south of Providence and offers the greatest diversity of natural ecosystems of any community in Rhode Island. South Kingstown encompasses over 79 square miles of land and water surrounded by the Great Swamp, the largest freshwater wetland complex in Southern New England. The Project Team included the University of Rhode Island, Town of South Kingstown, Environmental Center, Community Planning and Landscape Architecture, and The Dunn Foundation.
The Town of South Kingstown and the University of Rhode Island (URI) are faced with multi-faceted growth pressures from a diverse range of communities. South Kingstown is one of the fastest growing communities in the state, while URI is in need of a new 700-bed dormitory on campus. Many residents were deeply concerned with the rapid growth endangering the natural assets of the community. Most of the growth has been driven by tourism, the construction of vacation homes and commercial development.
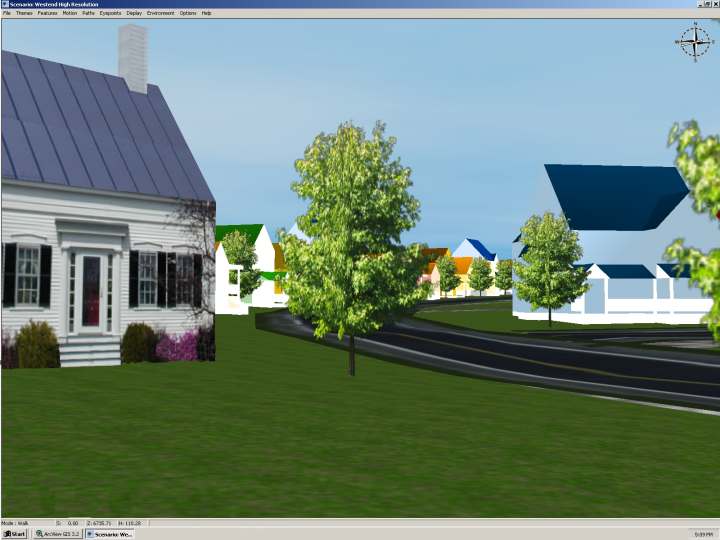
CommunityViz™ enabled the project team to visualize the consequences of various development scenarios on two University properties. First, the Peckham farm site, considered a "rural gateway" into the village of Kingston and secondly a forested area at the edge of the campus. Scenario Constructor was used to model three student housing options at these locations. Environmental constraints, model impacts on the community's infrastructure systems i.e., water usage, sewage and traffic were also taken into consideration. SiteBuilder 3D™ was used to compare an apartment complex with two different neo-traditional alternatives and adjust the building sites to visualize the impact along a heavily traveled scenic roadway. Policy Simulator™ was used to model like growth centers and new residential development in the Town of South Kingstown as well as the impact of the 700-bed dormitory addition on future growth patterns in the University neighborhoods.
During the examination of the site location for the URI dormitory, people were brought together that normally did not meet and network on a regular basis. The community and URI were equal partners in exploring the impacts of the development on the community. This level of cooperation occurred because of the use of CommunityViz. The University, the community, and the town will be able to better plan for new developments and will extend their analysis to broader development issues for Washington County. They plan to use CommunityViz to assist the larger community in visualizing and understanding the consequences of the growth path and how zoning policies and other approaches can be used to shape the future.
Designed for community planning and natural resource management applications and built with GIS technology from Esri®, CommunityViz™ is a decision-support framework comprised of three software components: development and analysis of alternative development scenarios, 3D visualization of these alternatives, analysis of development policies and their impacts over time. CommunityViz™ version 1.3 works as an extension to Esri’s ArcView® 3.x. and is comprised of up to three integrated components:
CommunityViz™ Scenario Constructor™ provides a rich set of impact analysis capabilities, featuring the functionality of a “spatial spreadsheet” that can perform numerical computations on geographic data in real time. Scenario Constructor allows users to create maps, charts, and reports showing alternative scenarios based upon information contained within the GIS enterprise systems and other assumptions.
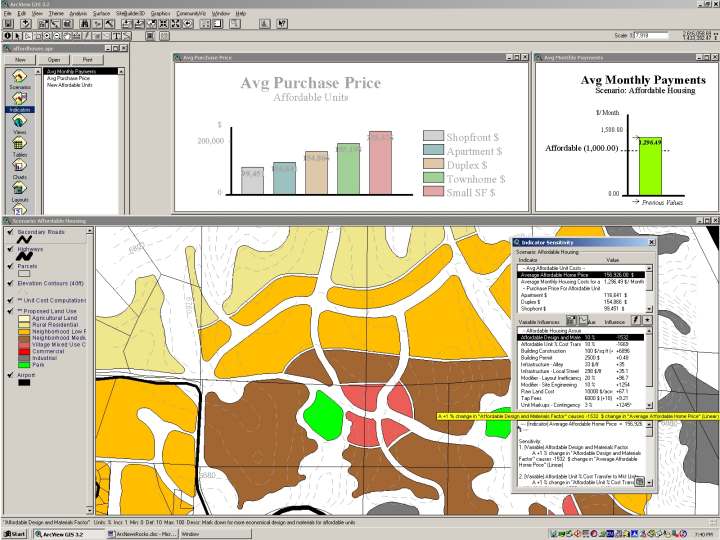
CommunityViz™ SiteBuilder 3D™ enables users to build photo-realistic, three-dimensional, interactive models of geographic data. Once built, the models allow virtual “fly-through” and exploration, giving people the ability to visualize land-use proposals and to interactively change the modeled environment. Scenarios created with Scenario Constructor are then draped on the 3D canvas and depicted as a “virtual community.”
CommunityViz™ Policy Simulator™ is a forecasting model using agent-based modeling techniques to simulate likely future impacts of present-day governmental and regulatory policies. Forecasts depicted in Scenario Constructor allow for innovative comparison and analysis of alternative policies.
Created and designed to help professional planners and community members alike understand, visualize, and make informed decisions about the future of their neighborhoods, CommunityViz™ is a useful in planning and natural resource management applications.
Projects designed by: Donna Wendt-City of Tacoma, WA; Sandy Prisloe-University of Connecticut Cooperative Extension Service, Carol Baker- Town of South Kingstown, RI.