This paper presents the COTRIS system that is used to track traffic collisions, traffic volumes and road conditions in Strathcona County, Alberta. It was developed through a joint partnership between the Royal Canadian Mounted Police (RCMP), and Strathcona County. This paper will show how COTRIS was designed to build “smart” data sets that are explicitly linked to GIS street network file. The result is that every intersection and road arc segment can be queried to determine the traffic collisions, volumes or road conditions at that location. This paper will present the development process from problem identification to implementation.
The COllision, Traffic and Road Inventory System (COTRIS) is an integrated system that uses a SQLServer database, a Visual Basic interface and MapObjects development components to link GIS attributes to collision, traffic volume and road condition data.
GDS & Associates Systems Ltd., a leading Canadian
systems integration company, was commissioned to develop this system by
COTRIS is designed to build “smart” data sets that are
explicitly linked to the GIS.All data
collected in COTRIS are linked to the GIS through a feature ID code.Users are able to query the data using a GIS
tool such as ArcView or ArcInfo and instantly see the results in a map view.
One of the primary goals of the project was to improve upon the “pin map” that the RCMP created each year.This “pin map” was essentially a large map of the County hung on the wall in the RCMP Sherwood Park Detachment offices where data entry staff would place a pin for each collision that occurred during the year.At the beginning of each year the RCMP would photograph the map on the wall, send it over to the County offices for data entry, remove all the pins and start the process again.
County staff were frustrated with the lack of accuracy on the pin map.Sometimes they weren’t sure if the collision was supposed to have occurred in the centre of the intersection but had been moved to the side because there were too many pins in the middle of the intersection.
COTRIS is essentially a data entry system with 13 canned
reports.Because COTRIS uses the
MapObjects development environment, users are able to enter both attribute and
location data on the same screen.MapObjects lets users locate collisions, count stations and segments of
road for storing road conditions directly on to a map of
However, COTRIS is not a GIS.Its main job is to help users create GIS-ready datasets.
The most important feature of COTRIS is that the SQL Server database is related to the GIS database directly through the arc ids of the streets and the node ids of the street intersections.This means that all records relate back to the shapefiles through a primary key/foreign key relationship.
To get the full value of COTRIS, a GIS that can read shapefiles and connect to a SQLServer database must be used.For example, users can load the street network file in ArcView and have available to them all the attributes stored in the SQL Server database.
This means that users could create maps with ArcView showing such statistics as:
COTRIS captures virtually all of the attributes contained in the Alberta Accident Police Report. There are 15 attributes about the collision in general, 19 attributes about each vehicle (or animal) involved in the collision, and 8 attributes about each person that was traveling in each involved vehicle.There can be any number of vehicles (or animals) involved in the collision, as well as any number of people traveling in each vehicle.
Most importantly, this module captures location information about the collision using a MapObjects window that allows the user to add the collision location (a point) directly to a shapefile.
Behind the scenes, COTRIS will add a point to the collisions shapefile and optionally store the arc id of the nearest arc of the street network file.For example, no arc ids are stored if the collision occurred in a parking lot (this type of collision is classified as an ON PRIVATE PROPERTY collision).
If the collision has been defined as an INTERSECTION collision, COTRIS will also ask the user to select the intersection that should be associated with the collision.Behind the scenes, COTRIS stores the intersection id (node id) in the database. Asking the user to define the intersection specifically means that the data is unambiguous.For example, an intersection such as Sherwood Drive and Wye Road is very large in area, since both streets are six or more lanes wide, whereas an intersection such as Sherwood Drive and Fir Streetis much smaller in area (Fir Street is only four lanes wide).
COTRIS captures three separate aspects related to traffic volumes.One screen captures attribute data about the count location, known as a traffic station, and lets the user store the count location in a point shapefile using a MapObjects window.Behind the scenes, when a user clicks on the map to locate the traffic station, COTRIS adds the point to the shapefile, and stores the arc id of the street where the station is located.
A second screen captures data about traffic volumes specifically; for example, the date and time the count was taken, and the direction of traffic. Each count is related to a particular traffic station which means that each count is also therefore related to a particular arc in the street network file.
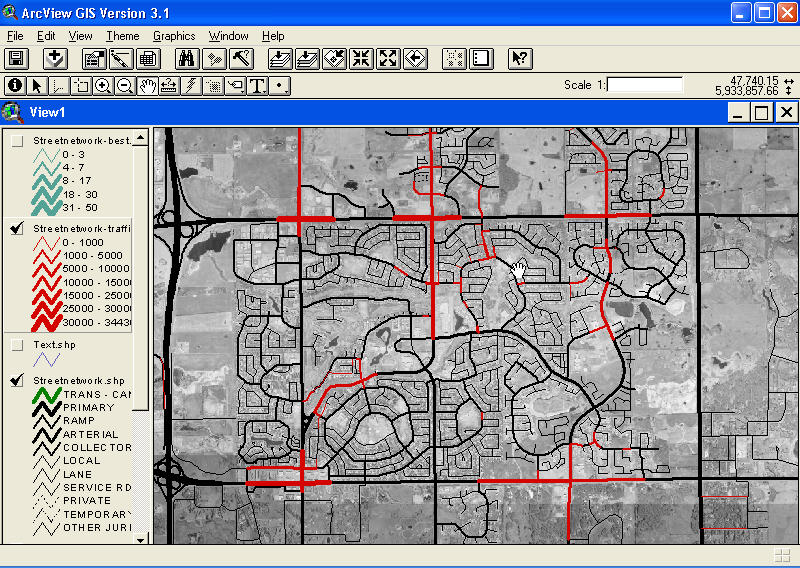
This means that any counts at that traffic station are automatically linked to the street network file.Within ArcView, County staff can select any arc in the street network file, and find out all the traffic counts that have been taken on that street.From there, County staff could use ArcView to average the counts over time, or look at particular counts in the last year.For example, they would be able to make a map where all roads are given a line thickness that reflects the volume counts taken within the last year.
COTRIS also captures data relating to road conditions.One screen captures data about the section of road, its location, the year of first surfacing, the name of the hamlet or subdivision, and a user-defined road name.On the same screen, there is a MapObjects window that lets the user is manually select the road arcs from the street network file that make up the section of road.Behind the scenes, COTRIS stores each arc id from the street network file that makes up the section of road.
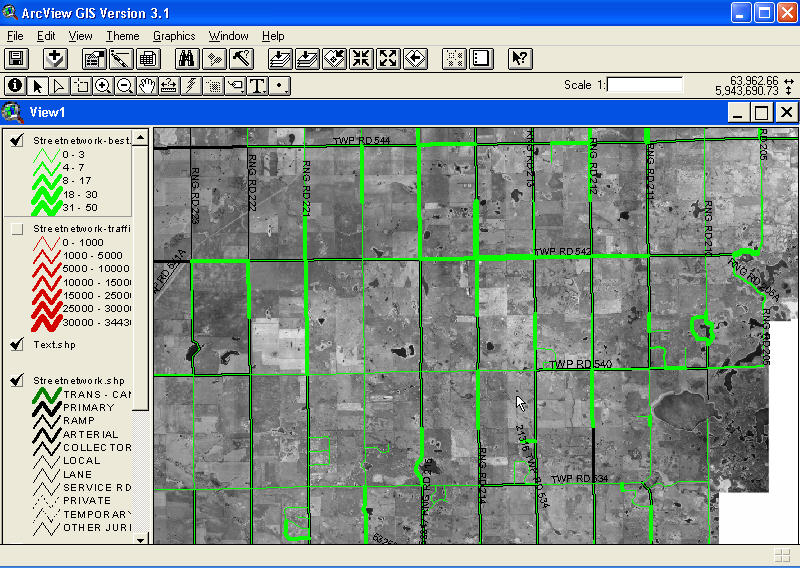
Because all the road conditions captured are related to arcs in the street network file, County staff are able to map the data in ArcView.For example, County staff can produce a map highlighting streets that have a low surface rating.Or County staff could use the data in ArcView to query the database; for example, asking ArcView to show the road conditions for the selected street.
There are thirteen canned reports in COTRIS. Each allows users to define one or two different attributes to be used in the query.For example, users can pick from a list of tracked intersections and view a 5-year moving average of the number of collisions per million entering vehicles. Users can view line graphs that depict the change in this moving average over the last 10 years.
All the data collected by COTRIS is linked to the GIS through a node (intersection) id or an arc (street) id.This means that not only can all the attributes collected by COTRIS be mapped on to the street network but also SQL queries can be run against the database to produce a huge number of statistics.
The following screen shots are taken from ArcView. The first
screen shot shows

The second screen shots shows

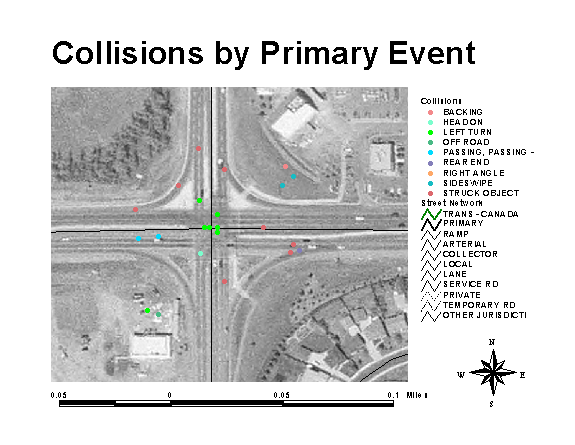
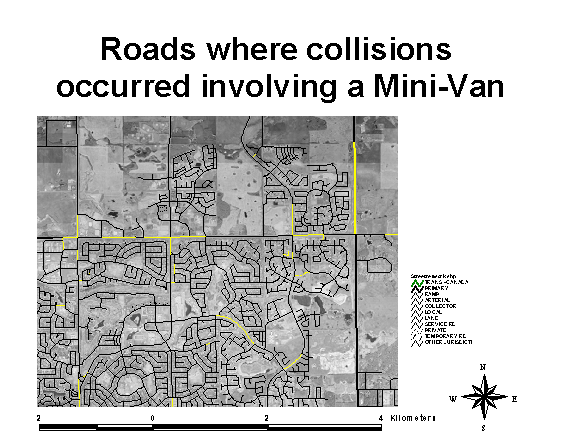
The third screen shot shows traffic collisions colour-coded by primary event and the fourth screen shot shows traffic collisions where a mini-van was involved.Both these maps are able to convey statistics much more easily than Excel spreadsheets or charts and graphs etc.


Ann Hollifield
GDS & Associates Systems Ltd.
10665 Jasper Avenue, Suite 700
Edmonton, Alberta
ahollifield@gds.ca
Cary Buxton
Strathcona County
Sherwood Park, Alberta
buxton@strathcona.ab.ca