Economical Sewer Main Rehabilitation Utilizing ArcGISTM and Dynamic Segmentation
Dale V.
Clancy, P.Eng.,
Infrastructure
Services Department
Saskatoon,
Canada
Jan-Mark
Gustafson, P.Eng., Ph.D.,
Infrastructure
Services Department
Saskatoon,
Canada
Lynne Higgins, P.Eng
Infrastructure
Services Department
Saskatoon,
Canada
ABSTRACT
Traditionally,
sewer main condition is determined by video camera inspection and
evaluation. The high cost of sewer
camera inspection has led to a selection process that considers maintenance and
sewer cleaning records in conjunction with sewer main characteristics to
determine inspection priorities. ArcGIS provides a spatial platform to consider
deterioration and quantify failed mains and quickly identify sewer camera inspection
priorities. To maximize the benefits from limited rehabilitation funds, the
sewer rehabilitation industry’s focus has shifted to partial and spot
rehabilitation strategies. Dynamic
segmentation and thresholds are used in evaluating partial rehabilitation
alternatives that improve on the economics of rehabilitation decisions.
INTRODUCTION
Customers’ demands and
legislative requirements to ensure the sustainability of sewer utilities have
motivated utilities to quickly evaluate and quantify their sewer network. With limited budgets and growing demand to
rehabilitate sewer mains, utility managers need analytical frameworks to
evaluate and economically renew deteriorating sewers. The focus of this work is
the development of frameworks to determine sewers camera inspection priorities
and to choose from among those available that treatment which provides the best
balance between costs and risk.
The traditional approach to
sewer rehabilitation is to video inpsect sewer mains to determine their
structural and operating condition. The
video is evaluated and a scoring or similar system is used to quantify the
condition of the main between manholes. The cost involved in video inspection
and video evaluation represents a significant expenditure. In this work, information from maintenance
activities and sewer attributes is considered in identifying the risk of
failure and economic considerations in determining whether or not to video
inspect.
This framework stresses the need
for economical collection and analysis of information on the condition and
factors that influence the long-term sewer main performance. In the development of an analytical
framework, the need for a spatial platform quickly became apparent. ArcGIS was
selected to provide the spatial analysis tools. ArcGIS permits analysis of factors from a variety of different
information sources. Features available
within ArcGIS allow for efficient analysis of information from attribute,
maintenance, repairs, video inspection and rehabilitation sources.
BACKGROUND
Centrally located on the
Canadian Prairies, the City of Saskatoon was incorporated in 1906 largely to
facilitate the construction of water and sewer systems. The City currently has a population of 208,000
people served by 854 km of sanitary sewer mains and 58,000 sewer services.
In 1982, the City initiated
a video inspection program. As of 2001,
496 km of sewer video has been taken using black and white, and color video.
This represents 58.2% of the sewer system.
However, very little of the video has been analyzed using a generally
accepted framework.
In 1989, the City of
Saskatoon initiated an annual program of sewer main replacement, followed by a
sewer-lining program starting in 1990.
At the start, there were several candidates of clay tile and concrete
mains for which the need for rehabilitation or replacement was obvious. To date, 13.2 km of sewer mains have been
replaced and 14.2 km have been lined.
In 1990, the City began the
long-term commitment to develop spatial models for water, sewer, road and
sidewalk assets. Initially, as-built drawings were entered into a spatial
database. In-house databases were developed to capture attribute, operating and
repair data.
In 1997, the City of Saskatoon
initiated a review of its rehabilitation programs as part of a corporate
strategic plan. The goal of this review was to ensure the long-term
sustainability of Public Works infrastructure at minimum long-term cost. An
Infrastructure Group was formed to develop analytical frameworks to consider
roads, sidewalks, and water and sewer assets.
The group looks first at the economics by considering approaches that
minimize long-term costs. Minimum
acceptable service levels are defined and are considered as constraints. After the economic models are developed,
options that will improve service are considered. These options are evaluated based on the improvement in services
versus the increased cost of the proposed service. Ultimately, Council is asked to make choices on levels of service
versus cost both now and for the future (Clancy, Gustafson1).
In 2000, a study of the
Sanitary Sewer System was initiated to review the work to date and to develop a
framework for analyzing the sewer system leading to a sustainable
rehabilitation plan. In 2001, ArcGIS was chosen as the City of Saskatoon’s
corporate platform largely to facilitate analysis and utilize water, sewer and
roadways spatial models. Today ArcMapTM is used to quickly evaluate
spatial and attribute information, expanding the opportunities to better
understand assets.
ANALYTICAL FRAMEWORK
For sewer utility customers,
a sewer system has failed when sewage backs up into their homes or
businesses. Unfortunately, maintaining
a sewer infrastructure with few or no sewer backups is not economical. Each utility, whether implicitly or
explicitly, determines the level of risk that defines service and costs to
their customers. For this reason there
are no universally accepted rules that define when and how a sewer should be
inspected, evaluated, analyzed and rehabilitated. Each community and each utility has different values and a
different tolerance to risk.
Risk is the probability of a
failure multiplied by the consequences of the failure. In a sewer system, the consequences are the
cost of damage to property, repair costs and the impacts to the customer. The
probability of failure is based on the structural and hydraulic characteristics
of the main. The analytical framework is used to implicitly consider the
probability and consequence of failure.
This framework has been developed to consider risk in answering two
specific questions:
“What
treatments should be applied under what conditions to sustain the sewer system
above acceptable levels of service at minimum long-term cost?”
and,
“Under
what conditions should the utility spend money to video camera sewer mains to
obtain better information about the condition of the sewer?”
In answering the first
question, available treatments, the extent of the treatment, the cost of these
treatments and the risk of future failures are considered in estimating the
long-term costs.
A sewer can either be lined or replaced. Lining is
significantly less expensive than replacing the main but there are constraints
that may require an excavation to repair a main before lining. These treatments result in a sewer that is
expected to have an economic life in excess of 50 years. The other alternative is to Do Nothing.
The extent of the treatments is simply considered
as spot, partial or full replacement.
Applied to both replacement and lining, the definitions are used to
differentiate between the rehabilitation costs and the technical issue
associated with these treatments.
The long-term cost of maintaining the sewer
includes the costs now and in the future.
Replacing or lining the entire sewer effectively reduces the probability
of failure to near zero for the foreseeable future, but the capital costs are
spent in the present. Do Nothing means
that capital cost are deferred to the future.
The utility accepts the risk of future maintenance and damage claims and
defers the rehabilitation cost to a future date. The rehabilitation costs may also be significantly higher due to
further deterioration of the main, but could be offset by the economic benefits
of deferring the capital cost of replacement.
A third option is to undertake partial treatments
that eliminate defects with the largest impact on the risk of failure. This strategy expends funding on partial
treatments to reduce but not eliminate the risk. Future repair costs and rehabilitation are expected and
considered in defining long-term costs.
If the components of risk can be reasonably
estimated, risk and costs can both be expressed in monetary terms. Then the goal would be to minimize the
long-term costs plus risk in sustaining the sewer main system, subject to
minimum acceptable levels of service and available budget/resources. In
sewer main systems, the probability of failure, given what is known about the
conditions around and of the pipe, is difficult to estimate. The problem becomes one of balancing risk
and costs in accordance with the community’s values.
The authors ask the second
question, “Under what conditions should the utility spend money to video
camera sewer mains to obtain better information about the condition of the
sewer?” to improve our knowledge about the main and therefore improve our
knowledge about the probability of failure. Selecting a main for video
inspection is a technical and economic decision to expend funds to gain
information about that sewer. Deciding
to inspect means that any improvements in estimating risk as a result of the additional
knowledge exceeds the cost of the video inspection and evaluation. Deciding not to inspect means the
improvements in estimating the risk is not worth the additional cost.
Video inspection includes
the evaluation of the condition of the main.
The methodology developed by the North America Association of Pipeline
Inspectors (NAAPI2,3) is used in this work to quantify the sewer
main condition. The NAAPI score at a sub-segment level is used as a proxy for
the probability of a failure based on pipe condition. That is, the higher the NAAPI score, the higher the probability
of a failure. Video inspection is required for planning a dig or a lining.
If a NAAPI score was the
true estimate of the probability of failure, then risk and costs could be
summed to reflect a total expected cost.
However, because NAAPI scores are a proxy to the probability of failure,
the concept of thresholds needs to be introduced to permit the balancing of
risk and cost. A threshold then, is a
boundary between the conditions (represented by NAAPI score) above which a
treatment would be undertaken and the conditions under which the treatment
would not be undertaken. A threshold
implicitly represents a utility’s tolerance to risk.
Selecting a threshold also
defines the utility’s cost of rehabilitating a sewer main. By considering different thresholds and the
estimates for a rehabilitation cost model, the analytical framework defines a
rehabilitation cost for each threshold.
These costs can be aggregated over the sewers that have been evaluated
to estimate the total funding requirements.
In the following sections,
the authors identify various sources of information that help in deciding
whether or not to video inspect. ArcGIS
is used to bring that information together in a common format and to display
any spatial relationships among the various factors, which may affect the
decision.
VIDEO SELECTION PROCESS
In a perfect world all
necessary information about the sewer network is available and can be evaluated
in making a perfect decision. In
reality no utility can afford to collect all the information that would lead to
a perfect decision. In fact, it is very possible that the collection of
additional data would cost more than the potential savings resulting from even
a better decision. For most utilities
it is the information at hand that should be considered in making video
inspection decisions.
In the City of Saskatoon,
the municipality has been collecting and electronically storing attribute and
operations data on the sewer network since 1990. This information is similar to
information on activities that is maintained by all utilities. In the analysis framework, the information
is considered outside of the traditional reasons for capturing the data. Figure 1 shows the available input from
these databases that is considered in quantify, the risk of failure.
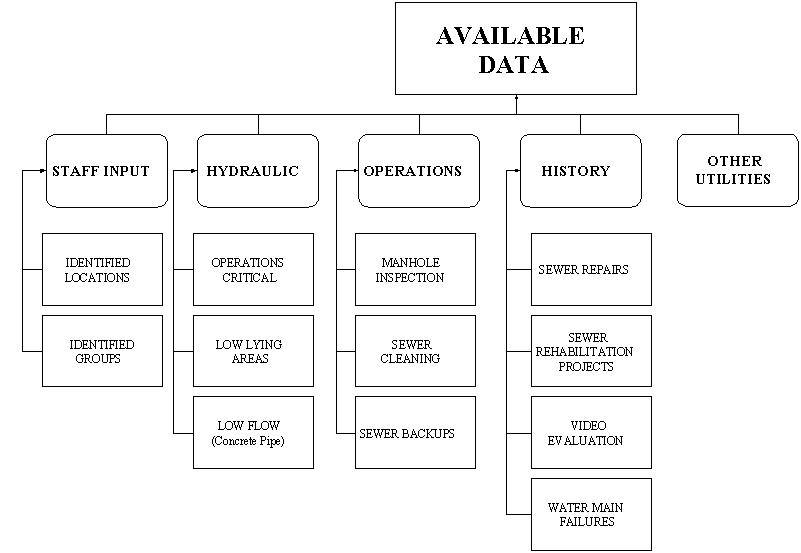
Figure 1: Available Input
for the City of Saskatoon
Information on soil
conditions and ground water represent additional data available in reports but
not in a computer database. This and
other types of information may be collected in the future if it is determined
that it would change a rehabilitation decision and that the decision would
result in a better economic or service delivery outcome.
Staff Input
Few if any data management
and analysis systems match the knowledge, experience and skills of the
staff. For this reason, input from the
staff is a very important source of information about the sewer system. Direct
and anecdotal information about the system greatly improves the understanding
of risk. Bringing that data into the
ArcGIS platform means that the information can be stored, analyzed, and quickly
reviewed within databases and a spatial environment.
In the City of Saskatoon,
the initial meeting began with a print of the sewer network and a box of
colored pencils. Staff was asked to
freely identify locations of concern where they felt that an inspection and
evaluation should be done to determine the sewer main condition and
rehabilitation. This “paper and
crayons” method identified fifty locations for consideration. The information
was transferred to ArcGIS and became the initial source of information. Staff
recommendations were intuitively based on risk. Figure 2 shows the staff identified locations in red.
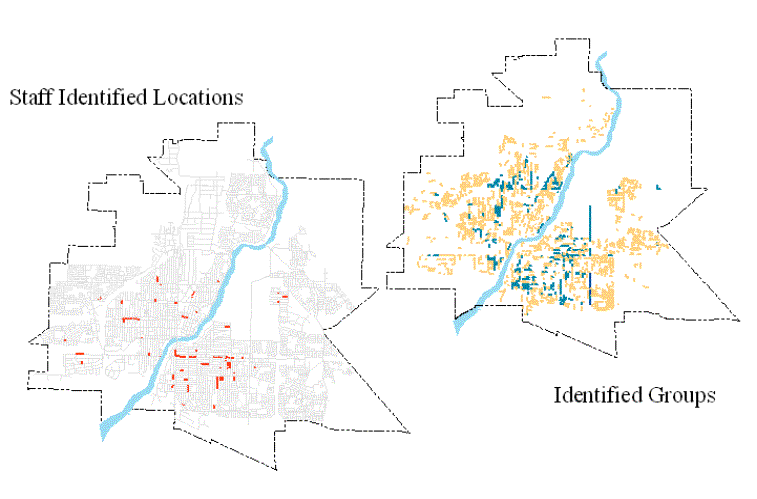
Figure 2: Staff Identified
Location and Identified Groups
From previous work and
discussions with staff, it became obvious that there were certain key
characteristics that lead to sewer failures (Sexsmith4). Figure 2
also illustrates Identified Groups of sewers that are more likely to have
structural defects and will likely have a higher probability of failure. These
include:
·
Clay
tile sewers greater than 5.5 m in depth (shown in orange).
·
Non-reinforced
concrete pipe (shown in green).
·
Concrete
sewers immediately downstream of force mains (shown in blue).
·
Major
food processing plants discharges to a concrete sewer (none shown).
Input from staff represents
an informal analysis of consequences of failure, as staff is well aware of the
outcomes of failures. They also consider the probability of failure by
identifying clues that suggest sewer deterioration as part of their daily
activities.
Hydraulic Input
Development of a hydraulic
model for the sewer network is a key step in determining the consequences of a
failure. At the time of this work, a
detailed hydraulic model was under development, but not available. Information
on the depth of flow is collected during manhole inspections, sewer-cleaning
activities and during video inspections.
This information, along with attribute data, is used to estimate
velocities and flows using Manning’s Equation.
In this study, the sanitary
sewer and storm sewer systems are separated.
However, a high percentage of buildings in the City have weeping tile
systems connected to the sanitary sewer system. Maximum flow occurs during intense rainfall events. The observed
height of flow is considered as the dry weather flow. The normal or dry weather flow is multiplied by a load factor to
estimate the expected maximum flows during rainfalls.
The information has a number
of uses in the selection process. These include:
·
Determining
the consequence of sewer collapse at key locations in the sewer network.
·
Identifying
sewer flows that exceed available emergency sewer pumping capacity.
·
Identifying
low velocities in concrete sewers, which leads todeterioration due to hydrogen
sulfide attack.
·
Defining
the threshold for sewers that can be lined without flow testing or a detailed
design review.
Operationally Critical
Sewers
The Water Research Council
(WRc5) defines specific sewers as “Hydraulically Critical,” based on
the amount of sewerage that the main carries.
The authors take a slightly different approach to the WRc definition by considering
sewers for which the utility currently does not have the ability or resources
to quickly divert sewage around a collapsed main. One option to costly sewer
rehabilitation is to develop operational procedures that utilize response
plans, sewer backup alarms, bypass pump equipment or alternative methods of
diverting flow around a sewer collapse. In a comprehensive Asset Management
Strategy for the sewer network, the ability to react to main failures can
greatly reduce the consequences of failures and may allow the utility to accept
a higher probability of failure.
Termed Operationally
Critical Sewers, these include major sewers with flows exceeding available
emergency pumping, force mains and around lift stations. It also includes
sewers that cross major roads and locations where a sewer backup would be
unacceptable including hospitals, level-care homes, and could include schools
and other public buildings. Figure 3 shows Operationally Critical Sewers based
on operations considerations. Segments indicated
in red exceed the current pump capacity of 3,000 gallons (US) per minute using
conventional pumping procedures. Sewers
that cross major roads are shown in brown, arterial roads in yellow, river
crossings in orange and force mains in green.
Sewers servicing hospitals are shown in blue.
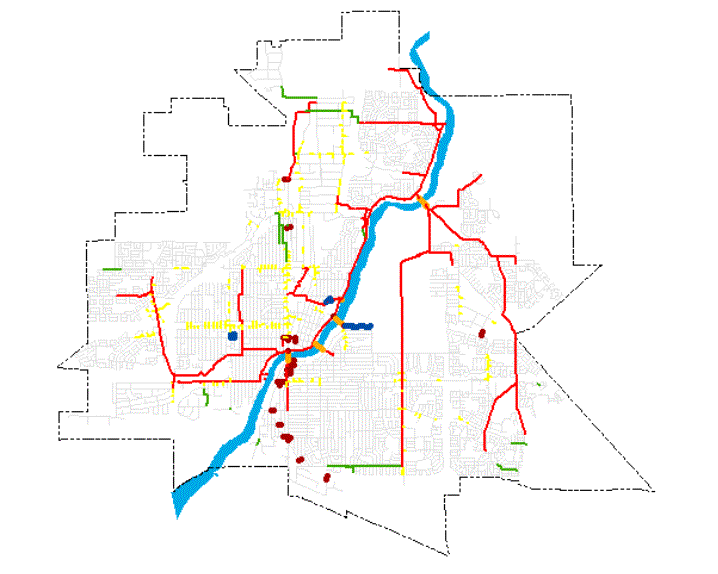
Figure 3: Operationally
Critical Sewers
Low Lying Areas
The outcomes of a sewer
collapse can be very different depending on the number of customers in low-lying
areas of a sewer catchment. Every utility has mains where customers’ basements
are near the crown of the sewer main.
On a main serving a large number of upstream consumers, little time is
available to react to a backup situation.
For these reasons, mains downstream of these locations pose a greater
consequence of failure. Figure 4 illustrates low-lying areas at risk for sewer
backups.

Figure 4: Critical
Locations-Low lying Areas
Low Velocities in Concrete
Sewers
Concrete sewer mains in
which the flow velocities are low are susceptible to hydrogen sulfide attack.
Figure 5 shows a portion of the Saskatoon sewer network. Concrete sewers with low velocities are
identified in red. Concrete sewers with low velocities are considered to have a
higher risk of structural failure.
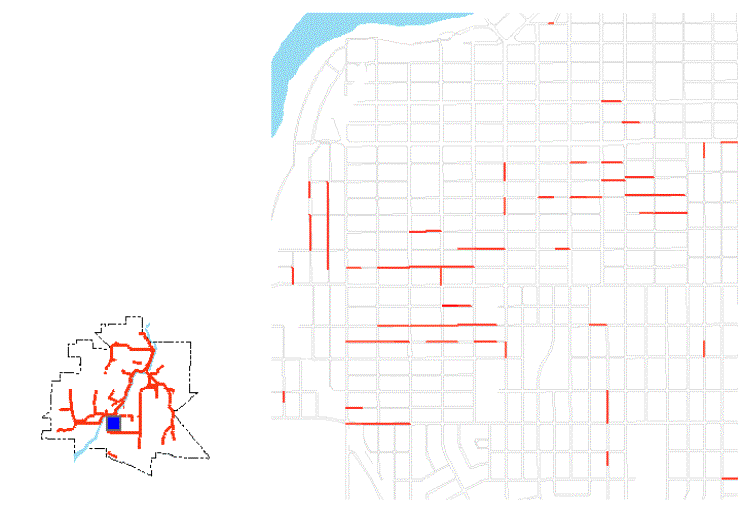
Figure 5: Estimated
Velocities for Concrete Pipe.
Operational Input
Operations input differs
from staff-identified locations in that information is collected during
inspection, cleaning and repair activities.
Relying on field observations rather than the memories of individuals,
locations are identified and documented within the spatial model.
Manhole Inspection and Sewer
Cleaning
Sewer cleaning is a major
activity in the City of Saskatoon’s sewer operations strategy. Sewers are
cleaned at frequencies varying from 6 months to 5 years. During cleaning, staff observes and
documents the materials removed from the sewer. Pieces of clay tile pipe, concrete debris, and bricks from
manholes are direct evidence of ongoing deterioration. It signals a change in the sewer condition
and an increased risk of failure in the sewer being cleaned or in an upstream
main.
At the time of this paper
approximately 30 percent of the system had been evaluated during cleaning and
the information documented in ArcGIS. Figure 6 shows the results to date. Red segments indicate that clay pipe pieces
were found in the segment during cleaning.
Blue segments indicate that gravel was removed during the process
indicating concrete pipe deterioration.
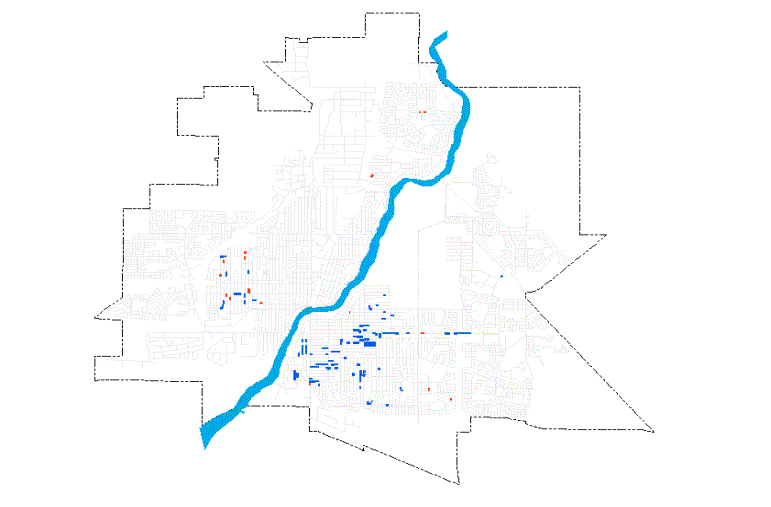
Figure 6: Sewer Cleaning
Triage
Information on tree roots,
grease and debris is also collected during the process using definitions
developed by staff.
Sewer Backups
Although not illustrated in
this work, locations where sewage backs up into homes and businesses represent
a significant cost to the utility in damage claims or to the community as high
insurance premiums. A similar analysis
should be carried out where the utility has documented this information in a
spatial model.
Historical Target Input
With the flexibility of the
ArcGIS platform, it is possible to look at a number of different factors.
Repairs and rehabilitation locations are considered given the characteristics
of the sewer main including age, depth, location, and pipe material. By
considering pipe characteristics, the factors that led to this work can be
evaluated and applied to other sewers in the network.
Sewer Repairs and
Rehabilitated Sewers
Sewer repairs are completed for
a number of technical reasons, but from a customer’s point of view it is to
minimize the risk of sewer backup. Repairs from 1995 to 2001 are illustrated in
Figure 7 as red lines. Also illustrated are the rehabilitation projects from
1982 to2001. Sewer lining projects are shown in green and sewer replacements in
blue.
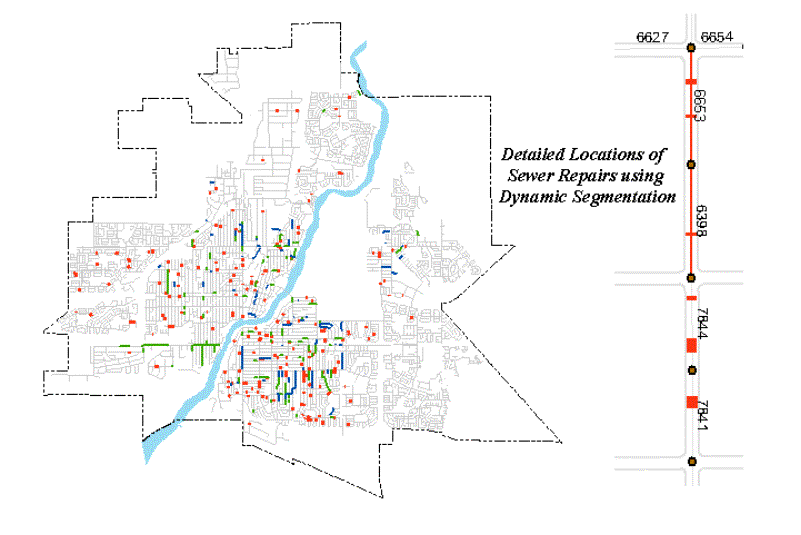
Figure 7: Sewer Repairs and
Rehabilitation Projects
Information on those
segments either repaired or rehabilitated represents locations with a higher
probability of failure. Those locations are considered in relationship to other
locations with the same characteristics.
The detail in Figure 7 illustrates the use of dynamic segmentation to
indicate not only the location of the repair but also the extent of the
repair. In this example, segment 6386
and 6653 are shown in red as locations initially identified by staff.
Video Inspection
In this case study, the City
has 80 km of main that were evaluated in the early 1990’s. Although the
evaluation method was different than the current methodology, the data can be
utilized to consider the timing of future inspections. Figure 8 illustrates locations in the
1990-92 studies. Because the information is 10 to 12 years old, it is divided
into groups and considered under broad definitions. Locations that were
identified as having few or no defects were considered as being in good
condition and are shown in blue. Sewers
in fair condition are shown in yellow and sewers that were observed in poor
condition are shown in red.
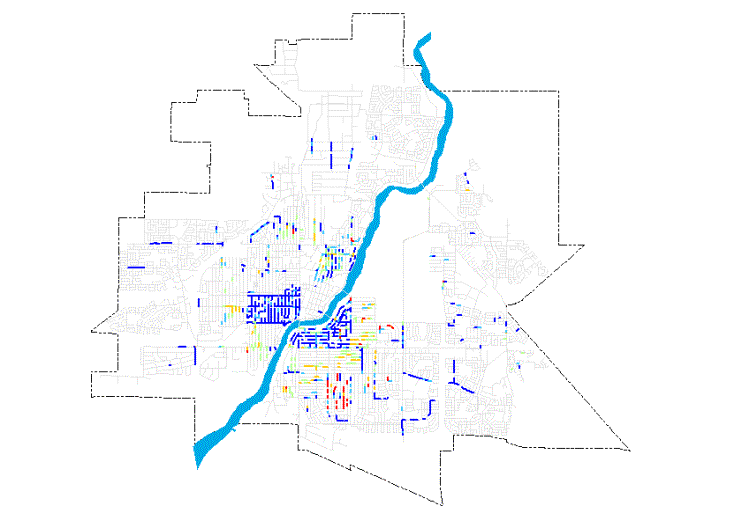
Figure 8: 1990-1993 Sewer
Video and Analysis
These locations are
considered in conjunction with mains that have been evaluated under the NAAPI
process in defining the risk of failure.
Unless repairs have been undertaken, it is reasonable to expect that
sewers that were in poor condition are deteriorating and have a higher
probability of failure than when inspected in the early 1990’s.
Water Main Failures
Sewer mains are influenced
by water main breaks. This
relationship is unique in that the metallic water main fittings fail due to
corrosion indicating a clay soil in the pipe zone. Clay soils tend to extend the life of clay tile sewers by
holding the fractured pipe in place.
This is in contrast to the effects that escaping water from a main break
has on the sewer. Infiltration under pressure and the washing of bedding
material into the sewer pipe accelerates deterioration.
Figure 9 illustrates the
location of water mains repairs 1990-2001in one neighbourhood. Because of the
different information sources breaks are illustrated in a variety of ways.
Since 1995, failures have been linked to the GIS numbers for each water main
segment. Failures from 1995-2001 are shown as blue lines coded with the number
of failures. Failures before 1995 were recorded by civic address. These are
shown as blue dots against each site. In this example, service clamps were
installed on nonmetallic pipe. Clamps
were either replaced under emergency repairs and are shown in purple, or as
part of a replacement program shown in green.
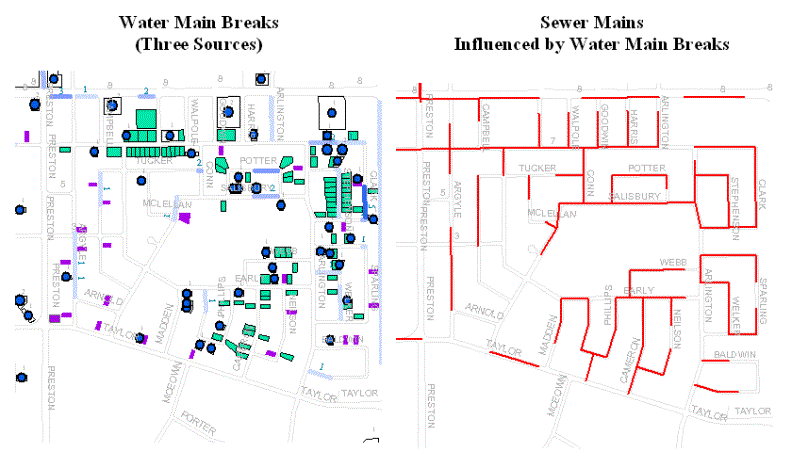
Figure 9: Water main failures
1990-2001 and Sewers influenced by Water Main Failures
Using the Selection by
Location in ArcMap, the sewer mains influenced by the water main failures are
also illustrated in Figure 9.
Other Utilities Input
Other utilities in the
right-of–way will influence rehabilitation decisions. Where a number of utilities will conflict with the excavation of
a sewer main for the purposes of either repair or replacement, the utility
should consider lining all or part of the main before the sewer deteriorates to
the point where lining is not an option.
Where other utilities approach their threshold for rehabilitation, a
joint or combined replacement is considered depending on the location of underground
utilities within the right-of-way (Higgins, Gustafson, Clancy6).
SELECTING VIDEO INSPECTION CANDIDATES
Based on the analysis of
available information, the utility will decide to undertake video inspection
based on their understanding of the risk.
In reviewing the available input, the following general statements were
used in defining video inspect for the Saskatoon case study.
1.
Staff
input is the first consideration in video inspection decisions as staff is
keenly aware of the consequences of failure and can effectively consider the probability
of failure.
2.
Direct
information from manhole inspections, sewer cleaning, past videos, sewer
backups, repairs and rehabilitation provides evidence of sewer main condition
and the probability of failure.
3.
The
ability of the utility to react to failure at any point in the network is a key
consideration in the consequence of failure in the system. The flow in the sewer, the utility’s
response capabilities, the proximity of basement elevations to the sewer and the
number of upstream users are considered in the consequence of failure.
4.
Joint
projects are a good economic decision when the water and sewer mains are at the
same elevation and one or both are close to meeting the threshold for
rehabilitation. Where the sewer is
substantially deeper than the water main, the economics of trenchless
rehabilitation of the sewer and replacement of the water main could be a good
decision. The thresholds for inspection
include consideration of the proximity of the sewer to other utilities and the
condition of the utilities and road treatments.
5.
The
probability of failure for clay tile pipe considers staff identified locations
and operations identified locations.
Previous repairs and rehabilitation, past video inspection, surcharge in
the sewer and water main failures in proximity to the sewer are also considered
in determining the threshold.
6.
In
considering the probability of failure of concrete pipe, staff identified
locations and operations identified locations, previous repairs and
rehabilitation, and past video inspection are also considered but in this case
concrete sewer with low velocities is a contributing factor.
Within this analytical
framework, a significant amount of information can be accessed within ArcGIS in
the decision process to choose video inspection candidates. Because the probability of failure is
difficult to estimate in a sewer system, the benefits of understanding the risk
of failure become an important factor in balancing risk and costs in keeping
with community’s values.
SEWER CONDITION EVALUATION
With video inspection
completed on the identified segments, the next step is to evaluate the video
and determine the need for rehabilitation using the NAAPI evaluation process.
This process was developed to allow utility owners to obtain all information
about a sewer main assuming that it has never been inspected and in some cases
cleaned. It allows for a numeric
representation of the structural and operational sewer condition. Information is collected within accepted and
documented definitions and stored as either spot defects or as continuous
defects.
Defects are entered into an
Access database and can be displayed in tables or graphically. The NAAPI
sub-segment score is illustrated in Figure 10.
The Access program allows for the accumulation of defects scores in
1-metre increments along the segment. Some of the coding within the NAAPI
process is not related to the structure of the pipe segment (Jennings7).
These are shown as negatives in Figure 10.
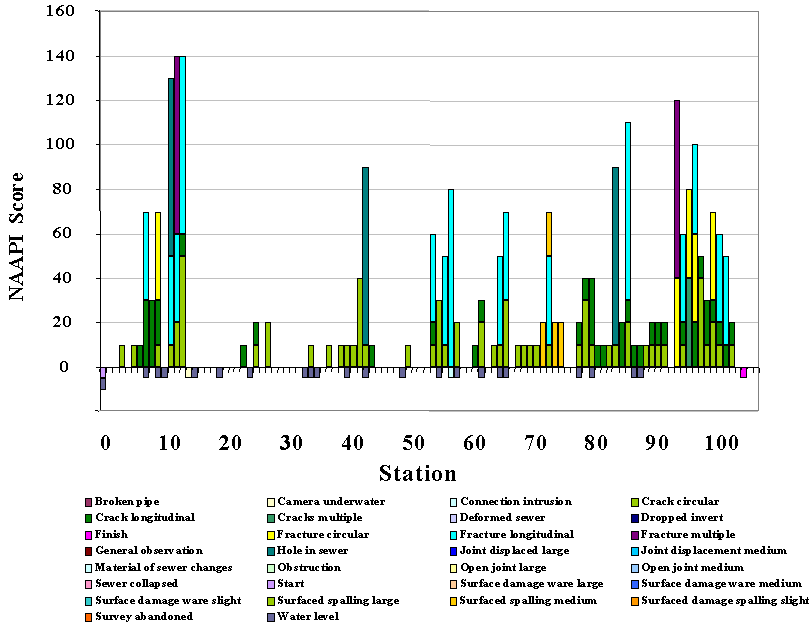
Figure 10: Access Graph of
Defects Identified Using the NAAPI Process.
This information can be
shown in ArcGIS using dynamic segmentation and route event tables generated
from Access. Examples of route events are entered as points as illustrated in
Table 3, or as lines in Table 4.
Table 2: Route Event Table
for Continuous Defects
|
GIS Number |
From Station |
To Station |
NAAPI Defect Code |
NAAPI Defect Weighting |
|
82 |
81 |
78 |
CL |
10 |
|
82 |
88 |
85 |
CL |
10 |
|
82 |
92 |
90 |
CL |
10 |
|
82 |
9 |
7 |
CL |
10 |
Table 3: Route Event Table
For Point Defects
|
GIS Number |
From Station |
|
NAAPI Defect Code |
NAAPI Defect Weighting |
|
82 |
3 |
|
CC |
10 |
|
82 |
5 |
|
CC |
10 |
|
82 |
6 |
|
CL |
10 |
|
82 |
7 |
|
CL |
10 |
|
CONTINUED |
||||
Using the Route Editor in
ArcMap, a route is identified by combining one or more segments and defining a
start point and end point. In
development of this model the upstream manhole is the starting point and the down
stream is the endpoint with the route being equal to the length of the main
between manholes. This convention was
chosen based on the standard procedures for video inspection and allows for
spatial representation of defects.
Using the data from the
above tables and the Tools Add Route Events procedure in ArcMap, the defects are entered as
elements on the sewer main and illustrated in Figure 11.
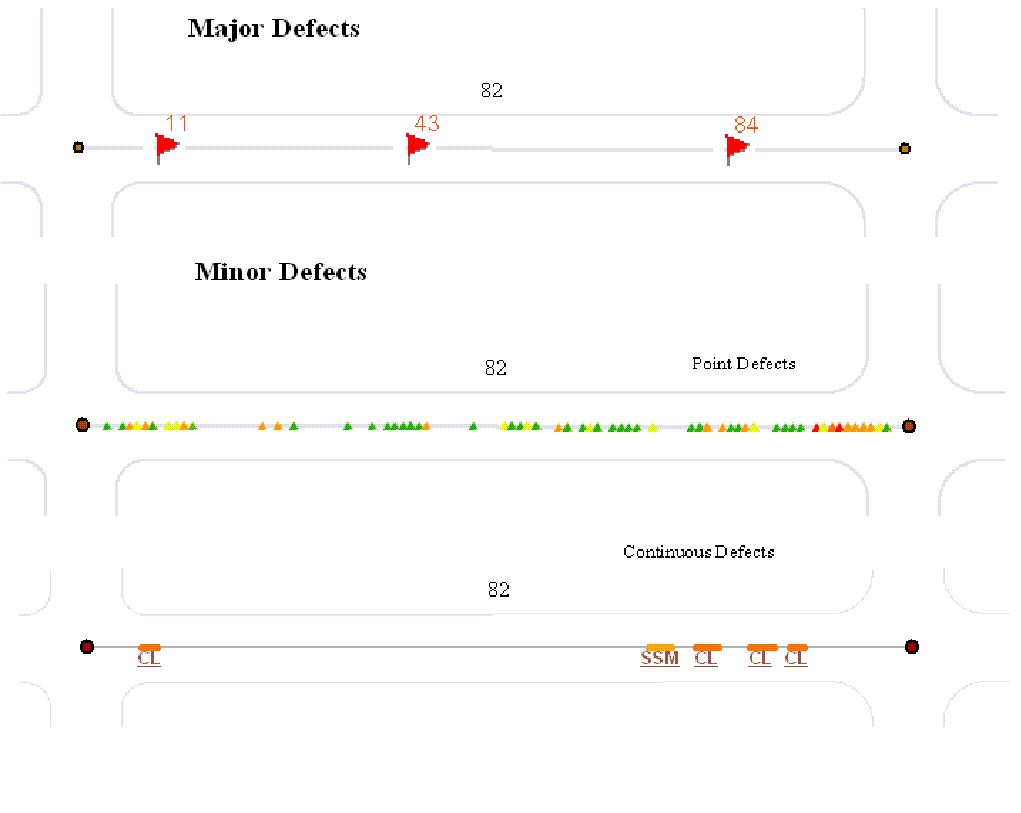
Figure 11: Major Defects, Minor Point Defects and
Continuous Defects in ArcMap.
Major defects are evaluated
as possible spot excavated repairs and shown separately as major defects. Minor defects are shown as either point or
line information and are shown separately in Figure 11.
With the defects entered in
the spatial model and quantified using the NAAPI scoring process, an analysis
is carried out to determine alternative treatment strategies on a sub-segment
level.
Thresholds for Rehabilitation
In the conventional NAAPI
evaluation, soil conditions and surcharge are considered for each segment and
the segment is classified with a grade 1 through 5 based on a need to consider
rehabilitation. The results are
forwarded to the client and a determination of treatment is left to the utility
owner or an engineering consultant. In this work, thresholds are defined in determining
when a utility will initiate a treatment. The following general statements
reflect selection of treatments for the City of Saskatoon:
1.
Emergency
repairs are undertaken to maintain service or ensure service where the risk
and/or consequences of failure are deemed to exceed the cost of repair or
represent an unacceptable risk to the public.
2.
In
a non-emergency situation, lining will be considered unless the outcome of
lining could result in future backups or the severity of the defect will not
permit conventional lining. Where
concrete pipe is cracking or has exposed reinforcing steel, the main will be
considered for immediate lining.
3.
Where
lining is reasonable, consideration will be given to spot lining, blind lining
and then full lining based on the cost-benefits. Under normal circumstances, spot lining will be used to
rehabilitate clay tile sewers. Because
of the cause and uniformity of deterioration due to hydrogen sulfide attack,
full lining will be utilized in rehabilitating concrete pipe.
4.
Where
the costs of repair are significant and other utilities are under consideration
for rehabilitation, spot repairs (Band-Aid) will be considered as a short-term
solution.
5.
Where
a location cannot be lined, excavated repairs will only be undertaken on that
portion required to permit lining.
6.
Where
necessary, a combination of lining and spot repairs will be considered to
minimize the cost.
7.
Only
when full replacement is the most economical solution should the main be
replaced. This will invariably occur
where the water main is failing and can be economically replaced. It may also be necessary where the sewer
main needs to be upsized to meet existing or future demands or where the
deformity of the sewer will not permit lining.
8.
Prioritization
of rehabilitation candidates will consider the possible outcomes in deferring
rehabilitation particularly where other utilities or surface assets, soil
conditions, bypass pumping requirements, detouring and other factors that could
greatly increase the costs of emergency repairs.
Within the scope of this
work, spot lining is not only considered as a long-term solution to a
deteriorated pipe, it is also considered as a short-term or band-aid
solution. The authors suggest that,
within the goal of minimizing long-term economic cost, it may be more
cost-effective to spot line severely deteriorated segments of a main to
minimize the possibility of collapse and defer the capital cost of lining or
replacing the entire sewer main. This has particular advantages where other
utilities or surface assets are close to rehabilitation and the opportunity
exists to defer treatment in order to optimize rehabilitation across assets
within the right-of-way.
The thresholds can also be
applied independently to each segment.
This allows for consideration of sewer characteristics, flow, soil
condition, ground water, the proximity to other utilities and street
classification in determining thresholds.
By considering ranges of
thresholds, a utility considers not only what would be rehabilitated on a
segment but also what would be left after rehabilitation. In effect, by setting lower or higher
thresholds for different segments, the utility is estimating the probability of
future failures. Using the NAAPI defect descriptions, the decision can be
considered in terms of what defects would be left if the main were not fully
rehabilitated in a given set of circumstances.
Where a utility has a
limited rehabilitation budget, setting a high threshold defines locations with
the highest risk of failure for considering spot treatments. In Figure 12, a threshold of 100 points is
applied to segment 82. The threshold would
result in treatments being undertaken at four locations along the pipe.
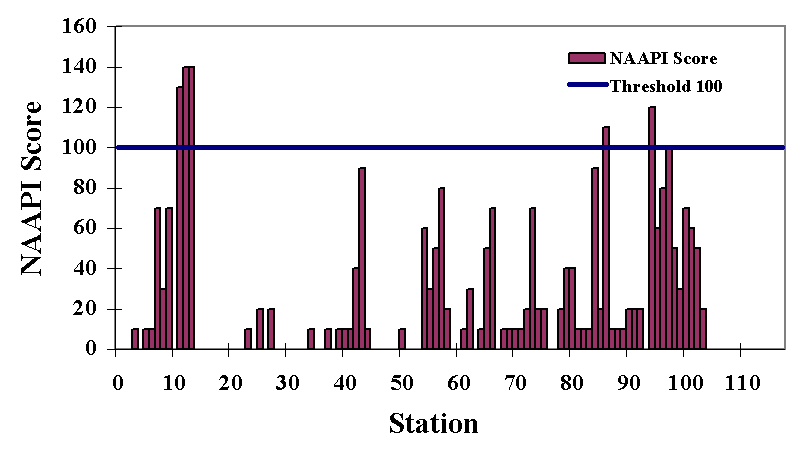
Figure 12
Threshold for Rehabilitation
Extent of Rehabilitation
The other consideration in
sewer rehabilitation is the extent of a treatment. In modeling the alternatives
for treatment, the authors utilize cost models that consider a fixed cost plus
variable cost for each treatment based on past work. In estimating the
cost-benefit for each treatment, the cost is evaluated based on the number of
NAAPI points that would be eliminated per $1000 of rehabilitation
spending. In the case of spot lining,
the extent of the repair varies from 1 m. to 10 m. For blind lining, the
repairs are considered from either end of the sewer segment for the full length
of the pipe. Similarly, excavated
repairs are from 3 m to the full length of the pipe. Table 4 illustrates the method for determining the optimum extent
of a repair. In this example, a spot repair from station 11 to 13 would result
in the maximum NAAPI points per $1000 being eliminated.
Table 4: Optimization of Treatment Based on Points
per $1,000
Length |
Points |
Point/$1000 |
From |
To |
|
1 |
140 |
46.7 |
12 |
12 |
|
2 |
270 |
72.7 |
11 |
12 |
|
280 |
75.3 |
12 |
13 |
|
|
3 |
270 |
60.3 |
10 |
12 |
|
410 |
91.6 |
11 |
13 |
|
|
280 |
62.6 |
12 |
14 |
|
|
|
||||
|
10 |
280 |
34.7 |
12 |
21 |
In each case all possibilities
are considered and the selected repair strategy or combination of strategies is
determined that will optimize the number of points that are eliminated per
$1,000. Figure 13 illustrates the remaining sub-segments scores that would
remain if the threshold were set at 100 for segment 82.
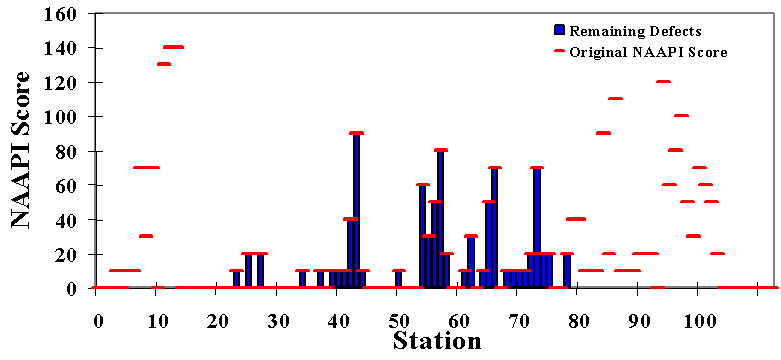
Figure 13: Remaining defects
based on Threshold of 100
Treatment Strategy Selection
In considering a segment,
spot excavations are undertaken at locations where the main has deformed or collapsed
or where the conditions would require an excavation and repair before lining
due to holes, broken pipe or offset joints.
In Figure 11 Major Defects, three holes are identified at 11, 43 and 83
m from the upstream manhole. If these defects would not permit lining, an
excavation would be undertaken to make the necessary repairs. The extent of the
excavation would depend on a cost benefit review based on the number of NAAPI
points per $1,000 with a minimum repair length of 3 m. Where these repairs are undertaken, the
analysis of the lining strategy is considered based on the elimination of the
defects at these locations.
Different thresholds and the
treatment options are shown in ArcGIS using dynamic segmentation. Figure 14
illustrates the different possibilities for segment 82 for various thresholds
that the utility may wish to consider.
In this example the major defects were linable.
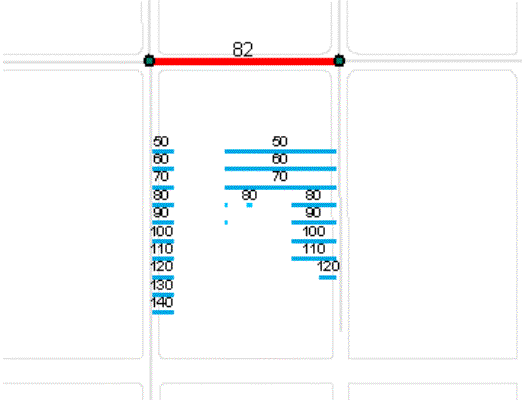
Figure 14: Options for Treatment In ArcGIS
The development of this
process means that an Asset Preservation Plan can be defined for each segment
that has been evaluated. Where multi-block segments have been identified as
meeting their rehabilitation threshold that analysis can be repeated for the
entire length and alternative asset action plans can be considered based on
undertaking a larger rehabilitation project.
Annual Program and Backlog
For those segments now
evaluated, it is possible to determine an estimated cost to repair all defects
for a given threshold. Figure 15 shows the estimated cost of rehabilitation of
27 segments in the initial database. In this example all thresholds are
illustrated to provide a means of comparing the cost to the selected
threshold. It is also possible to
assign independent thresholds for each segment and determine the annual
funding.
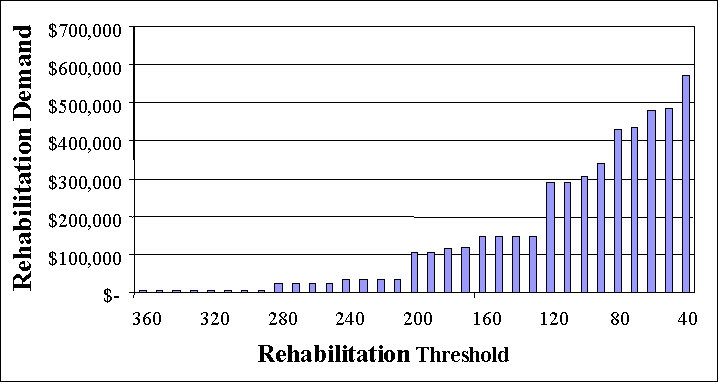
Figure 15: Budget Demand
Versus Threshold
The funding demand is
evaluated against the available funding and a backlog is identified where
demand exceeds the budget. Where
backlog is identified, projects are considered in light of the economics and
consequences of failure identified during video inspection and the NAAPI Scores
to evaluate the probability of failure. This prioritization is used to define
the annual program and those candidates deferred to next or subsequent annual
program.
Staff Review and Process Improvement
A review of thresholds is
carried out as new information is identified and added to the sewer network
knowledge. With the first cycle complete and an annual program generated, a
review is undertaken to consider the findings and fine-tune the process. Staff reviews thresholds annually at the end
of the construction season. With this
review complete, the process is repeated in determining sewers for video
inspection and rehabilitation.
The initial program was
based largely on staff input regarding locations that need to be considered for
video inspection and evaluation. Staff identified a number of locations where
the results of the NAAPI score was between 500 and 19,000. By comparison the NAAPI process recommends
serious consideration of locations that score above 165, suggesting that staff
have a good understanding of sewers in poor condition.
Ideally, the analytical
framework would generate a rehabilitation strategy that would minimize the
long-term costs. The difficulty in
defining the probability of failure means that utilities must balance the risk
and costs in providing sewer service.
Improving understanding of risk of failure and the community’s values
will allow the utilities to refine thresholds that reflect customer’s
acceptance of the risk of sewer backup and their willingness to pay for their
sewer service.
CONCLUSION
This analysis framework is
highly dependent on data from a variety of sources. ArcGIS facilitates the integration of available data into a
spatial environment and provides the tools required to analyze the risk of
sewer failures in determining camera inspection priorities and rehabilitation
strategies.
REFERENCES:
Clancy,
D.V., Gustafson, J-M; Forecasting Outcomes Versus Costs In The Repair And
Replacement Of Cast Iron Water Mains Proc. 2000 AWWA Infrastructure Conference,
Baltimore (2000)
Canderbank,
Ron; North American Association of Pipeline Inspectors, CCTV Certification
and Reviews Course, Surrey, B.C, Canada,
UK
Water Industry Engineering and Operation Committee; Manual of Sewer
Condition Classification, Third Edition, 1993 (Amended February 1996)
Sexmith,
W.C.; Setting Rehabilitation Priorities For Sanitary Sewers In The City Of
Saskatoon, Master’s Degree Project, University of Saskatchewan, 1997.
WRc;
Sewerage Rehabilitation Manual, Second Edition, Water Research Centre,
Swindon England, 1986
Higgins, L, Gustafson, J-M.
& Clancy, D.V.; Integrated Infrastructure Management Decision-Making
Using ArcGIS, Proc. 2002
Esri Conference San Diego CA. (2002).
Jennings, Roger; Special Edition Using Microsoft Access 2000, Que Corporation, Indianapolis, IN, 1999.