Jim Banta, Evelyn Trevino and Kelly Cross
For various reasons, county agencies place children and adolescents in group homes. Costs and capacity are issues, with costs for the most behaviorally difficult youth surpassing $4,000 per month per child. More than 90 group homes exist in San Bernardino, receiving referrals from the County's Probation, Children's Services and Behavioral Health Departments and agencies from other counties. ArcView GIS is used to depict this residential care system, including the volume and description of clients. Social indicators are also examined, comparing geographical areas where group homes are located to the rest of the county.
In most service industries, there is a desire to be located in such a way as to be convenient to consumers and potential consumers. Indeed, one value of geographic information systems (GIS) is the ability to combine various socio-economic data to suggest the best sites to place a business. Within local governments, there is a desire to examine socio-economic data even though there may be restrictions on where facilities can be placed. For a variety of economic, political, organizational and legal reasons, government facilities may not always be located where there is the greatest need.
An example of local government GIS analysis by staff from several different health/social service departments was presented at the first Esri International Health GIS conference (Banta, et al. 2001). That paper documented efforts by staff within a Human Services System to combine various data sources at the zip code level in order to determine potential areas of greatest need for young children within the southern Californian county of 1.7 million residents. A multiple determinants of health model provided the framework for that analysis. Although it has been demonstrated in a study of SES among children that small area data by itself may not have a strong relationship to individuals living within that area (Demissie, et al, 2000), many times the summary data is all that is available.
The same group of analysts has applied a similar methodology for a study of group homes, which are one component of the child "system of care" within a county. Thus, public health data/issues are considered even though that department is not directly involved with group homes. However, earlier study suggests that many, perhaps even a majority, of youth in group homes have sort of disability (Schonberg, 1979).
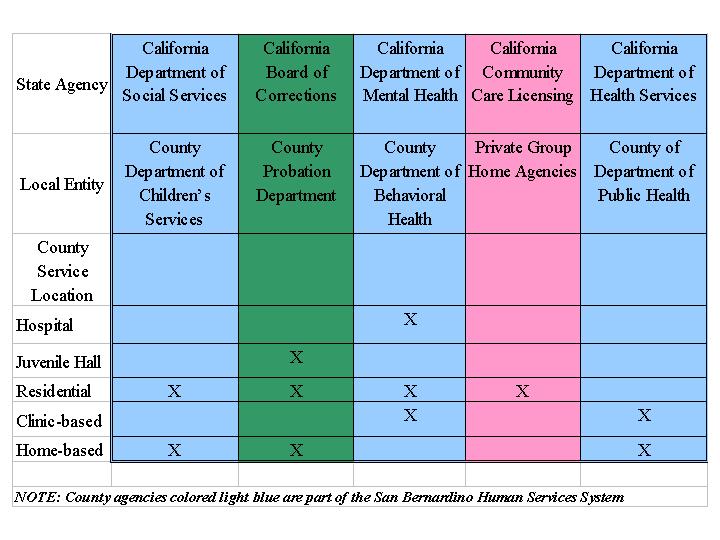
Within California, there are three levels of foster care: kinship care, foster family and group homes. Children and youth may be placed in group homes if their initial home is considered to be unsafe (Children Services), because of behavioral/criminal issues (Probation), and emotional/behavioral issues (Behavioral Health). As seen in figure 1 below, a number of county agencies are involved in providing children's services, each with its own funding streams and reporting hierarchy. The organizational / legal separation of providers has led to difficulties in providing a coherent treatment system for children, especially those with a need for mental health services (Little Hoover Commission, 2001).
Figure 1: Overview of organizations

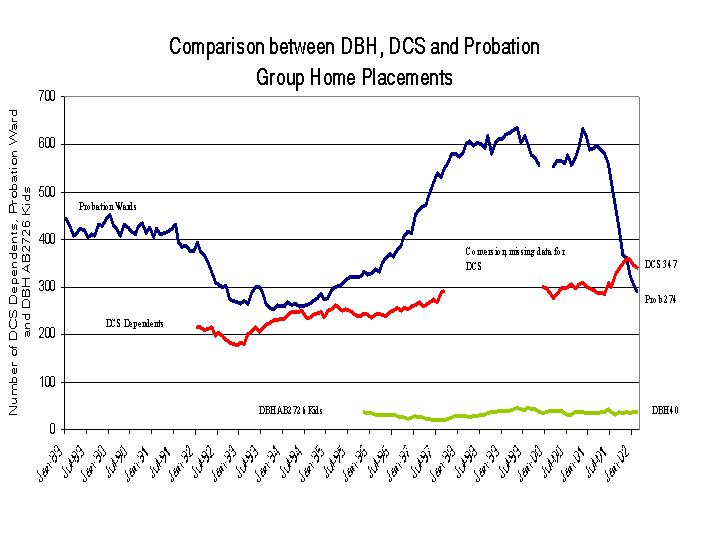
The number of children in group home placement varies by placing agency. As seen in figure 2, the Probation Department has placed between 270 and 640 youth per month in group homes during the last 14 years. The Department of Children Services has placed between 190 and 350 youth per month during the last 11 years. The Department of Behavioral Health has had approximately 40 youth in placement since 1996. Although very few of the children/youth in placement receive mental health services, it has been estimated that at least half of the children in foster care would benefit from such services (Skrabow, 1997).
Figure 2: Group Home Placements by Agency
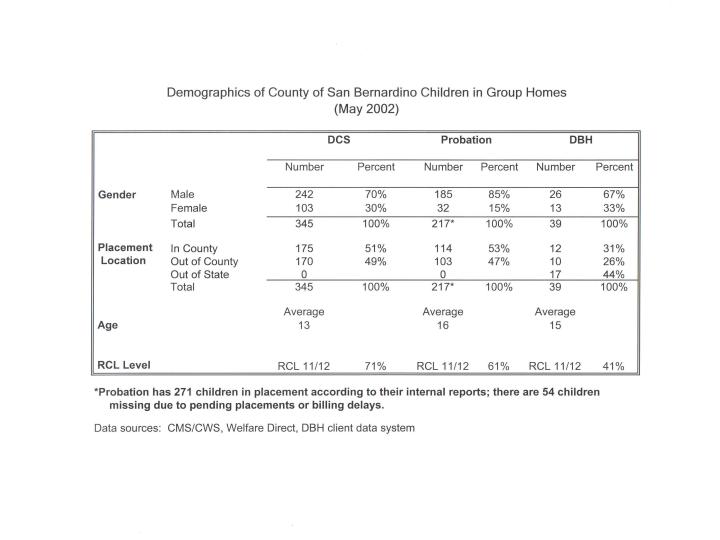
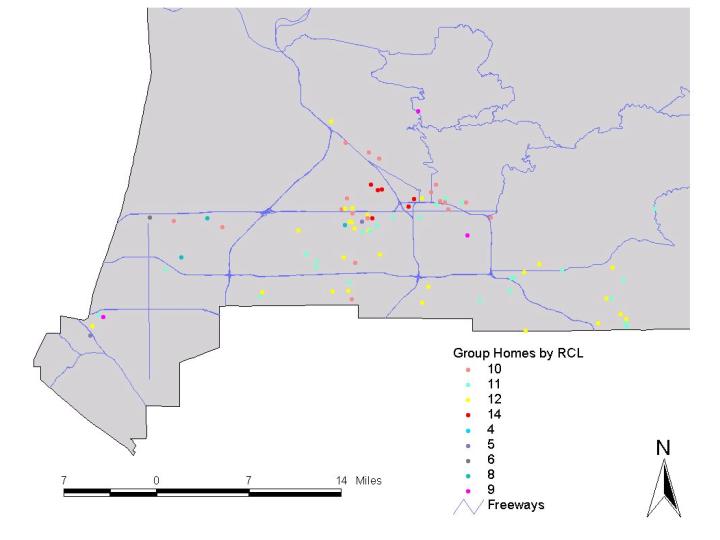
As a result of different data systems used by DCS, Probation and DBH, it is difficult to obtain complete demographic data for each group home. However, summary data is available, as seen in figure 3. The majority of youth in group home placement are males. At most, half of the San Bernardino youth in placement are located within the county, while the rest are in group homes in other California counties or even out of state. DCS children are the youngest on average (13 years old), while those placed by DBH and Probation are a bit older (15 and 16 years old, respectively). Also note that the majority of DCS and Probation youth are placed in group homes having a Rate Classification Level (RCL) of 11 or 12. The RCL determines how much money a group home receives per child per month, with RCL 14 being the highest level. The RCL does not indicate the type of program(s) provided or the type of clients accepted, for example, pregnant/parenting teems, fire setters, substance abuse, sexual aggression/predators, etc.
Figure 3: Client Demographics
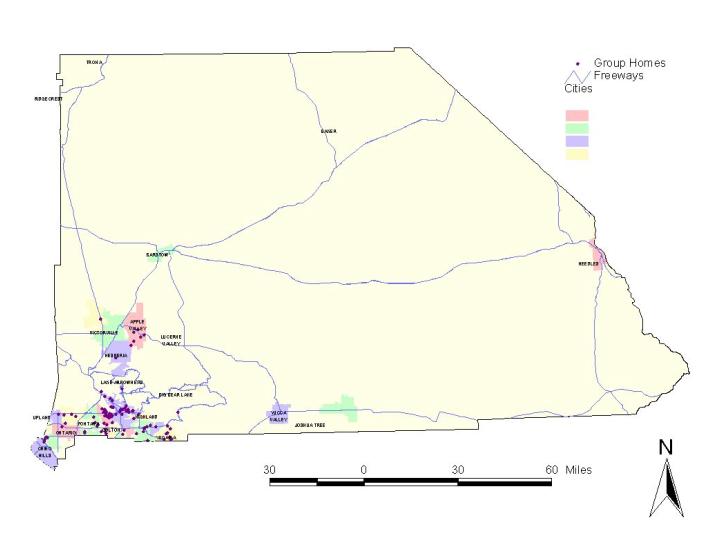
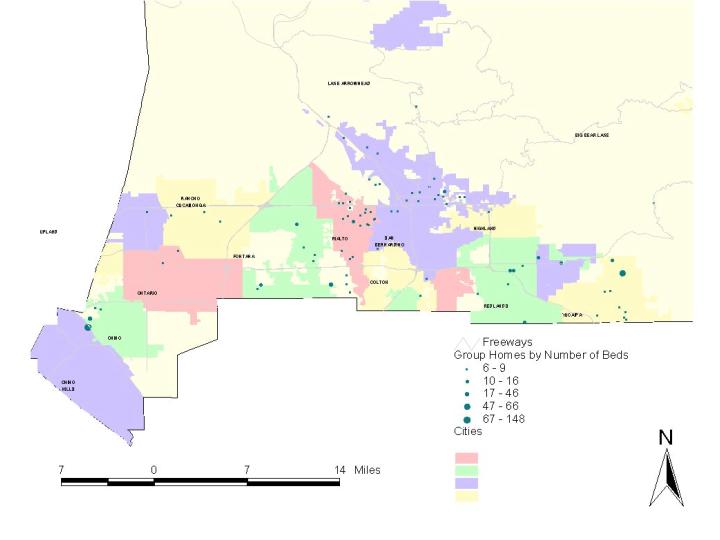
As can be inferred from the map in figure 4, much of San Bernardino County is sparsely populated, with much of the area consisting of desert. Much of the desert land is controlled by the federal and state government. More than two thirds of the population resides in the southeastern corner or valley region of the county. Not surprisingly, that is also where most of the group homes are located. However a few group homes are also located in what is referred to as the "high desert" cities of Victorville/Hesperia/Apple Valley. The remaining maps focus on the valley corner of the county. Within the valley, one can see that the largest cluster of group homes is within the cities of San Bernardino and Rialto, with a smaller cluster occurring in the cities of Redlands/Yucaipa.
Figure 4: Location of group homes in San Bernardino County
As can be clearly seen in figure 5, the majority of group homes are small, comprised of six to nine beds. There are only a few group homes which have more than 50 beds.
Figure 5: Size of group homes in the valley region of San Bernardino County
The rate classification level map in figure 6 shows that the geographic distribution of different RCL levels is fairly random throughout the valley, with the exception being that ALL of the RCL 14 homes are located in or around the northern part of San Bernardino City.
Figure 6: Group homes by RCL level
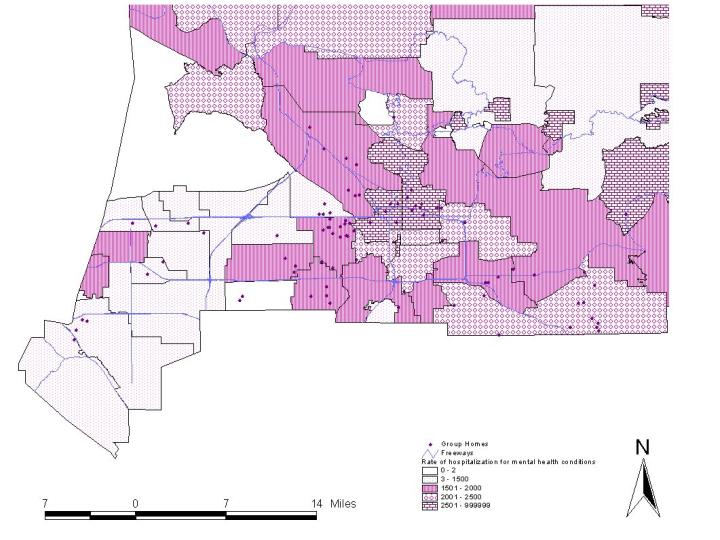
Since many children in group homes would likely benefit from mental health services, it was decided to display mental health data in relation to group homes. One way of doing this is to examine psychiatric inpatient admissions for youth as measured by the California Office of Statewide Health Planning and Development (OSHPD), depending on the zip code of residence prior to admission. Age adjusted rates (using Census 2000 data) are shown in figure 7. One can see that most group homes are located in areas with relatively high psychiatric inpatient admission rates. However, one can not tell whether that reflects greater mental "need" in those areas, simply reflects the fact that psychiatric hospitals are located in those areas with the highest rates, or perhaps the higher rates are caused by children from the group homes.
Figure 7: Mental health inpatient admissions among youth, OSHPD
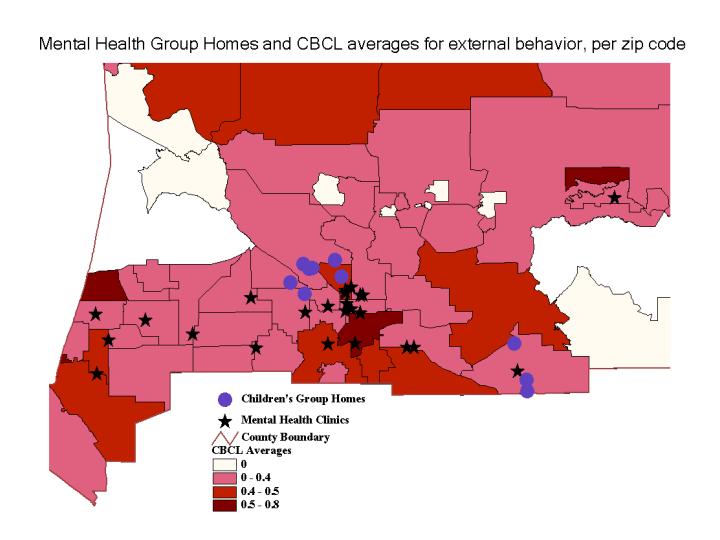
Another approach to mental health is to look at the children receiving services from the Department of Behavioral Health. Figure 8 shows average values by zip code of Child Behavior Checklist (CBCL) scores. The CBCL is a validated self-report instrument that the California Department of Mental Health required counties to administer between 1998 and 2002. The map was constructed by taking the "t score" for the "Behavior-Other" scale, which in turn is composed of delinquency and violence to other subscales. A t-score greater than 70 is considered clinical (Department of Mental Health, 2001). The CBCL and a few other instruments were used to compare youth in South Carolina. That study found that clinically, there was little difference between the youth treated by the mental health system and by youth institutionalized by the juvenile justice system (Pumariega, et al. 1999).
Since some clients completed the survey more than once, the average scores of more than 4,000 clients was obtained. Finally, data was summarized by the most current zip code known for those clients. If a zip code had fewer than five clients, the data was deleted. The remaining zip codes had data for 5 to 492 clients. Also shown in figure 8 are the locations of mental health clinics. One can see that the group homes are not located in areas where DBH clients have self-reported the most severe external behavior. One problem with this data though is the voluntary nature of the data.
Figure 8: Mental health residential system in the valley region of San Bernardino County
A final comparison was made with sexually transmitted disease rates, primarily gonorrhea and chlamydia. One might expect that an area with high rates would be populated with a significant number of youth engaged in risky sexual behavior. Often, those involved in such behavior have been the victim of sexual abuse, which may be a basis for DCS placement or lead to emotional/behavioral problems resulting in need for mental health treatment or involvement with the probation system. However, as seen in figure 9, there does not appear to be a relationship between areas of high rates for sexual disease and group home sites.
Figure 9: Sexually transmitted disease rates among youth
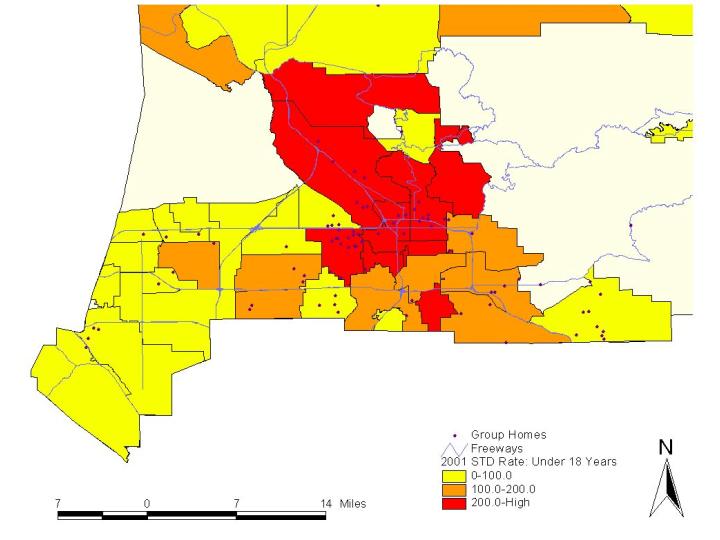
Since different agencies are involved in assessing and placing children in the available homes, it is not clear that a traditional needs assessment approach is useful. This is especially true since group homes do not have to be located in areas of high need in order to serve its residents (particularly since some agencies may want to place a kid AWAY from his home environment).
Given the organizational and financial arrangements surrounding children's residential care - with multiple county and state agencies involved as well as group home agencies who contract with each of the county departments - it is questionable whether a GIS system could be developed that could be used on a daily, routine basis in order to assist the placement process.
However, GIS could be used to examine overall capacity, relative to need, within a region comprised of multiple counties. In fact, the Little Hoover Commission (page 32) explicitly called for such a regional approach, as well as placing group homes such that children and families can be adequately served. In addition, to identifying areas of high need, in which children may have a greater need for residential care, the county human service system could target prevention and outpatient treatment services in those areas in an attempt to reduce the need for out-of-home placement.
Special thanks to Noelle Hartwick, Joe Lick, and Disep Obuge; analysts within the Public Health Department who prepared data and produced some of the maps used in this report. Thanks also to Jason Babiera and Yvonne Armstrong; analysts within the Behavioral Health Department, for their contribution to preliminary discussions of this paper.
Banta, Jim, Colin Bailey, Noelle Hartwick, Kelly McAuley and Evelyn Trevino. Using ArcView and a theory to assess the need of pre-school children in San Bernardino County. Esri International Health GIS Conference, 2001. http://www.Esri.com/library/userconf/health01/papers/hc01_p03b/hc01_p03b.html
Demissie K, Hanley JA, Menzies D, Joseph L, Ernst P. Agreement in Measuring Socio-Economic Status: Area-based Versus Individual Measures. Chronic Diseases in Canada 2000;21(1).
Department of Mental Health: Sacramento, California. Children & Youth Performance Outcome Measurement - Clinical Training Manual. 2001. http://www.dmh.cahwnet.gov/rpod/PDF/Child-Training-Manual.pdf
Little Hoover Commission: Sacramento, California. Young Hearts & Minds: Making a Commitment to Children's Mental Health, October 2001. http://www.lhc.ca.gov/lhcdir/report161.html
Pumariega, Andres J., Lanette D. Atkins, Kenneth Rogers,Larry Montgomery,Cheryl Nybro, Robert Caesar, Donald Millus. Mental health and incarcerated youth. II: Service utilization. Journal of Child & Family Studies. 1999; June 8 (2):205-215.
Schonberk, SK. Health needs of the adolescent. Paediatrician. 1979; Suppl. 1:131-40.
Scrabo, Kathie P., Planning Services for the Foster Youth Population in Mental Health Medi-Cal Consolidation. Report to the Mental Health Policy Work Group, July 1997.
Jim Banta
Managed Care Research Analyst
County of San Bernardino, Dept. of Behavioral Health
Evelyn Trevino
Statistical Methods Analyst
County of San Bernardino, Dept. of Public Health
Kelly Cross-McAuley
Statistical Methods Analyst
County of San Bernardino, Human Services System, Legislation and Research Unit