Paula Fischl, Wesley Geloneck, Douglas Munch
This study is part of an assessment of water supply needs and sources in which the St. Johns River Water Management District (SJRWMD) has been required to identify areas expected to have inadequate water resources to meet the water supply demand in the year 2010. SJRWMD conducted this assessment using seven regional numerical MODFLOW ground water flow models and several local analytical ground water flow models. Two of the most important aspects of the ground water evaluation were (1) the projection of the 2010 potentiometric surface of the Floridan aquifer and (2) the change in the potentiometric surface of the Floridan aquifer between 2010 and the current hydrologic condition. A GIS approach was selected to synthesize the results of the various analyses. The numerical and analytical ground water flow models were run to produce a data set of hydraulic heads. A data set in excess of 800 water level monitoring well points was used as the base and quality control for the study. A monitoring well coverage with 1988 water levels was processed using the ArcInfo triangulated irregular network (TIN) module, then contoured to generate a 1988 potentiometric surface map of the Floridan aquifer. The grid and resultant hydraulic head values for each grid cell of the numerical models were imported into GIS format. Control well points were matched against model grid cells to select hydraulic head values for the year 2010 to be contoured. Using the algebraic function in the GRID module of ArcInfo, the 2010 surface was subtracted from the 1988 surface to generate a surface representing the projected change in the potentiometric surface of the Floridan aquifer between 1988 and 2010.
The St. Johns River Water Management District (SJRWMD), located in northeast Florida,
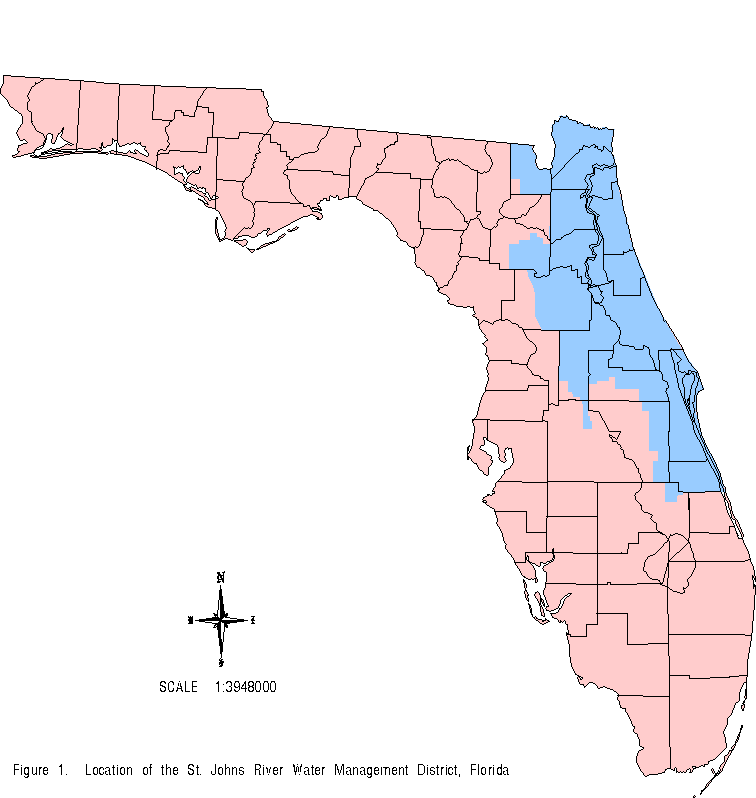
along with the other four water management districts within the state, is required to perform a needs and sources assessment of current and future water supply demands. Within the over 12,000 square miles of SJRWMD, ground water is the preferred source for public, agricultural, and industrial water supply. Ground water is withdrawn from the Floridan aquifer, which is a semi-confined limestone aquifer that extends from southeast South Carolina, southern Georgia, southern Alabama through Florida. Current ground water use for the 4,638,000 people in SJRWMD is 1,090 million gallons per day (mgd) and is projected to increase to 1,490 mgd by the year 2010.
Florida Administrative Code and Florida Statues, require water management districts in the State of Florida to identify “specific geographical areas that have water resource problems which have become critical or are anticipated to become critical within the next 20 years.” SJRWMD is assessing water supply needs and sources using regional numerical ground water flow models and local analytical ground water flow models to identify areas expected to have inadequate water resources to meet the anticipated water supply demand in the year 2010.
This study area covers the entire SJRWMD. SJRWMD includes all or part of 19 counties in northeast Florida and extends from the Florida-Georgia state line in the north to Vero Beach in the south. The eastern border of SJRWMD is the Atlantic Ocean, and the area of jurisdiction extends as far west as central Florida.
Ground water is of vital importance in the state of Florida, as virtually all major public water suppliers use ground water. In the area managed by SJRWMD the hydrogeology typically consists of a surficial aquifer, a semi-confining unit, and the Floridan aquifer. The Floridan aquifer is the primary source of public water supply in SJRWMD and consists of a highly permeable, Eocene age limestone. This aquifer can be found at land surface in some locations and at depths of 500 to 1,000 feet in other parts of SJRWMD. The quality of water within the Floridan aquifer varies from no potable water along the coast, to potable water at depths greater than 2,000 feet thick in Jacksonville and Orlando. Overlying the Floridan aquifer is a semi-confining unit consisting primarily of sands, clayey sands, and silts ranging from zero to several hundred feet thick. A surficial aquifer overlies the semi-confining unit. In some areas the surficial aquifer is significant enough to be a source for public water supply; however, there are areas within SJRWMD where the surficial aquifer is non-existent.
The needs and sources assessment was designed to provide a regional analysis of impacts on the Floridan aquifer as a result of projected ground water withdrawals. Seven regional ground water flow models were developed using the U.S. Geological Survey (USGS) MODFLOW model.
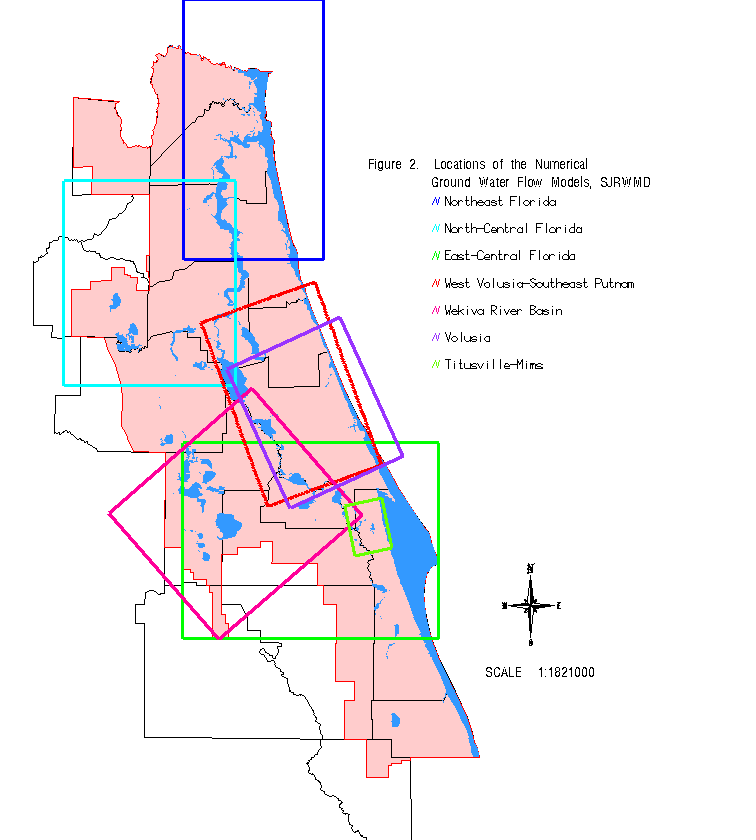
In areas not covered by the regional flow models, local-scale, analytical ground water flow models were developed.
The task at hand was to integrate the results of these models into meaningful information that could be used as part of the overall needs and sources assessment. One of the key components of the ground water portion of the project was projecting the District-wide, regional potentiometric surface, or water level elevation, of the Floridan aquifer. The individual objectives of the study were to select a base year (1988 was used), create the potentiometric surface for that year, project water withdrawals to the year 2010, create a projected potentiometric surface for 2010, and finally, determine the difference between the base year potentiometric surface and the 2010 potentiometric surface.
The issues to be tackled in this project were (1) integrating overlapping model areas, (2) integrating analytical model results with regional model results and, (3) applying the integrated results to areas not covered by any model. The assumptions in the process were (1) the numerical model boundaries needed to be far enough away from the areas of withdrawal so the impacts did not reach the boundaries and, (2) areas outside the model boundaries would have no change.
A geographic information system (GIS) is an excellent choice for this endeavor, as it has the power to analyze and graphically display spatial data. The SJRWMD GIS platform consisted of a UNIX environment, running ArcInfo 6.1.1 (Esri, 1992) on SUN Sparcstations II. The triangulated irregular network (TIN) module within ArcInfo became the foundation for the map preparation.
The ArcInfo TIN module formed the basis of most of the project. TIN connects data points in a data set, creating a triangular network, then calculates values based upon the slope and numerical value between the points. The process began with a set of data points. In the case of SJRWMD the points were potentiometric surface levels at particular well locations.
The point data set used to generate the TIN consisted of wells in which the water levels are cooperatively monitored by the USGS and the water management districts to produce potentiometric maps of the Upper Floridan aquifer. Since 1975, SJRWMD and USGS have worked together monitoring what currently numbers over 1,100 wells, during a mass sampling twice a year, in May and September. These periods reflect the seasonal climatic and water use variations. The water levels for the well points were processed through the TIN module, then contoured using the GIS. The computer-generated contour map, representing the potentiometric surface of the Floridan aquifer, closely emulates hand-drawn potentiometric surface contours that incorporate professional hydrologists’ interpretations of local hydrological features such as rivers and springs. Because of the success and satisfaction with the GIS-generated map, the well points became the control in the process of integrating the results of the regional numerical and local analytical ground water flow models. The monitoring well points provide ample data to contour water levels over the entire SJRWMD.
There are seven regional ground water flow models in SJRWMD. These flow models intercept and overlap each other in many cases. The project managers for each of the ground water flow models mutually agreed which area within each overlapping model domain provided the most accurate results based upon the model calibration process. Each ground water flow grid and the resultant water levels for the 1988 and projected 2010 simulations were brought into the GIS and the values at the well control points were identified. These values became the data set upon which the TIN was created.
After integrating the model results from the regional ground water flow models, the next step was to incorporate the results of the local analytical models into the well point data set. The analytical model that was used in this study utilizes a linear solution to predict a steady-state drawdown in a two-layered, homogeneous, isotropic, coupled aquifer system (Motz, 1978). Several steps were involved in this process. The models were run and the results were grids of simulated 1988 drawdowns and projected 2010 drawdowns. The 2010 pumpage value estimated by each utility was used in the model. The difference between the 1988 and 2010 grids was calculated using a simple FORTRAN program. The difference contours were moved into the GIS and the TIN was created from points along the contours. The results represented only drawdown values. The results were subtracted from 1988 observed potentiometric surface to obtain the projected 2010 potentiometric surface.
With all these data, the control data point set was complete and could be processed through TIN. When the TIN was completed, the data were contoured using the GIS. Three surfaces were created: (1) simulated 1988 potentiometric surface, (2) simulated 2010 potentiometric surface, and (3) difference between the 1988 and 2010 potentiometric surfaces.
The results of this effort include a potentiometric surface map of the Floridan aquifer for 1988.
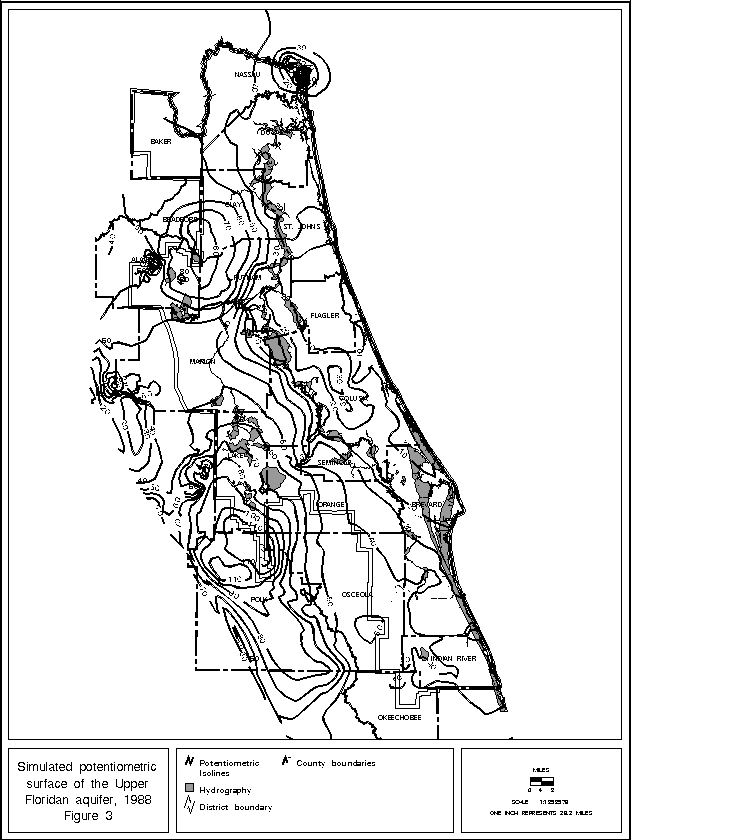
The TIN contour surface closely reflects hand-drawn potentiometric surface maps for the same time period incorporating local hydrologic expertise. The results also include a potentiometric surface map of the Floridan aquifer for the year 2010.
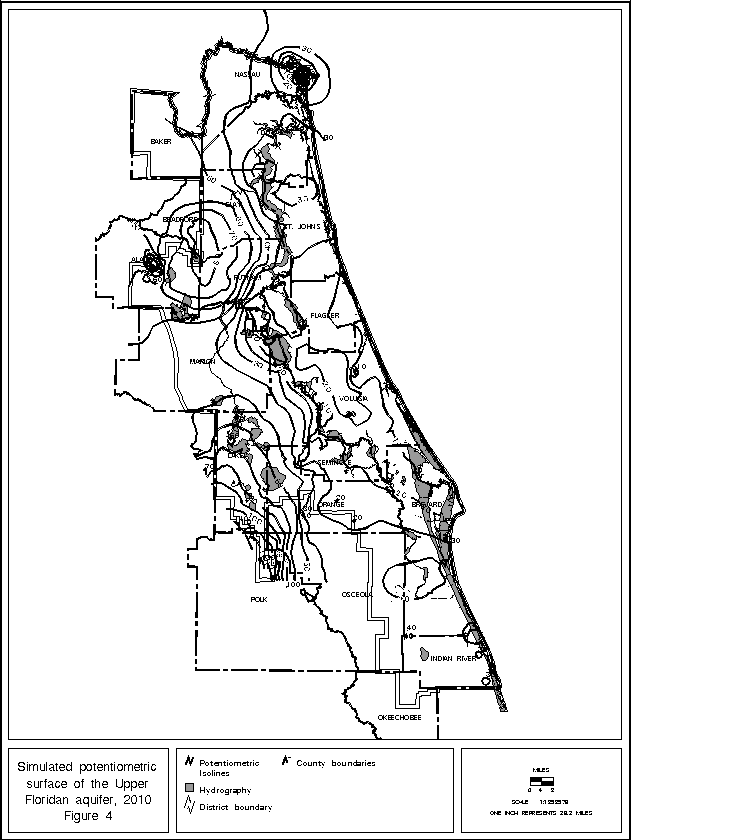
The final surface generated was the projected change in the potentiometric surface of the Floridan aquifer from 1988 to 2010.
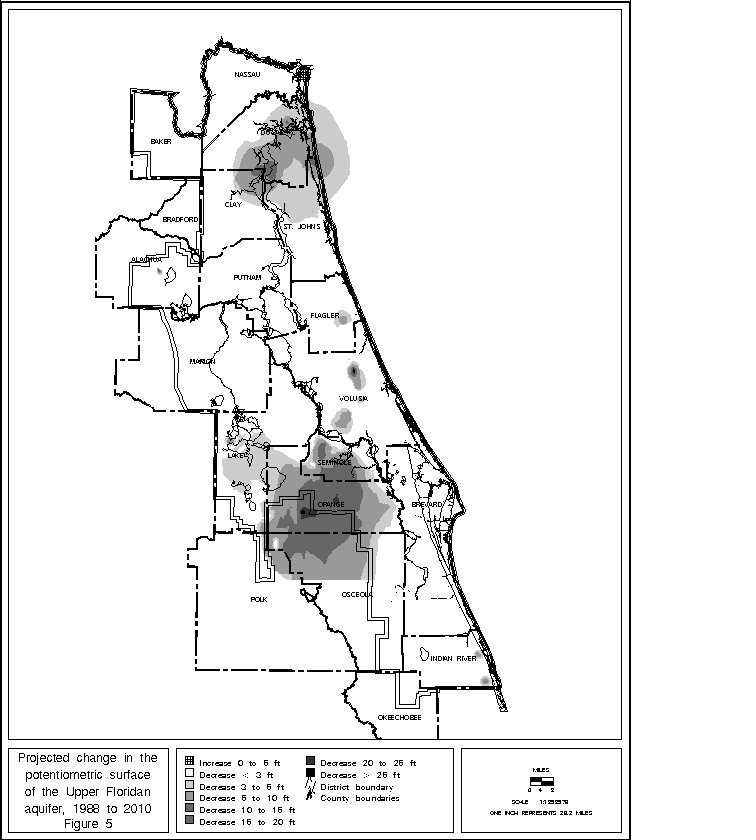
The distribution of the change in drawdown shows that Orange and Seminole counties will be most significantly affected as a result of increased ground water withdrawals. Projected declines in the Floridan aquifer are more than 25 feet in some areas.
By integrating the results of two different types of ground water models with GIS, SJRWMD has been able to create a map of the projected 2010 potentiometric surface of the Floridan aquifer, and a map showing the regional extent of the expected change in the potentiometric surface of the Floridan aquifer from 1988 to 2010. These results provide important information to use when planning for new and existing public water suppliers. SJRWMD will use this information along with other hydrologic and environmental assessments to work with local governments and utilities in the development of future water supply plans in areas identified as most significantly affected. Through proper planning, these entities can work together to reduce the impacts on the ground water system caused by the demand for water from increasing population and development.
Esri. 1992. Environmental Systems Research Institute. ArcInfo Release 6.1.1, December 23, 1992. Redlands, Calif.: Environmental Systems Research Institute.