Seagrasses are a vital component of Florida's coastal ecology and economy; they provide marine fauna with improved water quality, nursery grounds, shelter, and nutrition. As the state's human population grows, threats to the health and very existence of these ecological communities increase. Habitat degradation has many sources (e.g., pollution, dredge and fill), but an increasingly common cause is scarring of seagrasses. Scarring occurs when propellers damage seagrass beds by ripping up shoots and rhizomes (roots) and exposing the bottom sediment. In this paper, scarring can refer to either the activity of scarring or the area containing a group of scars.
The Florida Department of Environmental Protection (DEP) recognized the need to reduce scarring of seagrasses by boats and committed resources to address this issue. As one component of this effort, the Florida Marine Research Institute (FMRI) investigated the distribution of scarred seagrass beds in the shallow marine and estuarine waters of Florida's coastal counties. Aerial photography was used to locate areas of scarring. Aerial surveys were then conducted in 1992-1993 to confirm and amend the demarcation of scarred seagrasses.
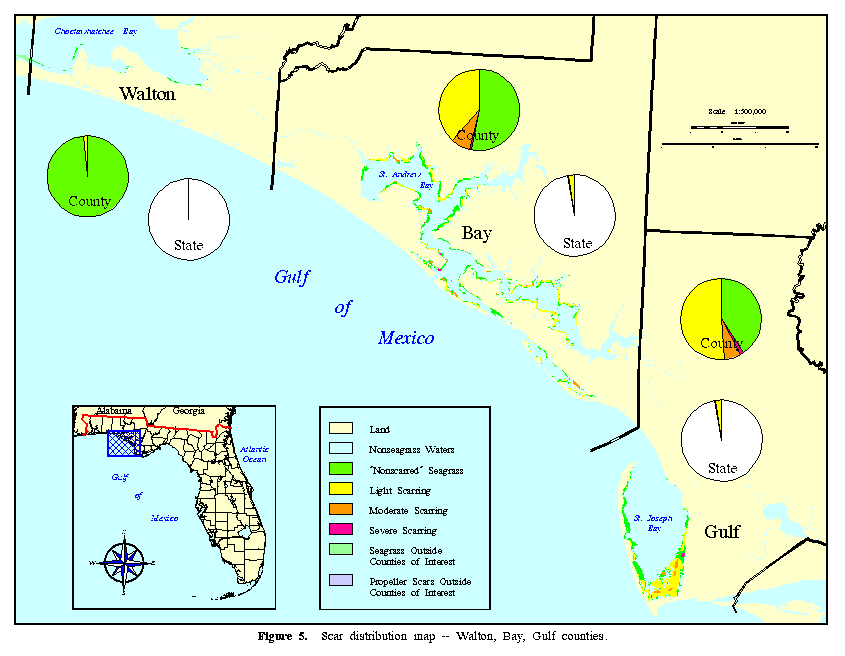
Scarring intensity was categorized as light, moderate, or severe. Polygons categorized as light contained less than 5 percent scarring, those categorized as moderate contained 5-20 percent scarring, and those categorized as severe contained greater then 20 percent scarring. The information acquired in this survey was incorporated into the FMRI's Marine Resources Geographic Information System (MRGIS), which when analyzed were used to produce maps and tabular products for use by resource managers, regional and county governments, and other interested parties.
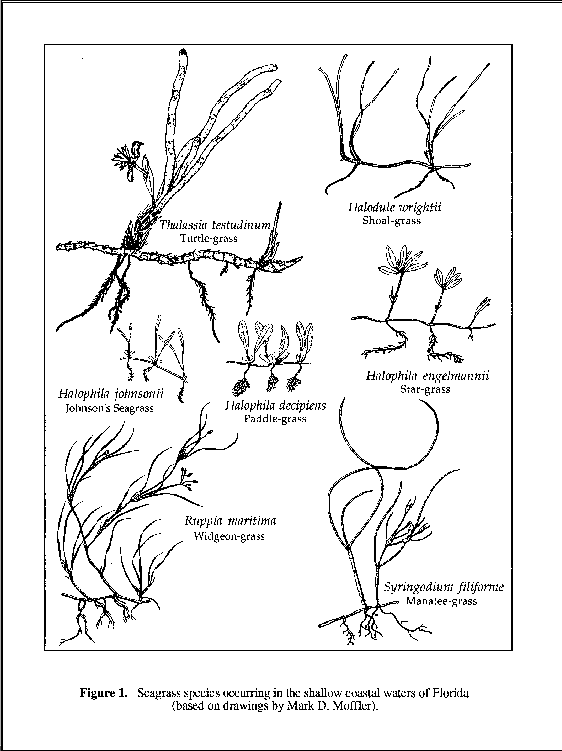
INTRODUCTION

	Seagrasses are completely submerged, grass-like plants that occur
mostly in shallow marine and estuarine waters.  The predominant seagrass
species in Florida (Figure 1) are turtle-grass (Thalassia testudinum Banks
ex Koenig), shoal-grass (Halodule wrightii Ashers.), and manatee-grass
(Syringodium filiforme Kutz.).  Other less common seagrasses--star-grass
(Halophila engelmannii Ashers.), paddle-grass (Halophila decipiens Ost.),
Johnson's seagrass (Halophila johnsonii Eisem.), and widgeon-grass
(Ruppia maritima L.)--may be locally abundant.  In areas subject to salinity
fluctuations, such as river mouths, other submerged aquatic plant species
(e.g., Zannichellia sp. and Najas sp.) may occupy an ecological role similar
to that of the true marine and estuarine seagrasses.
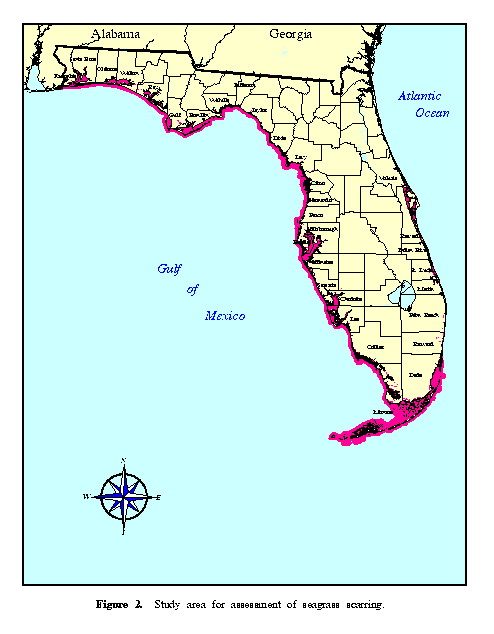
	Seagrasses form some of the most productive communities in the
world (Zieman and Zieman, 1989) and are aesthetically and economically
valuable to humans.  These complex, fragile communities benefit marine
and estuarine animals--especially larval and juvenile fish--by providing
critical shelter and sustenance.  In addition, seagrasses improve water
quality by stabilizing mobile sediments and by incorporating some
pollutants into plant biomass and into the stabilized sediments.

	As Florida's population increases, particularly in coastal counties,
threats to seagrass communities increase (Livingston 1987).  Seagrass
losses in Florida have been documented to range from 30 percent in the
Indian River Lagoon (Haddad and Harris 1985) to 81 percent in Tampa Bay
(Lewis et al. 1985).  The cumulative effects of anthropogenic threats (e.g.,
water pollution, docks, dredging and filling) are being addressed by various
federal, state, and local resource management programs.  One threat that is
becoming more acute, as people increasingly use boats and other watercraft
for recreation and work, is scarring of seagrasses.  In this paper, scarring
can refer to either the activity of scarring or to a group of scars in a seagrass
bed.

	The most common type of scarring to seagrasses is caused by
small-boat propellers; however, larger craft, which are usually confined to
deeper waters, may have much larger individual effects when they run
aground, especially near shipping channels and ports.  Propellers damage
seagrass beds by ripping up shoots and rhizomes (roots) and exposing the
bottom sediment.  Nearly all shallow seagrass beds in Florida show
damage caused by boat propellers.  Recovery and regrowth of seagrasses
from such damage can take years (Durako et al. 1992).  Extensive scarring
may expose the beds to further disruption from storms and other natural
erosional forces, thereby increasing the rate of cumulative loss.  Similarly,
resuspension of sediments in the water column, may further contribute to
habitat loss by inhibiting the growth of seagrasses.

Study Objective
	Concerns about the effects of seagrass scarring and recovery on
marine productivity compelled the Florida Marine Research Institute
(FMRI) to conduct a general survey of the extent and intensity of seagrass
scarring in the shallow coastal waters of Florida.  We collected and analyzed
the data using a combination of aerial photography, aerial surveys, and
Geographic Information System (GIS) technology.  For the first time, the
statewide extent of seagrasses was described, and the magnitude of scarring
was estimated and documented so that Florida's seagrass resources can be
more effectively protected.  Further investigations and surveys using
developing technologies will refine our knowledge of seagrass distributions
and the effects of human activities on the resource's productivity.


METHODS

	The study area extended from the Alabama-Florida border at
Perdido Bay (Escambia County), east and south along the Gulf coast to the
Florida Keys, and then north along the lagoonal river systems of the
Atlantic Coast to just south of New Smyrna Beach (Volusia County) in
Mosquito Lagoon. A total of 31 of the state's 35 coastal counties are
included in this survey (Figure 2). The four counties north of Volusia
County on the Atlantic coast of Florida were not included because areas
suitable for seagrass growth are not present. Only the southern part of
Volusia County below U.S. Highway A1A at Port Orange was included in
this survey.
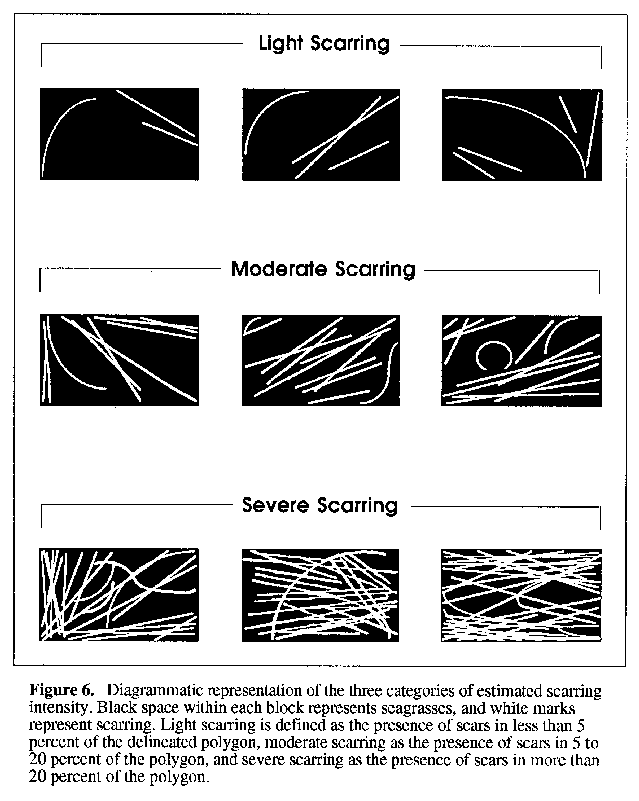
	To cover such a large geographic area, we used an approach
combining analysis of high-resolution aerial photographs with ground-
truthing during aerial surveys. In the Florida Keys, the aerial surveys were
conducted first, and aerial photography was used as collateral data.  The
aerial photography provide sufficient detail to allow recognition of prop
scars, however, high-resolution photography was limited.  Where available,
pertinent photography not contained in the FMRI library were obtained
from the appropriate water-management districts.

	The largest-scale aerial photography used were the 1:13,200 color-
infrared (CIR) transparencies collected for the Florida Keys Land Cover
Mapping Project (funded by the U.S. Environmental Protection Agency's
Advanced Identification of Wetlands Program) in December 1991. The
smallest-scale photography used consisted of 1:40,000 CIR transparencies
provided by the South Florida Water Management District (SFWMD).
The oldest photographs used for scarring delineation were taken in
November 1990.  Although these photographs did not represent conditions
at the time of the survey, historical scarring patterns were documented from
them, and areas requiring closer examination were identified.


Scarring Recognition
	We did not distinguish among the various scarring sources nor map
individual prop-scars.  A bounding polygon was drawn around groups of
scars that had a map area greater than one acre.  The intensity of scarring in
each polygon was categorized based upon the Comparison Chart for Visual
Estimation of Percentage Composition (after Terry and Chilingar 1955).
Polygons designated as light enclosed areas where less than 5 percent of the
seagrasses were scarred, moderate polygons contained areas with from 5
percent to 20 percent scarring, and severe polygons delineated areas with
more than 20 percent scarring.  Diagrammatic representations of the three
categories of estimated scarring intensity are shown in Figure 3.  In some
areas, different intensities of scarring were adjacent and could not be easily
differentiated. These areas were delineated as a single polygon and were
assigned a value for the overall scarring intensity.
	Polygons drawn on the registered overlays on the aerial photographs
were transferred to National Oceanic and Atmospheric Administration
(NOAA) nautical charts using a zoom transfer scope (ZTS). The ZTS
superimposes an image onto a base map of a different scale, providing for
accurate transfer of the hand-drawn polygons from the photograph overlays
onto the NOAA base maps. In most cases, 1:40,000-scale NOAA charts
were used as base maps. The lack of larger-scale charts for the region from
Anclote Key (Pasco County) to Alligator Harbor (Franklin County) forced
us to use 1:80,000-scale charts.  When possible, we used inset maps of
various scales (1:5,000-1:20,000) to supplement small-scale chart
information. In a portion of the Florida Keys, 1:24,000-scale U. S.
Geological Survey (USGS) quadrangle maps were used as base maps
because the largest-scale NOAA charts were only available at a scale of
1:80,000 (Table 1).


Table 1.  NOAA nautical charts and USGS topographic maps used as base
maps on which seagrass scarring in Florida was represented.
  Number         Scale                                  Official Name
Chart 11378	1:40,000	Intracoastal Waterway - Santa Rosa Sound to Dauphin Island
Chart 11393	1:40,000	Intracoastal Waterway - Lake Wimico to East Bay
Chart 11402	1:40,000	Intracoastal Waterway - Apalachicola to Lake Wimico
Chart 11404	1:40,000	Intracoastal Waterway - Carrabelle to Apalachicola Bay
Chart 11405	1:80,000	Apalachee Bay
Chart 11407	1:80,000	Horseshoe Point to Rock Islands
Chart 11408	1:80,000	Crystal River to Horseshoe Point
Chart 11409	1:80,000	Anclote Keys to Crystal River
Chart 11412	1:80,000	Tampa Bay and St. Joseph Sound
Chart 11413	1:40,000	Tampa Bay - northern part
Chart 11414	1:40,000	Tampa Bay - southern part
Chart 11425	1:40,000	Intracoastal Waterway - Charlotte Harbor to Tampa Bay
Chart 11427	1:40,000	Intracoastal Waterway - Fort Myers to Charlotte Harbor
Chart 11430	1:40,000	Everglades National Park - Lostmans River to Wiggins Pass
Chart 11432	1:50,000	Everglades National Park - Shark River to Lostmans River
Chart 11433	1:50,000	Everglades National Park - Whitewater Bay
Chart 11441	1:30,000	Key West Harbor and approaches
Chart 11442	1:80,000	Sombrero Key to Sand Key
Chart 11445	1:40,000	Intracoastal Waterway - Bahia Honda to Key West
Chart 11448	1:40,000	Intracoastal Waterway - Big Spanish Channel to Johnson Key
Chart 11449	1:40,000	Matecumbe to Bahia Honda Key
Chart 11451	1:80,000	Miami to Marathon and Florida Bay
Chart 11463	1:40,000	Intracoastal Waterway - Elliott Key to Matecumbe
Chart 11465	1:40,000	Intracoastal Waterway - Miami to Elliott Key
Chart 11467	1:40,000	Intracoastal Waterway - West Palm Beach to Miami
Chart 11485	1:40,000	Intracoastal Waterway - Tolomato River to Palm Shores
USGS map	1:24,000	Marquesas Keys West
USGS map	1:24,000	Marquesas Keys East
USGS map	1:24,000	Cottrell Key
USGS map	1:24,000	Key West

Scar Mapping and MRGIS Integration
	After marking the maps and charts with polygons, we conducted
aerial surveys to verify scarring and refine the delineations of scarring
intensity. Most aerial surveys were conducted between May 1992 and May
1993. The Florida Keys surveys were conducted between October 1992 and
March 1993.  Information about seagrass scarring in Florida Bay was
furnished by Skip Snow of the Everglades National Park (ENP).  Within
Florida Bay, scarring occurs principally on seagrass banks, which are
exposed at low tide.  To confirm the locations of scarred seagrasses, a brief
aerial survey was conducted by FMRI staff over a portion of Florida Bay.
Aerial surveys were important in assuring accurate representations of the
extent and intensity of scarring because even in the better photographs, not
all scars were visible.

	In regions where seagrasses were distributed along relatively
straight and continuous shorelines, such as the Indian River Lagoon, the
southeast Intracoastal Waterway, and the Florida Keys, surveys were
conducted from light, fixed-wing aircraft (Cessna 152 or 172).  Regions
with convoluted shorelines and numerous islands, such as Tampa Bay,
Biscayne Bay, Waccasassa Bay, and parts of Florida Bay, were surveyed
from a helicopter (Hughes 500).  In the lower Florida Keys, where wide
areas of seagrass extend from the Atlantic Ocean into Florida Bay, transects
approximately 1000 feet apart were conducted perpendicular to the main
axis of the Florida Keys.  Military bases prohibited aerial surveys of some
seagrass areas.

	Upon completion of the aerial surveys, we edited and recompiled
the scarring data onto a clean set of base maps and then transferred the data
into the Marine Resources Geographic Information System (MRGIS) at the
FMRI.

	The final data taken from paper maps and charts were integrated into
the Marine Resources GIS (MRGIS) at the Florida Marine Research
Institute (FMRI) by the Coastal and Marine Resources Assessment
(CAMRA) group.  In consideration of the geographic extent of the study,
the varied scales of the base maps, and the data-collection methodology,
CAMRA staff determined that the data would be better represented as a
single, statewide coverage with a scale of 1:40,000.  The polygons
delineating scarring were digitized and attributed to their appropriate
scarring intensities. The resultant scarring coverage was registered to the
1:40,000-scale, state-wide shoreline coverage already within the MRGIS.

	Check plots were produced and compared to the original source
maps to verify the presence and proper attribution of the polygons.
Polygons that were inadvertently omitted from the coverage were added,
and incorrect attributes were changed.  A second iteration of this quality-
assurance process was performed to ensure the completeness of these
preliminary data on scarring.

	Next, we used the 1:40,000-scale land coverage to erase any portion
of a polygon that had been drawn onto the land and subsequently digitized.
Erase is an ArcInfo command that creates a new coverage by removing
portions of the polygons from one coverage that are within an erase region.
In this case, the polygons in the land coverage define that erase region, and
the portions of the digitized polygons that overlapped the land were
removed.  This process was used to ensure the appropriate spatial
coincidence between the polygons and the land features without having to
digitize them.  This minimized operator error on subsequent areal
comparisons by ensuring coincidence of all arcs with other data sets
contained in the MRGIS.

	Following the erase process, the resultant coverage was intersected
with a modified county coverage and used to calculate acreages scarred by
class and county.  Intersect is one of several overlay commands available in
ArcInfo.  Intersect was used because the polygons in the coverage
(input coverage) split where the polygons of the county boundaries
(intersect coverage) overlap.  Only those portions of polygons coincident
between both input and intersect coverages were saved in the output
coverage. All feature-attribute items from both coverages were carried in the
attribute tables of the output coverage.  If duplicate items were encountered,
the item from the input coverage was maintained, and the one in the
intersect coverage was dropped.

	The original county coverage was obtained from the 1990,
1:100,000 TIGER census data for the state of Florida.  The shoreline
features were removed, and where required, the county boundaries were
extended offshore to enclose the data just created and all the existing
seagrass-distribution data.  On the Atlantic coast, the three-mile offshore
extensions of the original County Jurisdictional Boundaries were sufficient
to meet our standards.  On the Gulf coast, county boundaries were extended
out to the nine-mile State Jurisdictional line.  For Dade and Monroe
counties, the offshore lines required further extension to ensure enclosure of
all mapped seagrasses.

Creating a Statewide Seagrass Coverage
	A statewide seagrass database consisting of the most recent seagrass
data available was assembled.  Data were obtained from various sources
and integrated into the MRGIS (Table 2).  Disparate data collected were of
various dates, scales, seagrass classifications, and formats.  For example,
seagrass classifications ranged from species-specific values for the density
of bottom cover to unique coding schemes.  Although data created in-house
or by one of the water-management districts were in ArcInfo format,
data from some sources were AutoCAD line files, which required
conversion.  This situation is not unique to this study.  GIS and remote-
sensing disciplines are currently investigating theoretical and technical
difficulties associated with integrating data from disparate sources.


Table 2.  Sources of data used to compile seagrass distributions for the 31
Florida coastal counties in this study.

Coverage Name*  Date    Source(s) and Scale
Pangrass	1982	FDEP	1:24,000 scale NC aerials

(Alabama to

 Apalachee Bay)	1985		1:58,000 scale CIR aerials

Bendgrass	1983	MMS	1:40,000 scale NC aerials

(Apalachee Bay to St. Joseph Sound)

Tbaygrass	1990	SWFWMD	1:24,000 scale NC aerials

(St. Joseph Sound to Sarasota Bay)

Lemgrass	1987	Mangrove 1:24,000 scale Aerial Photography
(Lemon Bay)		Systems Inc.

(Digitized into ERDAS at a scale of 1:40,000)

Chargrass	1982	FDEP/FDOT 1:24,000 scale Aerial Photography
(Charlotte Harbor to Estero Bay)

Sfgrass		1988	MMS	"Southwest Florida Nearshore Benthic

(Everglades to Biscayne Bay)	Habitat Study" maps (1:40,000)

		1982	Marszalek  "Florida Reef Tract Marine Habitats

				   and Ecosystems" maps (1:40,000)

		1983	Dade	"Benthic Communities
				County	of Biscayne Bay" map (1:40,000)


		1987	FDEP	1:40,000 scale NC aerials

				(data gaps were filled in-house)


Palmgrass	1990	Palm Beach  AutoCAD line files

(Palm Beach County)	County	   (converted to ArcInfo by FDEP in 1994)


Irlgrass	1992	SJRWMD	1:24,000 scale CIR aerials
(Jupiter Inlet to Mosquito Lagoon)
* Identify the name for seagrass-coverage data in the Marine Resources Geographic
   Information System (MRGIS) at the Florida Marine Research Institute (FMRI).

NC--reference for natural color; CIR--reference for color infrared

	Some seagrass source data were distorted and required correction
(e.g., data for Charlotte Harbor and the Big Bend region).  In addition to
correcting existing seagrass data sets and integrating non-ArcInfo data,
several gaps in the statewide seagrass-data coverage were identified and
filled.  Data needs for the area from Indian Rocks Beach to Anclote Key
and a portion of Sarasota Bay were filled using 1990 SWFWMD 1:24,000-
scale CIR aerials.  Some minor gaps in the seagrass data from south Florida
and the southern half of Estero Bay were interpreted from 1:24,000-scale
CIR aerials borrowed from the SFWMD.

	Sparse and hardbottom seagrasses in Monroe and Dade counties
were included in the overall seagrass distributions and scarring calculations
because substantial patches of dense and moderately dense shoal-grass and
turtle-grass were intermixed and could not be separately delineated.  In the
Big Bend and Indian River Lagoon regions, however, we deleted sparse-
seagrass categories from mapping and analysis.  These areas consist mostly
of very sparse Halophila beds, which are usually in deeper waters and may
not be pertinent to ecological concerns addressed in this study.
Nevertheless, we separated the seagrass distributions for Monroe and Dade
counties into sparse/hardbottom and dense/moderately dense seagrass
acreages (Table 3) for those who wish to eliminate these categories from
scarring-extent calculations.  All of our calculations were based on the total
seagrass acreages for Monroe and Dade counties.


Table 3.  Acreage of scarred seagrasses (to the nearest acre) in each
Florida coastal county in this study.  Totals are based upon calculated
values, not rounded values.

County		Total	Light	Moderate	Severe	Total

		Seagrass Scarring Scarring 	Scarring Scarring

Bay		10,533	4049.5	822.7		75.5	4947.8

Brevard		46,187	4163.4	1937.5		111.2	6212.1

Broward		1	1.1	0.0		0.0	1.1

Charlotte	14,190	1528.1	5625.3		287.7	7441.1

Citrus		147,807	25704.2	1700.6		176.2	27581.0

Collier		5,250	1968.3	1592.0		90.2	3650.5

Dade		145,654* 2742.9	3973.4		4504.1	11220.4

		120,682 (d/m)

		24,316 (s/h)

Dixie		111,133	2470.1	1018.9		0.0	3489.0

Escambia	2,753	514.9	177.3		9.3	701.5

Franklin	19,845	436.3	369.2		0.0	805.5

Gulf		8,171	4200.0	535.0		109.8	4844.8

Hernando	146,869	7790.7	709.3		0.0	8500.1

Hillsborough	6,322	1680.3	2232.1		181.4	4093.7

Indian River	2,941	142.0	7.9		32.8	182.7

Jefferson	10,501	421.5	84.9		0.0	506.4

Lee		50,509	5925.0	7100.3		1286.7	14312.0

Levy		132,403	9969.1	119.7		0.0	10088.9

Manatee		12,158	2484.2	2202.0		784.9	5471.2

Martin		2,308	23.6	8.1		0.0	31.7

Monroe		1,452,801* 14559.8 10425.0	5062.2	30047.0

		717,442 (d/m)

		733,207 (s/h)

Okaloosa	3,447	310.1	75.4		4.9	390.4

Palm Beach	2,513	52.0	21.7		0.0	73.7

Pasco		85,571	2120.0	1761.5		355.7	4237.2

Pinellas	22,919	3803.0	3865.7		2013.3	9682.0

Santa Rosa	2,717	445.3	110.4		0.0	555.7

Sarasota	4,164	718.1	301.4		32.3	1051.8

St. Lucie	6,923	39.0	42.9		0.0	81.8

Taylor		162,864	8101.6	62.7		0.0	8164.3

Volusia		8,489	1432.6	1011.9		354.4	2798.8

Wakulla		29,631	2057.1	730.8		0.0	2787.9

Walton		713	11.5	0.0		0.0	11.5

Total	2,658,290*    109,865.4      48,625.6      15,472.5	173,963.5


* Dade County and Monroe County totals and the overall total include the sparse/hardbottom

(s/h) and dense/moderate (d/m) acreages.


	The final statewide seagrass coverage was created in such a way that
all of the seagrass attributes were combined and simplified to a single code
that indicated presence or absence of seagrass.  This coverage was then
intersected with the same county coverage described above and used to
calculate an acreage of mapped seagrasses for each coastal county
represented in this study.


Error Reduction

	A mapping effort of this scale and geographic extent cannot contain
sufficient detail to account for subtle changes in bottom type.  In many
cases, polygons were not exclusively coincident with seagrasses but
included areas of bare substrate, tidal flats, hardbottom, and channels.  To
evaluate the ramifications of this phenomenon, a comprehensive
assessment of the potential overestimation of scarring was conducted, and
suspect areas were identified.  A new series of 1:40,000-scale checkplots
were created that overlaid the erased polygons on the presence-absence
seagrass data now contained in the MRGIS.  Digital coverages were
combined and analytic tools in the GIS were used to calculate the degree of
coincidence and shrinkage.  Shrinkage describes the reduction in size of
polygons so that they coincided with known seagrass-distribution data now
in the MRGIS.

	In some regions of the state (e.g., the Big Bend region), the
differences between the original scarring calculated and the corrected
scarring values were minimal (coincidence approximately 100 percent).
However, in other areas (e.g., Tampa Bay), corrected values decreased the
original scarring calculations by nearly 40 percent.  A series of 1:40,000-
scale test plots were run to evaluate the cause of this variability and to
determine if our correction methodology was sound.

	Variability between areas can be explained by several factors.  For
areas such as Tampa Bay--where the seagrass data were mapped with a
high level of detail from high-resolution aerial photography (1:24,000)--
polygons could be corrected with a great deal of confidence.  In contrast, for
regions like the Big Bend--where seagrass data were mapped from less
detailed, smaller-scale photography--polygons were almost completely
coincident with mapped seagrasses, and shrinkage was minimal.

	Seagrass distributions also affected the amount of correction needed.
The more discontinuous (the patchier) the seagrass beds were, the greater
the shrinkage was.  Similarly, the shrinkage may be adversely affected by
temporal differences between the seagrass source data and data from the
aerial surveys.  For example, seagrass-distribution data used in Charlotte
Harbor date back to 1982, ten years before the aerial surveys were
conducted for this study.  Changes in seagrass distribution probably
occurred during that time period.  The effects of these potential influences
could not be controlled with the methodological approach used in this study.

	Polygons coincident with mapped seagrasses were categorized as
Type I.  Despite the shrinkage method used, these polygons would have
remained in the data.  In areas with questionable seagrass and scarring
coincidence, each case was individually evaluated for accuracy.  Polygons
representing scarring in areas where sparse seagrasses had been excluded
from the generalized distribution were retained in the analysis because they
indicated the presence of seagrasses, as confirmed in the aerial surveys.
Most of the assessment in the Florida Keys was accepted without
secondary evaluation because the survey was done under the auspices of the
FMRI, and polygons that were generated were subjectively classified as
Type II.  Polygons were classified as Type II if they were not coincident
with pre-existing, mapped seagrass distributions but were obviously present
as part of existing seagrasses.  Type-II polygons were included in the final
data on scarring.


RESULTS


	For the seagrass data available during this study, moderately dense
to dense seagrasses--i.e., excluding sparse and hardbottom seagrasses in the
Florida Keys and sparse Halophila beds elsewhere--total approximately
1,901,000 acres.  If hardbottom and sparse seagrasses in the Florida Keys
are included in acreage estimates, seagrasses in Florida total nearly
2,660,000 acres (Table 4).

Table 4.  Relative percentage of scarred seagrasses, by intensity level, in
each Florida coastal county in this study.  Relative percentage is calculated
for each category as the scarring in the county divided by scarring for the
state multiplied by 100.

County		Total	Light	Moderate	Severe	Total

		Seagrass Scarring Scarring	Scarring Scarring


Bay		0.4	3.7	1.7		0.5	2.8

Brevard		1.7	3.8	4.0		0.7	3.6

Broward		0.0	0.0	0.0		0.0	0.0

Charlotte	0.5	1.4	11.6		1.9	4.3

Citrus		5.6	23.4	3.5		1.1	15.9

Collier		0.2	1.8	3.3		0.6	2.1

Dade		5.5	2.5	8.2		29.1	6.4

Dixie		4.2	2.2	2.1		0.0	2.0

Escambia	0.1	0.5	0.4		0.1	0.4

Franklin	0.8	0.4	0.8		0.0	0.5

Gulf		0.3	3.8	1.1		0.7	2.8

Hernando	5.5	7.1	1.5		0.0	4.9

Hillsborough	0.2	1.5	4.6		1.2	2.4

Indian River	0.1	0.1	0.0		0.2	0.1

Jefferson	0.4	0.4	0.2		0.0	0.3

Lee		1.9	5.4	14.6		8.3	8.2

Levy		5.0	9.1	0.2		0.0	5.8

Manatee		0.5	2.3	4.5		5.1	3.1

Martin		0.1	0.0	0.0		0.0	0.0

Monroe		54.6	13.3	21.4		32.7	17.3

Okaloosa	0.1	0.3	0.2		0.0	0.2

Palm Beach	0.1	0.0	0.0		0.0	0.0

Pasco		3.2	1.9	3.6		2.3	2.4

Pinellas	0.9	3.5	7.9		13.0	5.6

Santa Rosa	0.1	0.4	0.2		0.0	0.3

Sarasota	0.2	0.7	0.6		0.2	0.6

St. Lucie	0.3	0.0	0.1		0.0	0.0

Taylor		6.1	7.4	0.1		0.0	4.7

Volusia		0.3	1.3	2.1		2.3	1.6

Wakulla		1.1	1.9	1.5		0.0	1.6

Walton		0.0	0.0	0.0		0.0	0.0


	The distribution of seagrasses in Florida coastal waters is uneven;
some counties have very little and others have a disproportionately large
amount.  Figures 4 through 16 illustrate the seagrass and propeller scar
distribution for the entire study area.  Monroe County alone contains 54.6
percent of all Florida seagrass-bed acreage--mostly in Florida Bay and the
Florida Keys.  Much of the remaining seagrass acreage (26.4 percent)
occurs in the shallow Gulf waters of Taylor, Citrus, Hernando, Levy, and
Dixie counties in the Big Bend region of Florida.  These counties have more
seagrasses because they have extensive, shallow-water, low-energy areas
with water quality that is generally good.  These conditions promote rapid
growth and coalescence of seagrasses.
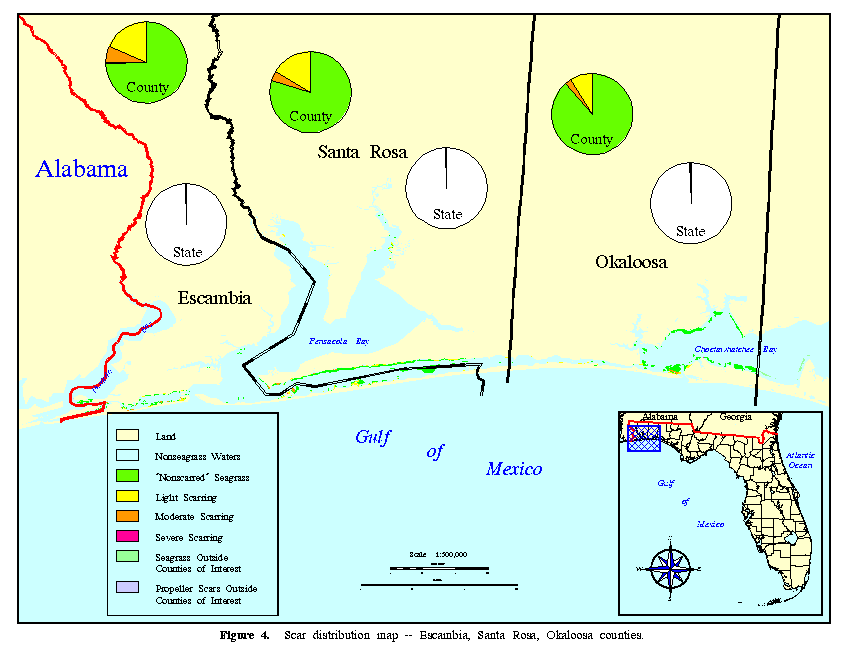
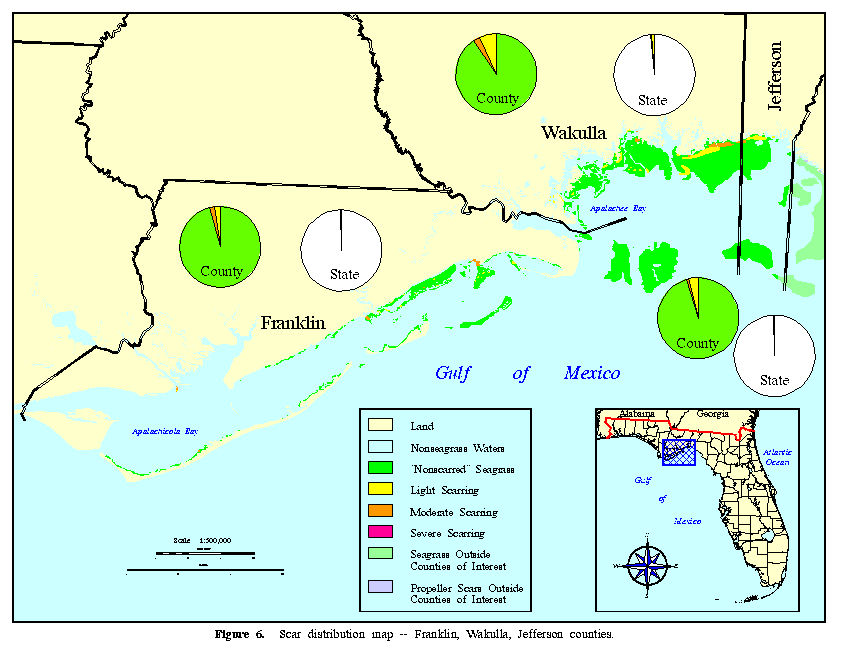
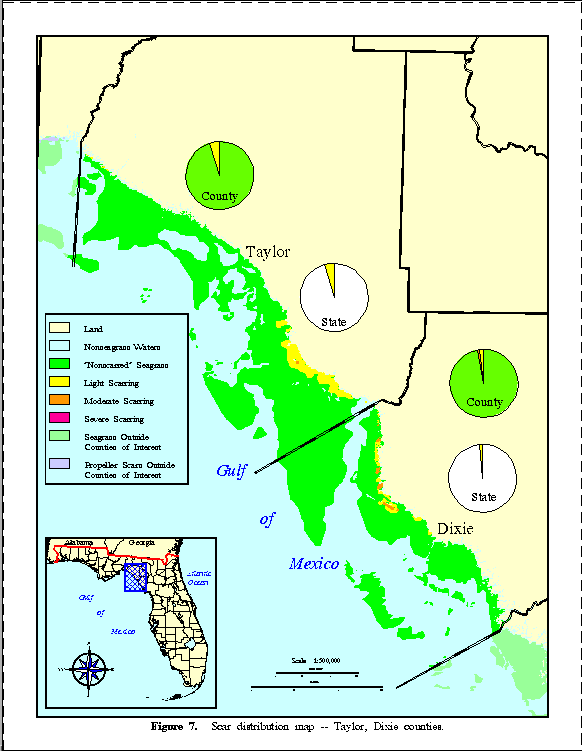
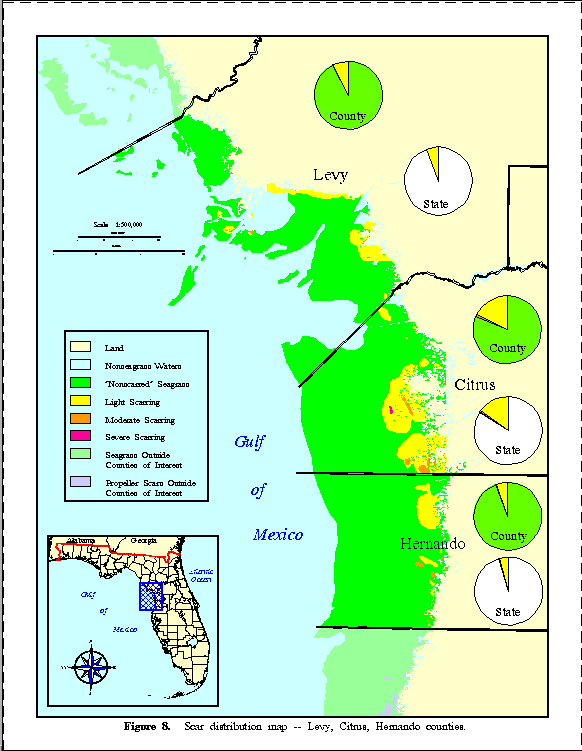
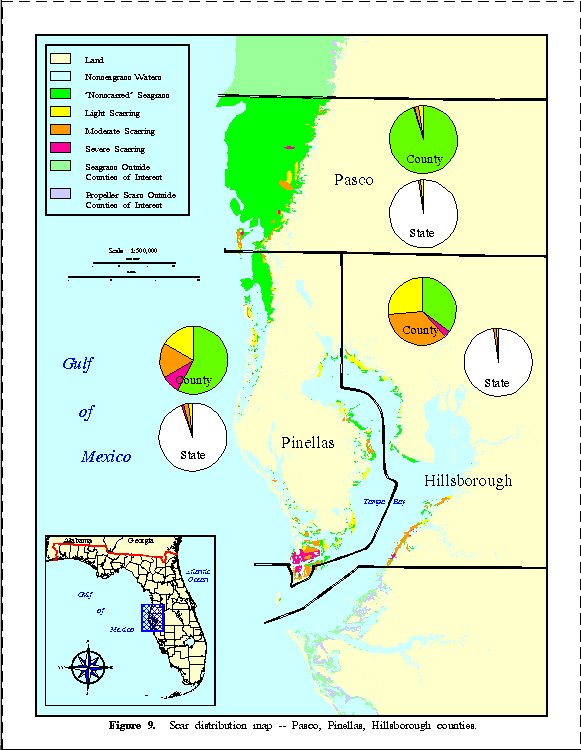
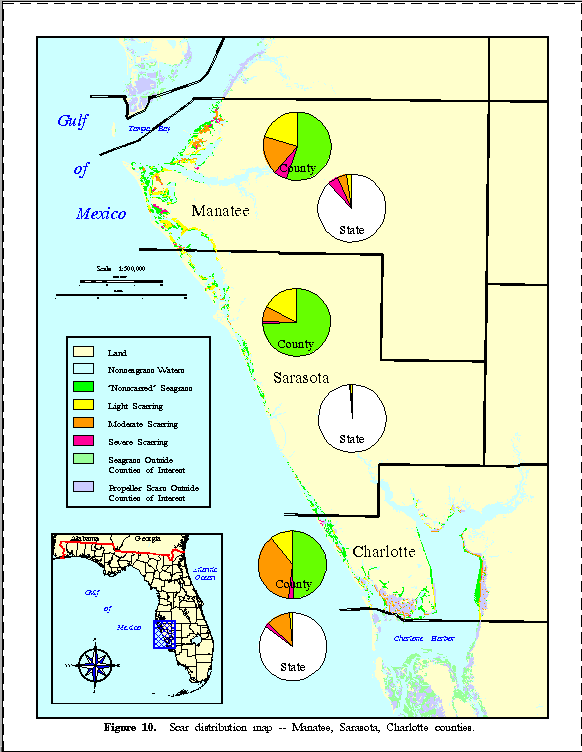
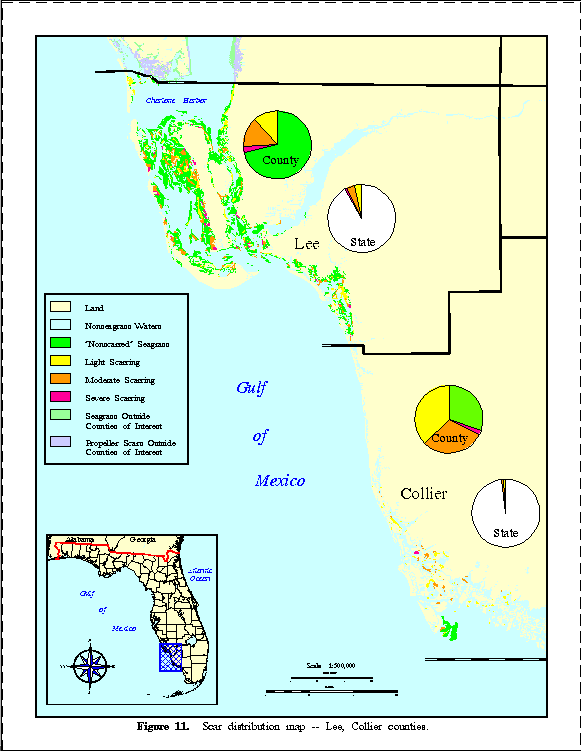
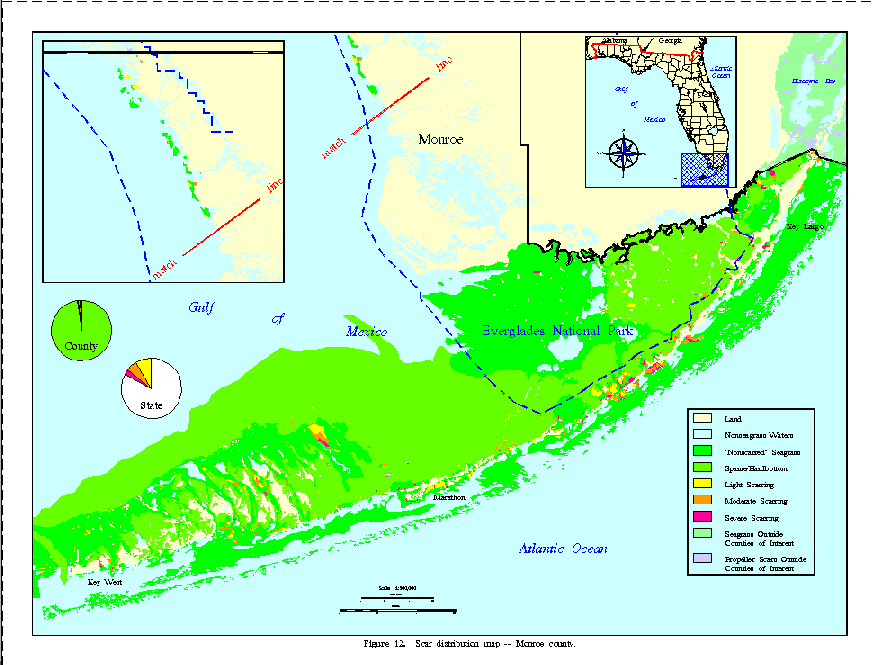
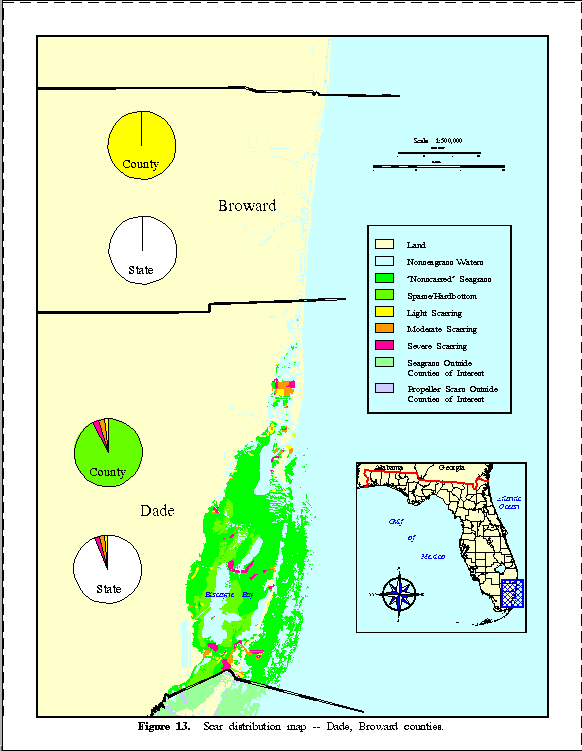
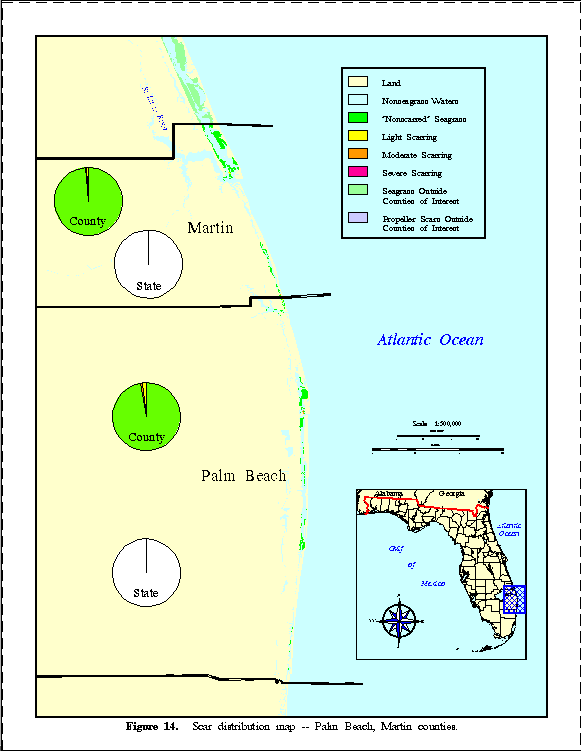
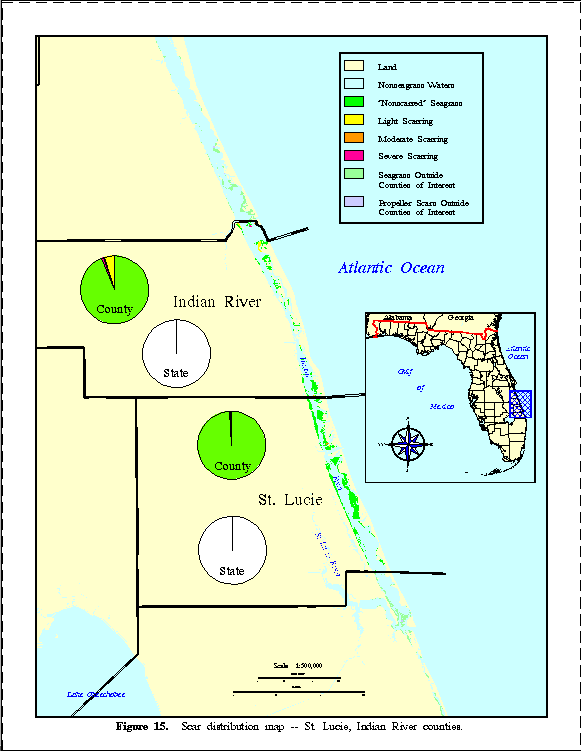
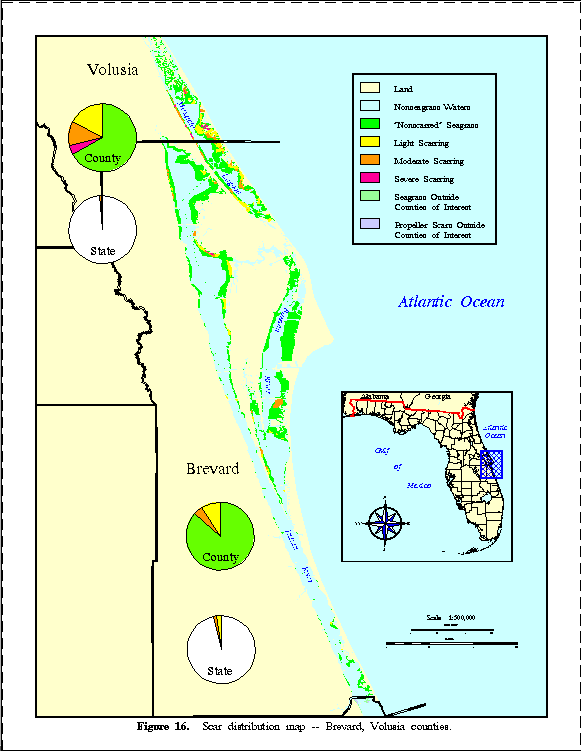
	The remaining seagrass acreage (19 percent) is fairly evenly
distributed among the other 25 counties, mostly in embayments and
lagoonal systems.  Twenty-two counties have less than 50,000 acres of
seagrass, and the majority of those have less than 20,000 acres.  The
median seagrass acreage for the 31 coastal counties in this study is
approximately 10,500 acres.  After Monroe County (1,452,800 acres),
Taylor county has the largest seagrass acreage (162,860 acres).  Of the
Florida counties that contain at least some seagrass, Broward County had
the smallest acreage; approximately one acre of seagrass could be
recognized from seagrass-distribution sources.

	The majority of Florida's moderate/severe (M/S) seagrass scarring
(68.9 percent) occurred in five counties: Monroe, Dade, Lee, Charlotte, and
Pinellas.  These same counties contain 63.4 percent of the state's seagrass
acreage.  However, if Monroe County is excluded from analysis--because
of its disproportionately large amount of seagrass acreage and scarring--the
five counties that have the most M/S scarring contain only 9.3 percent of the
state's seagrass acreage but 49.4 percent of its M/S scarring.

	For comparative purposes, then, counties must be ranked based on
their percentages of scarring relative to scarring for the entire state. Relative
to the whole state, the greatest amount of total scarring occurred, as would
be expected from seagrass distributions, in Monroe and Citrus counties
(Tables 3 and 4).  Lee, Dade, Levy, and Pinellas counties also had
substantial scarring.


CONCLUSION

	Despite the limitations and assumptions of the methodology used,
GIS and related technologies provided the necessary capabilities for a study
of this nature and geographic extent.  GIS analyses and products (both
maps and tabular data) developed, provided needed information to resource
managers, regional and county governments, and other interested parties.

	Management programs to control seagrass scarring have been
implemented by several local governments.  Additional programs are
needed for counties that have severe scarring problems.  Currently, the state
manages scarring in only a few state parks (e.g., Lignumvitae Botanical Site
and John Pennecamp Coral Reef State Park).  A state-wide management
program should be developed to protect seagrasses from scarring while still
allowing for traditional water-related recreational and commercial activities.
Combined with county programs, statewide management of scarring could
effectively protect seagrass habitat.

	A single management approach, such as channel-marking alone,
only partially addresses the problem of seagrass scarring.  A combination
of management techniques, along with long-term commitment, must be
used to reduce the frequency and degree of scarring in seagrass beds. Some
programs being implemented and tested use multifaceted approaches such
as better educating the boating public, better marking of channels, limiting
powerboat access in certain sensitive areas, and more effectively enforcing
existing laws.  Monitoring managed areas, both from the air and on site, is
critical in determining the effectiveness of a management program.


	Nevertheless, preventing all seagrass scarring is impossible.  With
proper management, scarring can be reduced to a level that will reverse the
cumulative damage to this critical resource.  Although the data presented in
this report are of a broad nature, the report provides a basis for further and
more refined management of areas subject to an increase in seagrass-
resource use.


LITERATURE SITED

Durako, M.J., M.O. Hall, F. Sargent, and S. Peck. 1992. Propeller scars in seagrass
beds: an assessment and experimental study of recolonization in Weedon
Island State Preserve, Florida. Pp. 42-53 in Webb, F. (ed.), Proceedings from
the 19th Annual Conference of Wetlands Restoration and Creation.
Hillsborough Community College. Tampa, FL.

Haddad, K.D. and B.A. Harris. 1985. Assessment and trends of Florida's marine
fisheries  habitat: an integration of aerial photography and thematic mapper
imagery. Pp. 130-138 in Anonymous (ed.), Proceedings of Machine
Processing of Remotely Sensed Data with Special Emphasis on Quantifying
Global Process: Models, Sensor Systems, and Analytical Methods. Lab.
Appl. Remote Sensing, Purdue Univ., West Lafayette, IN.

Kruer, C.R. 1994. Mapping assessment of vessel damage to shallow seagrasses in the
Florida Keys. Final Rep. to Florida Dept. Nat. Res. and Univ. So. Florida
Inst. Oceanog. F.I.O. Contract #47-10-123-L3.

Lewis, R.R., III, M.J. Durako, and R.C. Phillips. 1985. Seagrass meadows of Tampa
Bay - a review. Pp. 210-246 in Treat, S.-A. F., J.L. Simon, R.R. Lewis, III,
and R.L. Whitman, Jr. (eds.), Proceedings Tampa Bay Area Scientific
Information Symposium. Florida Sea Grant College Rep. 65. Gainesville, FL.

Livingston, R.J. 1987. Historic trends of human impacts on seagrass meadows in
Florida. Pp. 139-151 in Durako, M.J., R.C. Phillips, and R.R. Lewis, III (eds.).
Proceedings of the Symposium on Subtropical-Tropical Seagrasses of the
Southeastern United States. Fl. Mar. Res. Pub. 42. St. Petersburg, FL. 209 p.

Terry, R.D. and G.V. Chilingar. 1955. Comparison charts for visual estimation of
percent composition. Allen Hancock Foundation. Los Angeles, CA.
Reprinted from J. Sed. Petrology 23:226-234.