John H. Kramer, and Gail Holmes
Soil gas surveys are commonly used for site characterization, source identification and
delineation of impacted soils, or in litigation to verify claims. Soil gas surveys, like other
search activities, should logically involve reconnaissance and detail sampling phases.
The reconnaissance phase represents a general sweep of locations designed to collect
data at background conditions as well as to locate contaminant plumes. The detail phase
includes follow-up sampling to home in on detected plumes and further delineate lateral
and vertical extent of impacted soils. However, the ASTM Standard Guide for Soil Gas
Monitoring in the Vadose Zone (D5314) states that, because of the non equilibrium
conditions in soil atmospheres, "The generation of a single data set by reconnaissance
soil gas sampling and subsequent infilling of data to form a single data set is strongly
discouraged." Recent advances in mapping technology allow logical search phases to be
integrated into one flowing operation in which data from ongoing reconnaissance are
used to direct detail sampling, thus mitigating the temporal effects of soil gas-
partitioning disequilibria on data.
Real-time laser survey mapping permits accurately-located sampling results to be
computer-contoured in the field, providing high-quality unbiased sample location and
interpretations of chemical data which are legally defensible. Report-quality maps of
field survey results are immediately available to decision-makers, allowing for efficient
resampling and/or collection of detail data in areas of high chemical gradients or
complex plume geometry. Accurate depiction of data at the time of reconnaissance
optimizes initial deployment of equipment and/or field labs by avoiding the need to
remobilize to the site for additional data.
The survey system allows mapping on any digital map base. This capability fully
integrates the soil gas survey into other characterization work at the site with no further
drafting. At sites where, for example, sewer line and piping systems have been digitized,
pre-existing map layers can direct accurate placement of sampling points along suspect
pathways. The system incorporates a GIS interface, including GIS raster background
map images, allowing soil gas data to be immediately added to GIS database
information. At remote sites, a GPS link provides global coordinates to position the
surveyed map. Production of high quality map graphics reduces reporting time.
Environmental restoration of soils and groundwater contaminated by volatile organic
compounds such as petroleum fuels and solvents is an intractable problem. Chlorinated
compounds, commonly used for dry cleaning and as degreasing solvents, are particularly
difficult to locate in the subsurface because the density, viscocity, volatility,
immiscibility, environmental persistence, and toxicity of these chemicals combine to
make them difficult to locate and remediate. The first step is to define the subsurface
extent of soil contamination; sampling programs are designed and equipment mobilized
to a site. The type of equipment may include drilling rigs for boring sample holes or
truck-mounted hydraulic presses to push probes into the soils. Significant success at
locating volatile organic compounds (VOC) in soils and plumes of groundwater has
been achieved with soil gas surveys for many years (Thompson and Marrin, 1987).
A soil gas survey involves the collection of a suite of soil gas samples at shallow depths
(usually 5-15 feet) across a site. Volatile compounds have high vapor pressures and
consequently partition from the liquid or dissolved phase into the gas phase. They can be
detected at very low concentrations (parts per billion) in gas mixtures. Results of a soil
gas survey serve to locate hotspots, where contaminants are concentrated. These
commonly occur directly above soils or groundwater containing liquid phase
concentrations of the same compounds, however, there are numerous exceptions.
Movement of contaminant plumes in soil gas is a dynamic process dependent on a
number of variables including the geometry and characteristics of the soil units, surface
features (pavement), weather, and characteristics of the soil gas mixture (concentration
gradients, density relative to vapor-saturated air, and others). Due to the transient
processes controlling soil gas movement, sample results do not compare quantitatively
through time. As stated in the ASTM standard guide for soil gas surveys, "It is
unrealistic to attempt to characterize a static soil gas equilibrium because this
equilibrium is never achieved", (ASTM, 1993). The general shape of plumes can be
qualitatively defined by comparing results from different surveys, but it is specifically
not recommended to generate a single data set by reconnaissance soil gas sampling and
subsequent infilling of data.
The samples from soil gas surveys are collected, transported and analyzed in various
ways. (Thomson, 1994, Ullom, 1994). Problems with soil gas analysis related to
containerizing and transporting to laboratories have led to the use of onsite mobile
laboratories. These laboratories are equipped with sensitive gas chromatographs which
analyze samples at the investigation site with a minimum of sample degradation
from transfer. In addition to minimizing sample in transport, mobile labs provide
preliminary results to field crews during the soil gas survey. The preliminary results can
be use to guide the positioning of additional data points during a second pass of
sampling on the same day. Field efforts are optimized in this way, providing intelligent
location of infilling data points during a single survey day while minimizing the
uncertainty from transient changes in soil gas concentration.
Optimization of soil gas surveys requires efficient use of field sampling equipment. The
cost per sample and the data quality are related to project size and the data collection
process. In soil gas surveys of moderate to large size, including greater than 20
samples, the use of onsite mobile labs provides the highest quality data at the lowest cost
per sample. Laboratory mobilizations are expensive, averaging greater than $2500/day,
with no assurance of more than 15 completed analyses. To optimize utilization of these
expensive assets, efficient use is required.
In this paper we will describe new developments in field mapping and data acquisition
using computers which enhance project management and the efficiency of field
mobilizations. An example soil gas survey will be presented in which a base map and
GIS forms were prepared using a computerized mapping and field-data entry system,
PenMapTM. The system provides for immediate feedback to decision-makers in the
field, including real-time mapping of sample positions and contouring of chemical data.
Output from PenMapTM feeds directly into ArcViewTM, ArcInfoTM or other GIS
and database systems for storage, analysis and display. The advantages of an efficient
field-mapping and GIS data entry package will be illustrated by application of
PenMapTM.
All environmental site investigations are map-based. The working base map portrays the
location of buildings and surface features in addition to information which aids in the
design of the soil gas survey. Items of interest include:
paved and unpaved areas,
potential contaminant source areas such as pump islands, washdown facilities, sumps,
drains, septic leach fields, etc.,
potential gas migration pathways such as pipelines and buried utilities,
potential receptors such as water wells and monitor wells,
results of previous soil and groundwater sampling and
ancillary information which may be of use (e.g. soils, geology, vegetation, etc.)
Many larger facilities have existing design drawings which can be imported into
PenMapTM for use, or alternatively, base maps of the site can be prepared by mapping
directly into a PenMapTM file using a wide variety of methods. Base maps can be
imported from CAD applications or from raster background maps. The advantage of
using a screen-displayed map is that field personnel can make annotations pertinent to a
future soil gas survey directly on the map. An example would be surface staining,
which would not normally appear on a base map from design or construction work, but
would be a likely location of a soil gas sample point. PenMapTM allows the mapper to
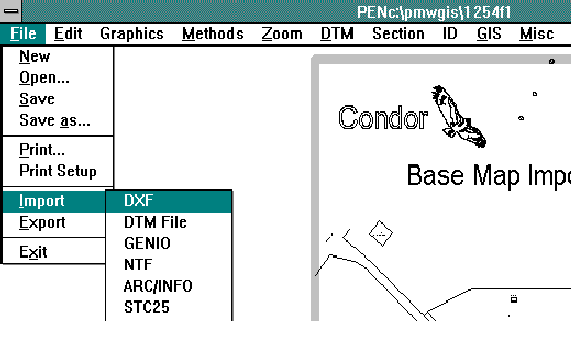
insert symbols for special features observed while on site. Figure 1 is a base map of our
example survey site prepared from survey information and modified in AutoCADTM.
The map has been imported into the field data collection system.

Figure 1. Base map of example soil gas survey site imported from a DXF file.
Figure 2 shows annotations made from the field-data input system on a zoomed-in
portion of the base map. Digital photographs with hand-written annotations may also be
correlated to positions on the map and stored in the electronic record, although this
option was not employed in our example.Annotations on Figure 2 show potential source
areas for contaminants detected in groundwater monitoring wells. Potential source areas
are high priority sample points and will be part of the reconnaissance phase, performed
in the first pass of sampling. Areas of high sampling priority are circled with graphic
elements. The first pass will also include randomly distributed background points for
establishment of baseline soil gas concentrations. The mapping system handles layered
format, so that field notes and comments can be "fixed." Fixed layers are not displayed.
This feature allows the operator to flip back and forth between different map layers to
avoid confusing displays, yet allows access to all pertinent map information. Symbols
are positioned either by direct calculation from survey equipment, manual entry, by
association to other surveyed nodes, or by a free node method. Free node allows the
design professional to mark a position with a mouse or field pen.
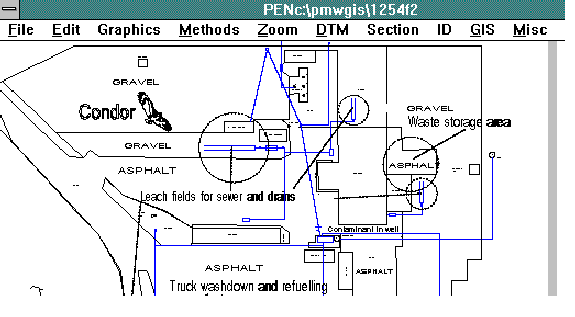
Figure 2. Detail of site map with annotations showing potential contaminant sources.
Positioning the locations for the first pass reconnaissance samples was done using an
automatic node sequencing procedure which places a symbol on the map with a node
reference illustrated in Figure 3. The comments layer has been turned off on Figure 3
for clarity, and the first pass sample locations have been identified with an encircled
cross symbol chosen from the symbols library. The position of the last of fifteen first-
pass samples is being identified. These samples will be collected on the first morning of
field lab mobilization. Results will be plotted and targets for the second sampling pass
will be identified by mid afternoon. In this manner, collecting additional data near areas of indicated contaminants and in areas where high concentration gradients are apparent can be performed during the same mobilization.
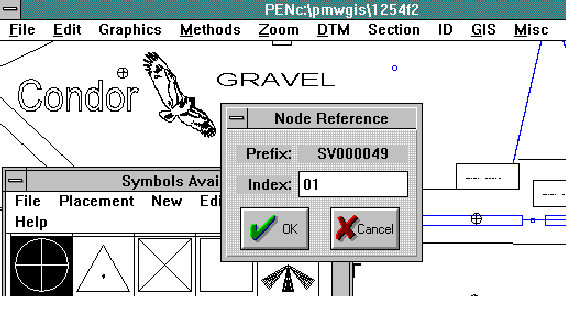
Figure 3. Insertion of symbols at location of planned first-pass sampling.
Data created in a soil gas survey can be recorded, organized, and analyzed electronically
using the GIS field data entry system of PenMapTM. A customized GIS database is
established through a form generator which can be linked to positions on the map
through the symbols graphic. In our example soil gas survey, the parameters of interest
are organized and linked to a graphics symbol of a circle overprinting a cross. An
example of the form generator screen appears on Figure 4. The database formats used
for soil gas are numeric and string fields; numerous other data types can be handled. It
is very important to know the sample collection method and to document this in the
event that other soil gas data may be collected in the future. The form designed for the
"method" field has a branching tree structure so that the operator will be cued to
choose from a list of possible sample collection methods. Since an entry in the data field is compulsory, the sample collection method (active, passive, syringe, summa canister, or other) will be a necessary and permanent part of the record. The advantage of this over paper input forms is twofold. First the possibility for transcription errors is minimized, and second, no incomplete data will enter the GIS system from the front end.
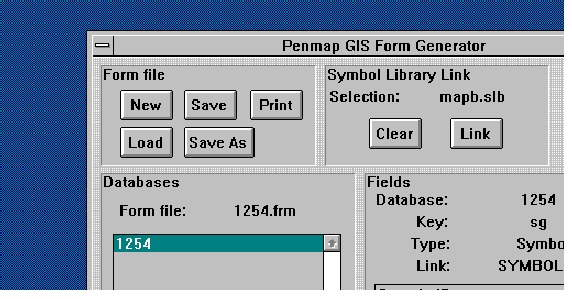
Figure 4. GIS database design customized for contaminants of concern.
Once the GIS database format has been merged into the map file, there is a full linkage
between field mapping and data collection procedures. As a soil gas sample is collected
its position is surveyed, estimated, or "snapped-to" a previously-surveyed position on the
map. The GIS automatically queries the operator for data information. The information
is stored and can be used for data processing and seamless export to GIS packages such
as ArcViewTM. In the case of soil gas survey data, there is a period of lag between the
time the sample is collected and the time the sample is analyzed, (documenting this lag
is an important quality control procedure). Usually there is a production line type
sequence where samples are being collected, stored and run in the mobile lab. The
sample results must then be entered into the GIS data record. The GIS records
associated with each graphic item are easily accessed and updated when the analytical
results become available.
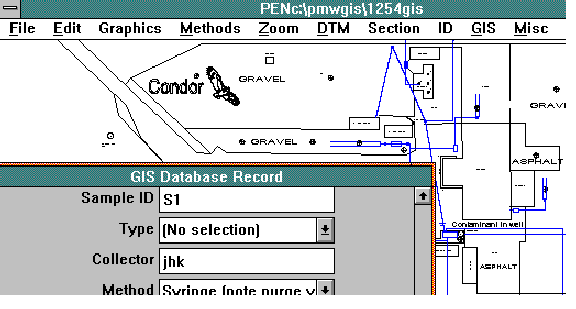
Figure 5. Data entry screen appears when a data point is located on the map.
The GIS data entry and mapping software allows for selective display of the data in
tables associated with each data point. This is useful for immediate feed back to
decision makers in the field. The example soil gas survey was delayed due to
exceptional rainfall at the target site. For this reason, no real data were collected. For
demonstrative purposes some realistic surrogate data was fabricated to show the utility
of the data collection system.
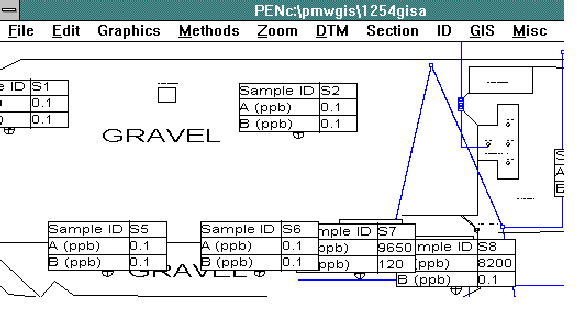
Figure 6. GIS attribute tables displayed on screen map.
In addition to tabulated data, field investigators can generate contour maps of selected data attributes. For the surrogate data at the example soil gas survey site, two hypothetical contaminant compounds, A and B are contoured. Results appear on Figure 7. Contouring in color facilitates determination of different compound isopleths. The data was chosen to illustrate two different source areas specific to each compound. A bullseye for compound A occurs near one of the leach fields, and a bullseye for compound B occurs near the pump islands. The pipeline layer was turned off in this display to avoid confusion, however the data are suggestive of transport through granular backfill in pipe trenches. There is also clearly a need for better resolution around the pump islands where there is a Compound B plume bullseye pattern.. Follow-up sampling guided by this mapping would close on the center of the southerly gas plume, and seek to better define the transport along subsurface piping between the leachfield and buildings to the north.
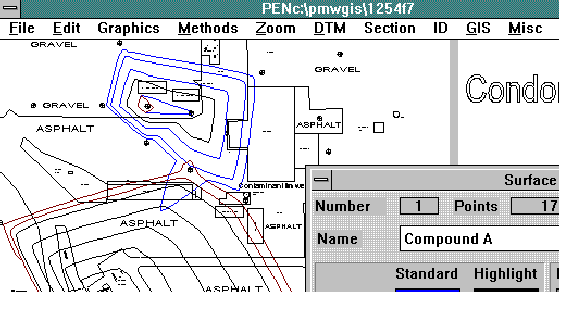
Figure 7. Reconnaissance data contoured as analytical results are available.
Recent advances in survey-interface software and the development of sophisticated front-end GIS field-data entry software, permit new synergy in field data collection (Strata Software & Consultancy LTD, 1994). When applied to environmental soil gas investigations, GIS field-data entry systems enhance efficiency in deployment of expensive mobile laboratories. Rapid, unbiased contouring of voluminous data optimize sampling effort. Accurate, reliable data entry, data storage, data retrieval and data analysis permit field managers to make informed decisions. Mapping can be accomplished on existing maps and results exported to numerous formats, fully integrating field work into the mainstream data analysis efforts at larger sites.
Ullom, William, 1995. Soil Gas Sampling: in Handbook of Vadose Zone
Characterization And Monitoring.,
L.G. Wilson, Cullen, S.J., L.G. Everett editors,
Lewis Publishers, Chelsea, Michigan. pp. 555-567.
ASTM D 5314-93, Standard Guide for Soil Gas Monitoring in the Vadose Zone,
American Society for Testing and Materials, Philadelphia, Pennsylvania.
Thomson, Kirk, A., 1994. Case Studies of Soil Gas Sampling: in Handbook of Vadose
Zone Characterization And Monitoring., L.G. Wilson, Cullen, S.J., L.G. Everett editors,
Lewis Publishers, Chelsea, Michigan. pp. 569-588.
Thompson, G.M., and D.L. Marrin, 1987. Soil Gas Contaminant Investigations: A
Dynamic Approach. Ground Water Monitoring Review, 7: 88-93.
Strata Software & Consultancy Ltd., 1994. Penmap Users Guide. Condor, P.O. Box
3905, Sonora, California.
John H. Kramer, Ph.D., R.G.
Senior Hydrogeologist for Condor Earth Technologies, Inc.
21663 Brian Lane, Sonora, California 95370-3905
Phone (209) 532-0361, FAX (209) 532-0773
email CondorErth@aol.com
Gail Holmes, Geologist
Condor Earth Technologies, Inc.
1125 N. Golden State Blvd., P.O. Box 3448
Turlock, California 95381
Phone (209) 668-9234, FAX (209) 668-9248