Duane F. Marble, Victor J. Mora, and James P. Herries
The last decade has seen a substantial change in the freshman admissions process at most U.S. universities. There is a growing emphasis upon attaining both quantity and quality coupled with the ability to target various specialized groups within the pre-college population such as individuals of Hispanic descent, potential majors in, say, engineering or geography, or those coming from out-of-state secondary schools. This paper reports on the results of an extensive pilot study carried out by the Ohio State University's Department of Geography and the university's Office of Admissions and Financial Aid to explore the application of GIS technology to the freshman admissions process. Approximately 80,000 inquiries and applications from the 1993 and 1994 admissions streams were geocoded and analyzed with respect to both student and school district of origin characteristics. The results of the GIS-based analysis will be applied to operations relating to the 1996 admissions stream.
The decade of the 1990s could very well be defined as a decade of uncertainties that loosened the demographic fabric of the security blanket that protected many of our nation's institutions for years. The 1990s could also be called the decade of change which has forced entire governments, industries, and institutions to "reinvent" themselves and make drastic changes in their operations. For example, many members of the U.S. Congress and the president's administration are downsizing the federal government and shifting many of its functions and resources to the states, local communities, and individuals. Many programs are being eliminated, cut, or restructured. These measures definitely have had and will continue to have impact on individuals and on institutions.
The future of many post-secondary institutions will depend on their ability to understand the environment in which they operate, recognize the changing forces which shape this environment and make the necessary internal adjustments to most effectively cope with the environment. This requires that we adopt a different view of higher education, a view that places many of its supporting activities in the same category as those of any other industry.
Environmental forces that have an impact on the higher education "industry" include the economy (global, national, state, and local), laws and regulations, technology, demographics, consumer demand, consumer behavior, competition from other suppliers, and the demand for the final product (graduates). Since these forces are beyond the institution's control, it is the institution which has to change if it is to succeed and survive. Failure to change can lead to costly and irreversible consequences.
In order to have a better understanding of the changes in the environment that are impacting higher education, a quick look back at higher education in the 1950s, 1960s, 1970s and 1980s proves helpful. Later, a closer look at the 1990s and beyond will put in perspective the dynamics of this decade and the shifts likely to occur as the next century unfolds.
The 1950s and 1960s have been described as "The Age of Surplus and Plenty." These decades were characterized by a seller's market where universities did not have to compete because they had all the students they needed (or could handle). The environment was more stable and thus more predictable, which in turn gave the institutions plenty of time and opportunity to make the necessary adjustments. The primary focus of colleges and universities was not external (environmental); it was, instead, internal (institutional). The institution's focus was primarily inward and the allocation of its resources was aimed at satisfying the needs of its internal publics, primarily the faculty. These were the decades of expansion of academic departments and of building new physical facilities.
Institutions saw no need to be "customer oriented" or to use a "marketing approach" in their operations. College catalogs were the primary means of communication between the institution and its various publics (students, alumni, donors, citizens of the community, etc.) Design of these publications was often assigned to someone in the print shop, who often used photos and graphics as filler for white space in the text.
During these decades, institutions made assumptions regarding the environment which proved in retrospect to be myopic. The near decade-long expansion of the economy during the 1960s was accompanied by only modest increases in higher education costs, allowing institutions plenty of time and opportunity to adjust to these changes. Many institutions assumed that the more affluent component of the U.S. population would grow steadily and cushion future cost adjustments. Another assumption was that higher education was inherently good and, therefore, desirable by all. A competitive substitute for higher education was unthinkable!
In the 1970s and 1980s, breezes of change began to cross the higher education landscape. Competition for students began to be a factor and institutions started to look at the environment as a force to which they had to pay some attention. Some institutions (particularly private institutions and community colleges) started to apply "customer driven" approaches. The idea of marketing an institution was viewed as a revolutionary notion in much of higher education. These institutions sought better understanding of their customers and of themselves by analyzing their competitive position. Other institutions, however, viewed marketing as useful in "selling soap" but not in academe. One could say that these institutions viewed marketing as an approach useful in "selling soap" but not in academe. Selling was an undignified concept for academia. Even the term recruitment was not viewed as applicable in the office of admissions by some institutions.
A prime example of an institution going through a major change in its approach to freshman admissions occurred at The Ohio State University. Until the early 1980s, for example, the admissions office's function was limited to providing information and processing applications. The word "recruitment" was not used by the university administration. Representing a land grant, open admissions university, the OSU Admissions Office staff was allowed to perform "public service" functions, such as visiting high schools and college fairs, but "recruitment" of students was not considered to be a function that a public supported institution would undertake. The term "marketing" was not acceptable. In the mid 1980s, as a result of pressures to increase the high ability and race/ethnic mix of the university, Ohio State made its first major attempts to recruit. As the number of college-going students declined in the 1980s and again in the early 1990s, Ohio State found very soon that in order to meet its quality and diversity goals, the university needed to not only to actively recruit, but also to very quickly undertake more sophisticated marketing techniques.
The breezes of change from the 1970s and 1980s have become winds of stormy proportions in the 1990s. These winds threaten to reshape the configuration of the higher education landscape forever. Today's environment is more complex and is characterized by intertwined forces which exert significant influence on the industry and its institutions.
In the mid 1990s, the demographic makeup of elementary and high schools is very different than in past decades. The "echo boomers" (children of the baby boomers) have brought to the classrooms a wave of increased numbers and greater diversity. This group reversed the downward trend in high school enrollment which reached its lowest point very early in the decade. In 1993, there were 303,000 more high school students than in 1992.
By 1993, fully one third of the elementary and secondary school enrollment in the U.S. represented minorities (persons other than non-Hispanic whites). Not surprisingly, it is expected that by the year 2000, one third of the nation's college age students will be minorities. From 1963 to 1993, enrollment in public schools increased by 7 percent while enrollment in private schools decreased dramatically by 35 percent. This phenomenon is an indicator of socio-economic transformations that have taken place in our society.
More students are graduating from high school and going to college. However, the needs of these students are very different than those from past decades. Today's students (and even more so those in the future) are likely to have greater needs in areas such as financial aid and academic and social support. Since the early 1980s, the rising cost of higher education has out paced increases in family income. Larger shares of family income go into tuition, room, and board. According to the Task Force on Institutional Leadership of the National Association of Student Financial Aid Administrators, "the cost of attendance at a private college, in constant dollars, increased 26 percent from FY 84 to FY 93. Yet per-capita disposable personal income increased by only 11 percent, or less than half the rate of college costs." Minority students generally come from low income families and are likely to need more financial aid assistance than non-minority students. Additionally, many four-year institutions are facing problems with entering freshmen that are not adequately prepared to do college work, thus needing academic support services. Finally, greater race/ethnic diversity brings a variety of socio-cultural perspectives and learning styles which institutions must understand and address.
All the above adjustments would be difficult enough to handle with a stable population base of college going students. However, significant changes occurred in graduation rates from 1973 to 1993 according to the Census Statistical Brief, November, 1994. In this period:
The College Board's Western Interstate Commission on Higher Education (WICHE) provides projections for the period between 1992 and 2009 for four major U.S. regions. WICHE's projections from 1992 to 2009 indicate that all four regions are projected to have significant increases in the size of their graduating classes, though the rate of increase varies across regions. The West will increase faster than any other region (by 65%) and the North Central Region will increase at least by 15%. By the year 2005, the West high school graduating class will replace the North Central region as the second largest in the nation. The number of graduates in the West will overtake the Northeast in 1997 and the North Central Region in 2005. The South/South Central Region will remain the largest of all four regions. The Northeast will continue to have the highest share of non-public high school graduates. The North Central area will have the second highest share of non-public high school graduates until 1997-98, at which time it will be surpassed by the South/South Central Region.
Figures such as those cited above describe the overall potential for college enrollment, but a major external factor affecting enrollment is consumer behavior. Information sources for college choice decisions have shifted from the high school to the home. This shift can be attributed mainly to the fact that college information is readily available outside the high school. The role of the high school counselor is diminished in an age when students receive college information via search mailings, response cards, college fairs, campus visits, college guides, videos, by electronic means (diskettes, Internet, World Wide Web and other means), fashion magazines, movies, the national media, etc.
This rich flow of information exposes today's students to more visual messages than any other generation. As a result of these dynamics, today's students respond differently to messages than past generations. For example, these students are very label conscious and very quickly to judge a college or university based on its recruiting publications. Students rely heavily on first impressions and expect first class treatment.
Students and their parents know that they are in a buyer's market now and use this to their advantage whenever possible. Students tend to apply to more colleges than in the past. There is a lot of shopping for the best financial aid package. Faced with this environment, universities are spending more money on recruitment than in the past. There is also greater use of search/direct mail with special focus on targeting desirable student populations. The competitive environment is more fierce as more institutions target the same group of students.
Successful institutions in the 1990s are paying attention to these forces, are understanding the impact of these forces upon them, and are making the necessary adjustments to weather the storm; that is, to survive. Institutions that are more keenly aware of the competitive environment use qualitative and quantitative research to understand and to reach the markets they serve. These institutions use target marketing to identify and track students and to effectively address issues related to value, quality, image, cost, and the competition.
There is increased marketing sophistication in public colleges and more reliance upon technology to conduct computer-based analysis throughout the recruitment process of students. One such technology is geographic information systems (GIS). The Ohio State University' Office of Admissions and Financial Aid (OAFA) has began to incorporate the use of GIS into its operation through the assistance of the OSU Department of Geography.
The OSU Office of Admissions and Financial Aid must achieve goals set forth by the university's administration. These goals involve three general areas: quantity (number of students to be matriculated), quality (based on academic ability), and diversity (race/ethnicity, geographic, by academic areas, gender, etc). The scope of this paper will be limited to the new freshman population. Before the application of GIS into the OAFA's operations is addressed, an explanation of the dynamics which take place throughout the recruitment process would be helpful.
The marketing process in higher education has been described by various authors as a funnel which is wide at the initial contact stage, where the institution reaches a large pool of prospective students. The funnel becomes narrower as the pool decreases while it progresses through the recruitment cycle. The pool of prospects becomes a smaller pool of applicants, which becomes a smaller pool of enrollees. There are several other stages in between which are of concern in a marketing approach.
In addition to the funnel, the model used by OSU has three other components: the steps in the adoption process, the steps in the decision-making process, and the time frames of the recruitment cycle. These additional components provide important dimensions to represent the complex dynamics at work between those who seek higher education and those who provide it.
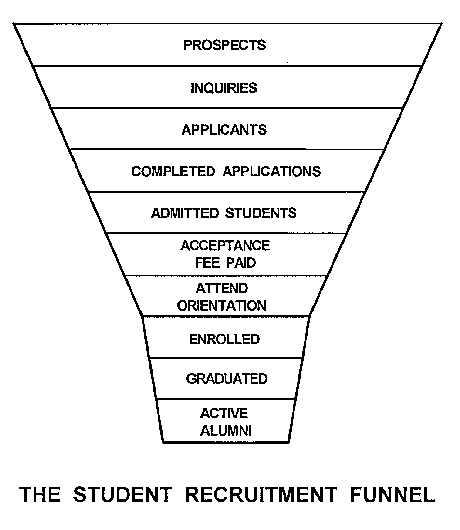
In addition to the funnel, the model used by OSU has three other components: the steps in the adoption process, the steps in the decision-making process, and the time frames of the recruitment cycle. These additional components provide important dimensions to represent the complex dynamics at work between those who seek higher education and those who provide it.
It is important to note that the interactions and the flow of the student pools do not follow a neat, well organized progression through each stage of the funnel. In reality, students may jump around in this dynamic process of actions, reactions, interactions, and decision making. This model attempts to illustrate the seeker-provider interactions that take place as students search for colleges and colleges search for students. Success will be determined by the ability to close a mutually beneficial agreement between the student-consumer and the institution. In the end, the match is one student with one college.
As stated earlier, the number of students usually decreases from stage to stage. The enrolled profile will be a direct result of the profile at the beginning of the funnel. It is critical then to build the right pool at the beginning of the process. A necessary approach to build the right pool is through the use of target marketing. Target marketing calls for a keen understanding of attributes and characteristics of the segments of interest to the institution and approaches the institution uses to connect to these markets. An essential ingredient for this understanding and for these actions is information. Not just any type of information will do, but only that which is accurate, relevant, timely, and clear. This way information becomes a powerful tool that helps decision makers and implementors do the planning, tracking and evaluation. The end result will be achievement of institutional goals.
If higher education in the United States is to be regarded in some sense as an "industry" sharing the concerns for markets, products, etc., that are commonly encountered in the private sector, then it would appear reasonable to assume that many of the marketing and other tools used in that context could be applied to the college admission process. One of today's most popular and effective tools is found in GIS technology. Having become widely popular in the last few years, how has this powerful technology been applied to business concerns?
Marketing's history includes two schools of thought relevant to small area data concerns. What Sheth, et al (1988) term the regional school viewed marketing activities as those economic activities which reduce spatial gaps between buyer and seller. Heavily oriented toward quantitative methods, the marketing regional school of thought borrows from Reilly's Law and the various gravity models to offer systematic means for defining market areas at various scales. The buyer behavior school of thought, on the other hand, emphasized the trappings of marketing tactics involving consumer preferences for display, packaging, media messages, etc. The former is clearly represents a more viable area for the application of GIS technology.
An examination of many marketing applications of GIS-based tools reveals that a very real set of business-geographic issues are being matched with mostly unambitious analytic techniques. Unless specifically addressed through diffusion studies or catchment area analysis, little attention is paid to spatial considerations. Store trade areas are frequently drawn up quickly using Thiessen polygons, with no effort to compare actual purchase data or to incorporate the accessibility differences created by road networks, multipurpose shopping trips, or other common subjects of geographic inquiry. How is it the marketer, ever so sensitive to subtle consumer preferences about label colors and sale responses, ignores some of the basic issues geographic analysis might reveal, such as obnoxious intersections or the effects of road networks upon accessibility? The attitude that simple mapping is the extent of what GIS has to offer marketers is short sighted and unambitious, especially given the amount of micro level data available to many marketing operations. One might argue that this is an early consequence of a technology-driven industry (GIS) interacting with traditional business interests.
The behavioral school marketing research measures, analyzes and predicts individual consumer behaviors in terms of individual responses to stimuli. The regional school of marketing relies on adaptations of geography's contributions to social physics models of the mid-1900s. A review of marketing literature finds little shared ground between the two schools and their approaches at present. Hopefully this will change as more sophisticated applications of GIS technology develop and more detailed analyses, based upon disaggregate spatial data and incorporating modern spatial-analytic approaches, are undertaken.
An alternative approach, geodemographic analysis, attempts to understand how specific market potentials and responses vary by area. A typical example is the direct mail campaign, where a marketer attempts to improve the campaign's yield by whittling away unlikely prospects from the mailing list based solely on their location in an area known to be less likely to respond (or to have shown lower response rates in the past). Common sense applies: a lawn mower shop does not wish to market its services to an area where 95% of the residents live in condominiums. There are issues with regard to how an area is labeled "unresponsive" or anything else, with how the areal boundaries themselves are defined and used in decision making, and with how marketers combine aggregate and disaggregate studies. The impression one gets is that geodemographics has flourished in business use despite its defects in theory (limitations of homogeneity assumptions, discussed below) and application (choice of areal units, discussed below). See, for instance, Castle (1993) and Martin (1991).
The geodemographic technique is straightforward. The wealth of U.S. census social and economic data is distilled by factor analysis into common factors or vectors. These n vectors are then used to cluster the areal units along the n dimensions into a set of x clusters, where x represents a compromise between discriminating power and simple manageability (Curry 1993). The first U.S. geodemographic database was Jonathan Robbin's PRIZM (Potential Rating Index for Zip Markets) based on 1970 small-area census data. His company settled on a 40-cluster model in a two-tiered structure. Competitors have not strayed far from this number or structure in the more than 20 years since although the number of household clusters identified has increased by perhaps half in an attempt to create greater differentiation.
The use of the cluster-based approach is quite simple. Small areal units of assumed homogeneity, such as Census block groups, are clustered upon the basis of their similarity along a number of socio-economic dimensions. Each resulting cluster is "identified" and given a descriptive label. Buying habits for, say, imported mid-size sedans are then identified by group and the locations of those groups with a strong propensity to buy this product are identified. These locations then become the focus of intensive marketing efforts organized around specific products within that category. This is often referred to as "precision" or "pinpoint" marketing.
It would appear that GIS technology can be effectively applied to the improvement of the college admissions process in three major areas. The first two of these are strategic in nature while the third, and technically the most complex, is tactical:
An important question in the use of geodemographic approaches that must be addressed is the spatial scale of the analysis that is undertaken on the prior year admissions streams and the level of spatial detail to be utilized in the recruitment planning process. Most of the area-based socio-economic data that is available in the United States is generated by the decennial census activities of the Federal government, and the various levels of Census geography generally predefine the areal units available for spatial analysis. Basically those tabulation areas, important to this study, for which significant amounts of Census data are available are:
The Census block group is generally considered the largest statistical reporting area where any significant degree of homogeneity among the households may be assumed. These spatial units form the basis for much of the analysis being carried out in this project.
Yet another set of analysis areas that are frequently used (often incorrectly) in geodemographic analysis are the five-digit ZIP (Zone Improvement Codes) codes created by the U.S. Postal Service to improve the delivery of mail. Because of their wide-spread use (since aggregating street addresses by ZIP code does not require the use of geocoding software, etc.), the socio-economic data from the Census have also been tabulated for these areas. Unfortunately, the five-digit (and now both 7- and 9-digit versions are available although Census tabulations are not available for these smaller areas) ZIPS do not have stable boundaries and also possess a substantial amount of internal hetrogenetity with respect to many socio-economic characteristics. (3)
The importance of selecting the appropriate level of aggregation for spatial analysis is clearly demonstrated in the recent comparative study by Chen (1994). Here, significantly different spatial patterns emerged as the level of spatial analysis shifted from the census tract to the block group.
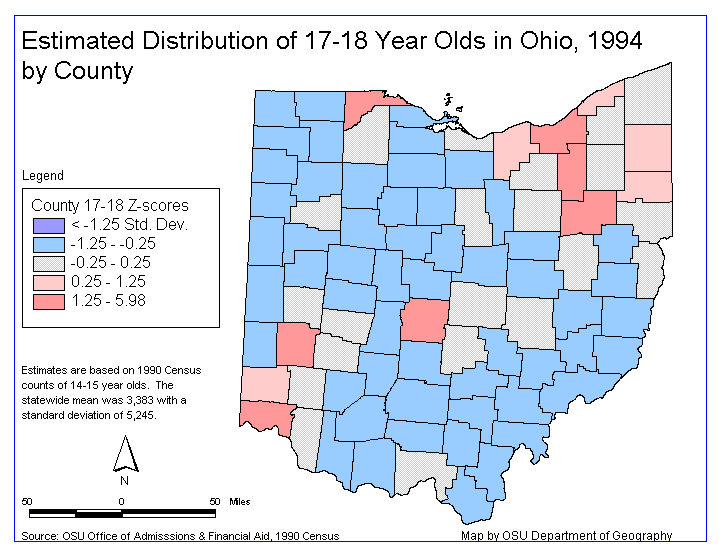
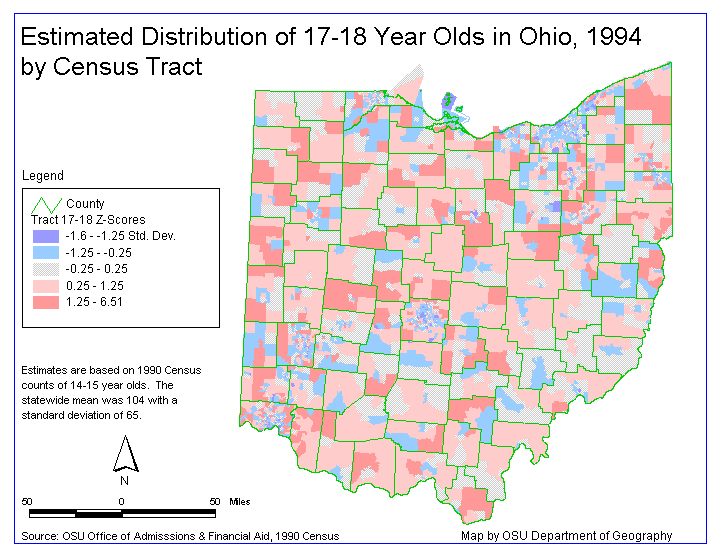
An interesting example of the amount of hetrogenitity that can be hidden by excessive areal
aggregation can be seen in the four figures that follow. These show the estimated college freshman
target populations at the level of the county, school district, and census tract respectively.
Here at the county level there is clearly some spatial differentiation and the largest target populations are concentrated, as one would expect, in the major population centers. Simply utilizing these large areas as targets would still misdirect substantial recruiting resources. The school district is a very relevant unit and a substantial amount of recruiting effort centers on secondary schools. The second map displays the same target population on a school district basis.
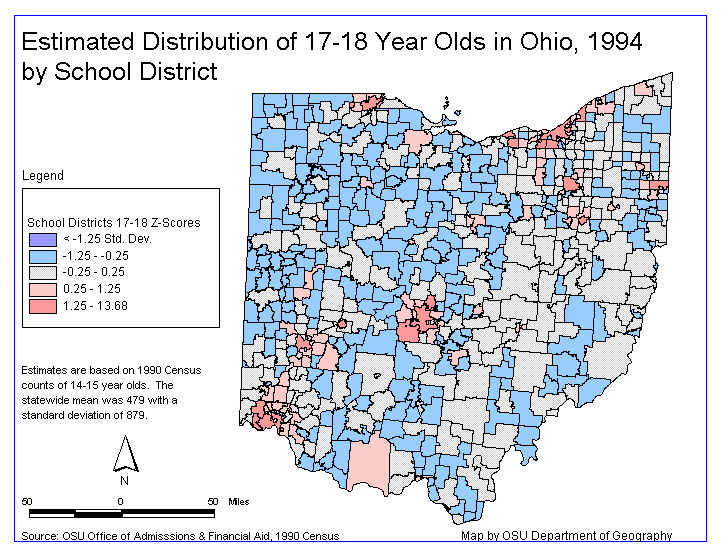
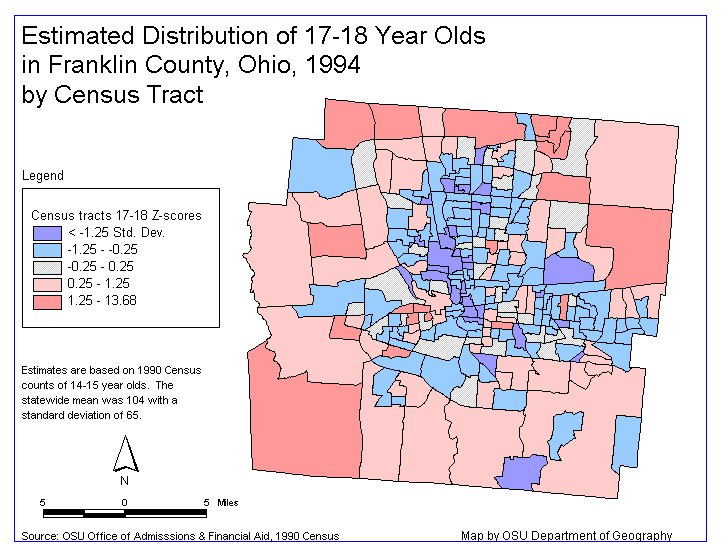
At this alternate level of aggregation it can be seen that the counties are becoming differentiated but many of the districts, particularly those in the major urban areas, are still too large for effective analysis. Turning to the Census tract level, as seen in the next figure, we begin to get some notion of the substantial spatial variation in the target population over the state.
To actually appreciate the full extent of the spatial variation of the target population, we need to go to a larger scale in the major metropolitan areas. The last figure shows Franklin County in central Ohio (where the city of Columbus and The Ohio State University are located) at a more useful scale. Here the suburban concentration of the target population becomes evident; a pattern that is repeated in other cities such as Cleveland and Cincinnati.
Ready accessibility to small-area Census data on a national or sub-national basis is easily achieved today. (4) More difficult is the generation of viable variables based upon local data. In the case of the present study, these local records pertained to the approximately 80,000 individuals who participated at one stage or another (see Figure 1) in the freshman recruitment process during the years of 1993 and 1994.
The applicant records were transferred from the database system maintained by the OSU Office of Admissions and Financial Aid and processed to substitute a unique numeric ID in place of the applicant's name in order to maintain confidentiality. The resulting records were geocoded to add fields to each record pertaining to 1990 county, tract and block group. Coding to school district was not available from the contractor and that was undertaken locally based upon secondary school information contained in the applicant records. (5)
As needed for various portions of the pilot study, the individual applicant records were then aggregated in various ways over the different areal units. E.g., distribution of average ACT score by census tract. Final design of the initial operational databases will occur at the end of the pilot study.
Prior to undertaking the current pilot study, a GIS feasibility study was carried in the Spring of 1994 by students enrolled in Geography 687 (Design and Implementation of Geographic Information Systems). (Marble, et al, 1994) This initial study demonstrated that the provision of several Spatial Information Products (SIPs) could lead to better targeting of freshman recruitment efforts and that sufficient information appeared to be available, when utilized in conjunction with standard socio-economic information from the Census, to create these products.
The follow-on pilot study undertaken during the current academic year is designed to address several goals:
While a number of illuminating visualizations based upon the 1993 and 1994 admissions records have been created, these are not included in this report because of their experimental nature and because of the competitive nature of the information that they contain. The work on the statistical estimations is currently underway and is focused on Census block group areas. Work of this type needs to be done carefully in order to create useful estimators while avoiding the classic ecological fallacy problem of imputing behavioral characteristics to other than the proper entities (in this case, for example, assuming that the area-based statistical relationships that are developed actually apply to household or individual behavior). See the discussions by Duncan, et al (1961), Martin (1991), and many others on both this topic and that of the modifiable areal unit problem.
The results to date from the OSU pilot study clearly indicate that significant returns may be expected from the application of GIS technology to visualization and analysis of the freshman admissions process. Geocoding of applicant files has been successful and it has proven to be straightforward to match these with relevant Census data elements. A major concern, that has not been addressed in the current pilot study, is obtaining updated information on a small area basis for a number of the relevant Census-based variables. We will be investigating the ability of various commercial sources to supply the necessary updated data at a reasonable cost.
(1) The work reported upon here was carried out with the support and encouragement of the Office of Admissions and Financial Aid of The Ohio State University.
(2) Census geography is considerably more complex than this, but these are the spatial units most commonly utilized in geodemographic analysis. Largely rural areas pose special problems as do certain other unusual tabulation areas. The Census block is smaller than the block group, but substantially less data is available for these tabulation areas because of disclosure laws.
(3) As an example of this lack of socio-economic hetrogentity, one large five-digit ZIP code area spanning part of Columbus and the northern part of an adjacent suburb displayed residential property sales values ranging from a low of about $35K to over $650K during a recent three year period.
(4) The study reported upon here has made substantial use of the First Street database distributed on CD-ROM by Wessex, Inc. This consists of all the STF-3 Census data for tabulation areas down to the block group level together with the appropriate boundary files organized for use with Esri's Arc View 2.
(5) This work was undertaken for us by a commercial contractor (Geographic Data Technology, Inc. of Lebanon, NH). Our reasons for utilizing an external contractor for this work involved the contractor's possession of a superior address matching database (as compared to that contained in the public TIGER/Line '92 distribution) as well as both relatively low cost and quick service. The hit rate for the addresses was 82% and the turn-around time was only a few days.
Castle, G. H., (ed.), 1993. Profiting from a Geographic Information System. Fort Collins, CO: GIS World, Inc.
Chen, L., 1994. "Modeling housing and demographic diversity at census tract versus block group levels of aggregation," URISA Journal , Vol. 6, pp. 11-20.
Duncan, O. D., and R. Cuzzort and B. Duncan. Statistical Geography: Problems in Analyzing Areal Data. Glencoe, IL: The Free Press, 1961.
Martin, D., 1991. Geographic Information Systems and Their Socioeconomic Applications. London: Routledge.
Marble, Duane F., et al, 1994. "A Geographic Information System for the OSU Office of Admissions and Financial Aid," unpublished report, Geographic Information Systems Laboratory, OSU Department of Geography.
Sheth, Jagdish N., D. Gardner, and D. Garrett. Marketing Theory: Evolution and Evaluation. New York: Wiley, 1988.