Henrik G. Muller, Morten Rungoe, Danish Hydraulic Institute, Agern Alle 5, DK-2970 Horsholm, Denmark, Telephone + 45 45 76 95 55, Fax + 45 45 76 25 67
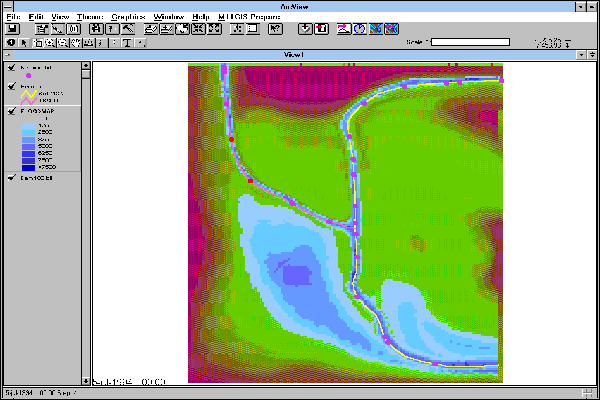
Figur. 1 The MIKE 11 - GIS ArcView Interface - Unscaled image
Flood plain management covers a broad spectrum of activities which aim to help engineers, planners and administrators make constructive decisions for the management of flood-prone areas. MIKE 11 is a numerical flood model that provides information on flood levels and velocities, or more importantly, the impact on flood levels and velocities from proposed works within a flood plain. Flooding may result from such events as river overflow, intense local rain-fall/runoff or coastal inundation from storm surges. Complex models produce large quantities of result data that are difficult for people without specialist backgrounds to understand. Specifically, there is often difficulty in relating the model results directly to the model's location.
Geographic Information Systems (GIS) are tools for managing, analysing and displaying geographic data and data which can be related to geographic objects. The combined power of present day GIS and computers is such that organisations can use a GIS (combined with other data base systems) as the core of all its data operations. To pursue an effective flood management strategy it is therefore highly beneficial to utilise both flood modelling and GIS technologies.
The success of using GIS for flood plain management is reliant upon developing interfaces between GIS and the numerical flood models. This paper describes the MIKE 11-GIS coupling which closes the gap between flood models and GIS.
In the management of flood-prone areas two of the seemingly simple, yet highly time consuming and difficult tasks are delineating the flood-prone land from the flood-free land and the examination of the impact of alternative flood mitigation and flood protection measures on flood levels and therefore flood extent. The MIKE 11-GIS ArcView interface (MIKE 11-GIS) has been primarily designed for generating 2D and 3D water level and flood inundation maps. The system uses a 3D ground surface or digital elevation model (DEM) and water levels calculated by MIKE 11 to calculate water depth. The system design allows rapid generation of inundation boundaries showing different flood scenarios, for example scenarios with or without flood protection measures.
MIKE 11-GIS guarantees a consistent approach to locating inundated land compared to manual methods where the time consuming nature of creating these type of maps increases the potential for errors.
The system automatically manages the large volume of work created and generate surfaces quickly. These factors allow the user to make multiple runs, testing a number of scenarios.
Additionally, the surface generation module is easy to operate and can therefore be operated by anyone in the organisation hereby freeing the river engineer to concentrate on interpreting the results.
Although inundation maps are a very important and necessary first step, the true power of operating in a GIS environment begins with the further integration of flood scenario maps with other spatially related information to preform tasks such as: designation of low-impact and high-impact development areas; estimation of cost/benefit ratios for various flood scenarios; the estimation of warning times for possible emergency evacuations; or the development of an on-line monitoring and real-time optimisation systems. GIS readily allows the analysis of flood inundation with layers of information on infrastructure, land utilisation, population density or any other information stored in the users GIS.
Both the river modelling package MIKE 11 and the MIKE 11 - GIS ArcView interface are fully menu driven applications. A summary of the functionality of the tools is given below.
MIKE 11 - A modelling system for rivers and estuaries
MIKE 11 is a professional engineering software package for the simulation of flows, water quality and sediment transport in estuaries, rivers, irrigation systems, channels and other water bodies.
It is a fully dynamic, user-friendly, one-dimensional modelling tool for the detailed design, management and operation of both simple and complex river and channel systems. MIKE 11 provides a complete and effective design environment for engineering, water resources, water quality management and planning applications.
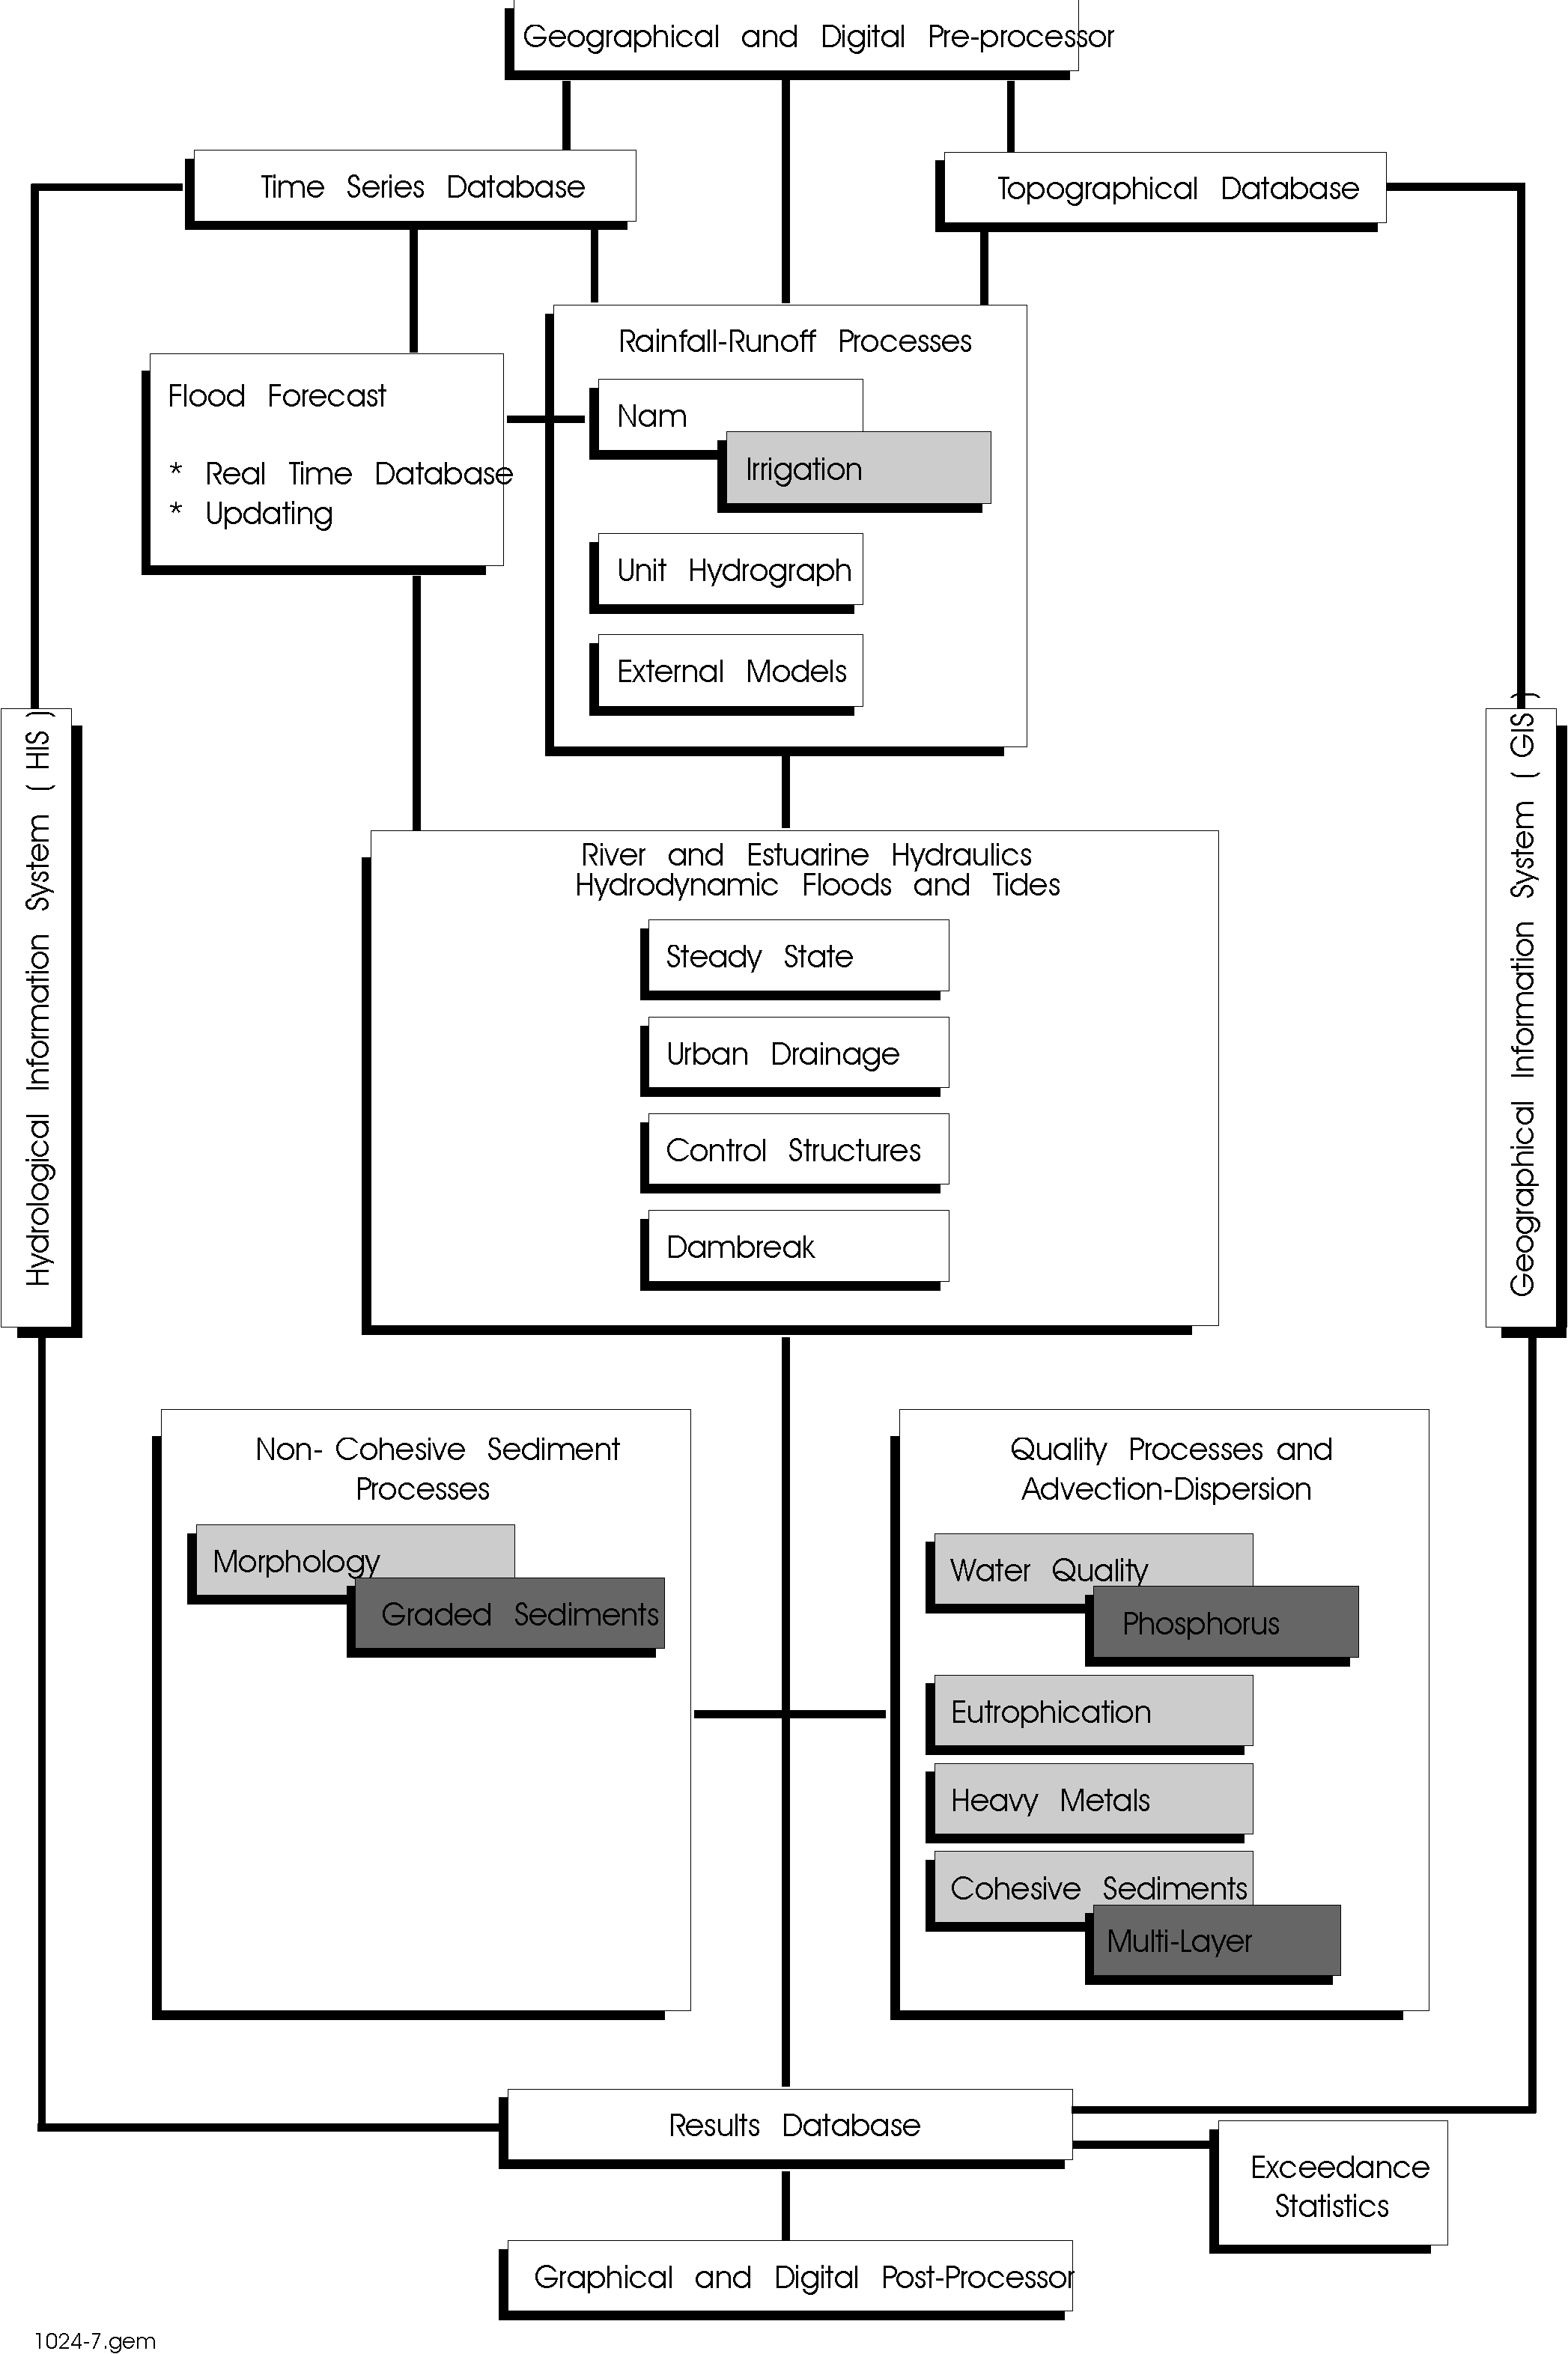
MIKE 11 includes basic modules for:
- Hydrology.
- Hydrodynamics.
- Advection-dispersion and cohesive sediment transport.
- Water quality.
- Non-cohesive sediment transport.
Add-on modules are available for most of these basic modules. The modular structure offers great flexibility:
- Each module can be handled separetely.
- Data transfer between modules is automatic.
- Coupling of physical processes (river morphology, sediment resuspension-water quality) is facilitated.
- Implementation of new developments (modules) is rapid.
The modular structure of MIKE 11 is shown in figure 2.
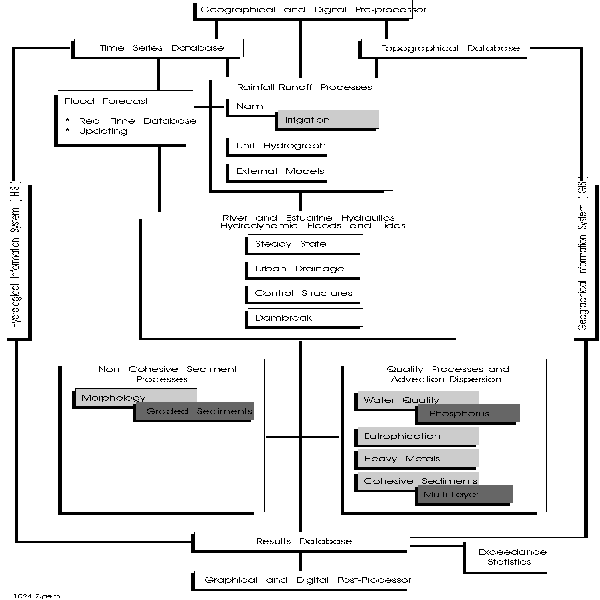
Figur 2. The MIKE 11 structure. - Unscaled image
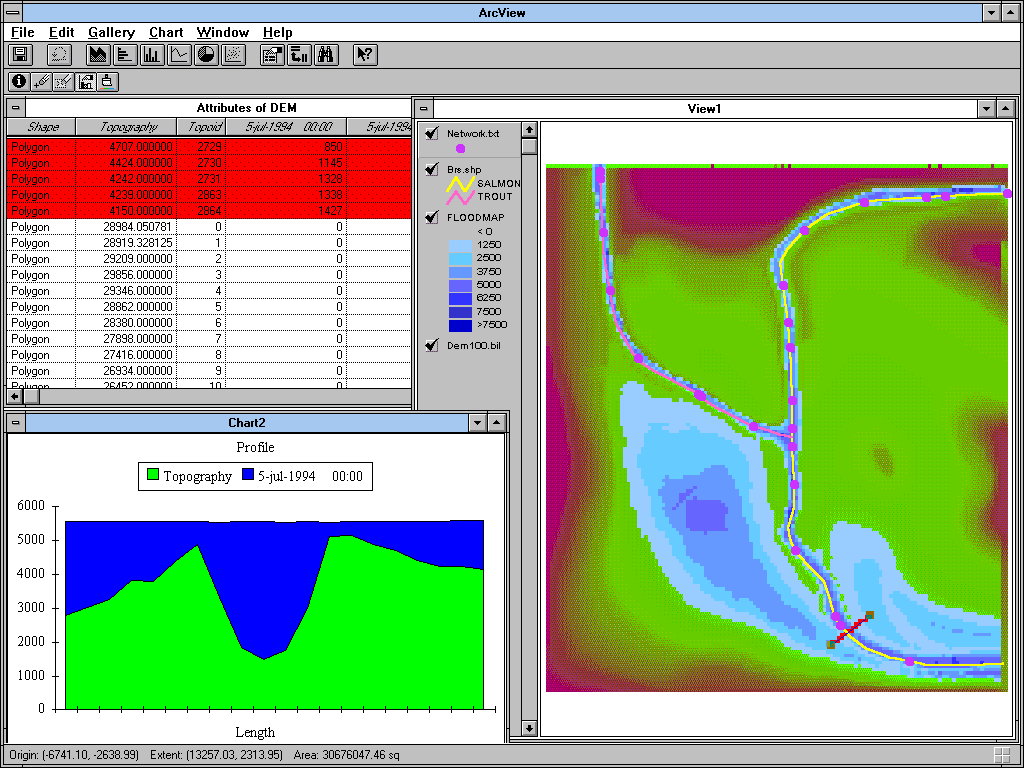
The technique of the flood mapping facility is, simply speaking, a comparison of a digital water surface model with a digital elevation model (DEM). The water surface generation module has now been developed as a GIS independent program which as input takes: a DEM, a MIKE 11 network description and simulation results and gives as output, a water surface.
In addition to the water surface generation program, an application which includes the following facilities has been developed as an ArcView application:
- Import of DEMs.
- Import of MIKE 11 data.
MIKE 11 generates files describing the river and flood plain network. These files can together with simulation result files be imported to ArcView.
- Branch Route System (BRS) digitisation.
The BRS is a network used to geographically locate and display MIKE 11 model features such as branches and h-points. Features in MIKE 11 are located by means of a distance from the upstream end of the branch whereas locations in GIS are defined by geographical coordinates.
Each route in the BRS are made up by one or more lines, identified by a MIKE 11 branch name, which are easily transferred from MIKE 11. The BRS is the most important link for integrating MIKE 11 and GIS data.
- Integrated call of the water surface generation program.
The program which generates the water surfaces is external to ArcView. However, the DEM data, the BRS data and the simulation results are transferred and the program is activated just by means of a "mouse click" inside ArcView. Water surfaces can be generated at single, selected, or all time steps, and the generated flood map file is automatically loaded into ArcView.
- Flood mapping facilities
Once the generated water surfaces are loaded into ArcView they can be plotted as a sequence of flood maps, or differences in inundation between time steps or between simulations can be displayed. The flood maps can be shown together with any other theme in ArcView showing, for instance, infrastructure or landuse.
- Flood mapping animation
When a number of water surfaces have been created the user can create a video animation showing the variation of the flood inundated areas including all user defined information such as land use, infrastructure, etc.
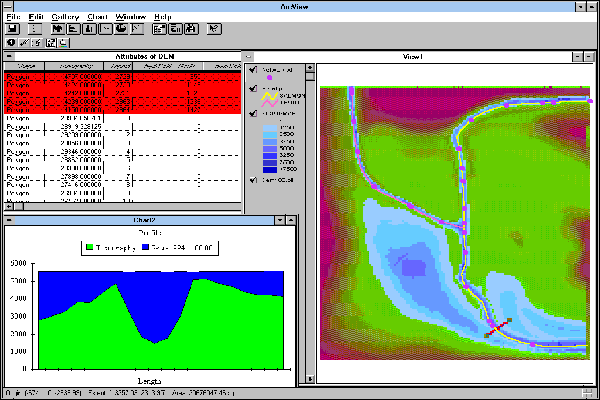
Figur 3. The MIKE 11 - GIS Floodmap and Profile plot. - Unscaled image
A flood management model (FMM) is being developed as a decision support tool in the management of Bangladesh's rivers and flood plains. FMM integrates the MIKE 11 based flood modelling system with advanced graphical displays and analysis using the DEMs and the GIS.
The main use of the FMM will be in prediction and analysis of the behaviour of floods and in the design and operation of flood control structures. FMM has four modules namely; river and flood plain modelling, flood forecasting, structure operation and impact assessment.
The FMM extensively uses DEMs and GIS graphical input and analysis functions to faciliate rapid assimilation and dissemination of information. In addition to the prediction of river and flood plain water levels and inundation areas, a coupling with GIS allows direct determination of damage, flooding of towns and villages and infrastructure disruption. The FMM is being applied to national, regional and project levels with respective resolutions.
Another potential use of FMM is, in the long-term, on-line flood management with real-time flood forecasting features.
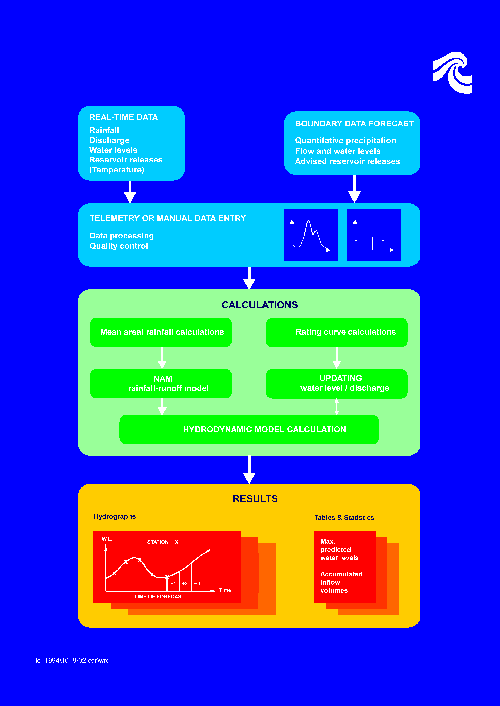
Figur 2. The MIKE 11 Flood Forecasting. - Unscaled image
Harrington A.J.,Data Input Structure Considerations and Recommendations for Triangular Irregular Network Analysis Associated with Modelling Flood Surfaces, Technical Note LN1991/2, Policy and Planning Department, Wellington Regional Council, February, 1991
Havnoe, K., T. van Kalken, K. Wium Olesen, One- and two-dimensional dam break simulation methods. Int. Specialty Seminar on Dambreak Flood Studies, Montreal, Quebec April 8-11, 1991
MacMurray H.L., Barnett A.G., Wallace P.L. (1991) Urban Flood Modelling involving Failure of Protective Works, Study of Streams and Watersheds of High Hydraulic Irregularity, pp A-691 - A700 Proceedings XXIV IAHR Congress, 9-13 September, 1991
Syme W.J., McColm G.a. (1990) Integration of Numerical Flood Modelling into Geographic Information Systems, Conference on Hydraulics in Civil Engineering, 1990, Sydney, Australia
Syme W.J., Barnett A.G., Turton G.B., GIS Flood plain Management. ITMG Conference, New Zealand, Oct. 1992
Verwey A., K. Havnoe, J. C. Refsgaard, Flood modelling in Bangladesh. International Seminar on Hydrology of Extremes (Floods and Low Flows), Roorkee, December 1-3, 1988