INTRODUCTION
Geography courses in elementary and higher degree classes in Greece are, unfortunately, the most boring courses the children have to attend and "learn". This is one of the reasons that surveying Departments have the lowest demand for University degree out of all Technical Departments in Greek Universities. One of the reason for this situation is the geographic atlases used by teachers and pupil is obsolete (My children have to buy the same atlas I had thirty years ago!). Those atlases are cartographicaly and aesthetically very poor.
The three traditional atlas producers in Greece use to copy each other and they just compete in price policy. Due to our participation in a number of projects concerning small scale maps (1:250.000 and 1:500.000) we have gathered complete data bases for the whole country. In a general status of "data lack" this gives us a competitive advantage. Thus we agreed with a publisher specialised in school books to produce a modern Atlas based on digital Cartography suitable for elementary and high school children.
CONCEPTUAL DESIGN OF SCHOOL ATLAS
Generally in map production process in most important cartographic organisations there is a certain symbology. In our case these are no constrains set by the Ministry of Education or any other authority, but since map is a media and can not be "ideologically neutral" we had a very hard time to decide the guidelines and the focal point of our school atlases. After long discussions and successive approximations we decided that school maps and atlases should promote to the users, which are young pupils the following:
The sharp relief of our country.
The dentelated coastlines.
The influence of sea in our economy and culture.
The cross border continuation of geographical phenomena.
To achieve the above targets, there are the factors that played important role and should be balanced:
Density of information on the final document
Colour
The overall cost of the publication.
Density of information
Due to the size of our country, the side of the final document and the size of the administrative units a scale of 1:1.000.000 was decided as the main scale and 1:5.000.000 for small thematic maps concerning the whole country. The size of the final atlas was decided to be B4, which is desk top for Children's Table and also portable with their bags.
The above mentioned size and scale are an important factor in the decision of the information than should be viewed in the various layers. Those layers are:
Name places - annotation - populated sites.
Relief
Hydrology
Transportation
ATLAS LAYOUT
In order to achieve the targets set in the conseptual design of the school Atlas important decisions were made on the information each layer would include. Those decisions are analysed for each separate layer.
Name places - annotation - populated sites.
Although half of the population of our country lives in Athens there are over 6.000 small communes. Those can not appear in the scale 1:1.000.000 (even in 1:100.000 is hard to show them) and a selection should be made. The criteria of the selection were:
Administrative importance (which also indicates the existence of school).
The existence of a major archaeological site
The population
Although we did the best we could using all sorts of existing maps for the identification of names we still don't feel so confident for this part of our database. A first publication will be released at the end of April (3.000 copies) which will be sent to teachers in various places in Greece. This will be done as a marketing action and also as a request from them to response in errors. In next year's edition we expect to have 85% confidence in our data base.
Transportation network
Since the emphasis on the school atlas was not the transportation network only the primary and secondary streets were selected. Attention was paid not to have a populated area without a road connecting it to the transportation network.
Hydrology network
Although Greece is not famous of its rivers, the hydrologic network is very important because it enhances the overall image of the relief. Also rivers although small compared to US rivers or rivers of the European countries played a significant role in Greek history and mythology and students should be able to refer to them.
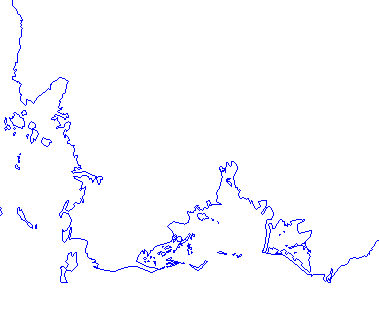
As part of the hydrographic layer is the coastline that is very important to what we wanted to show. Greece according to Hydrographic Service data base consists of 9.000 islands (including small islands of an area of few square meters). Our detailed data base has 3.000 islands and the less detailed 1200. The 1/1.000.000 data base (provided by Hellenic Army Geographic Service) has 150 islands. Although we decided that the final maps would be at scale 1/1.000.000 we decided to use the 1200 islands. This data base expresses much better the dentelated coastline and also shows many small unpopulated islands that are locally important (for fishing, navigation, mythology, religion, etc.).
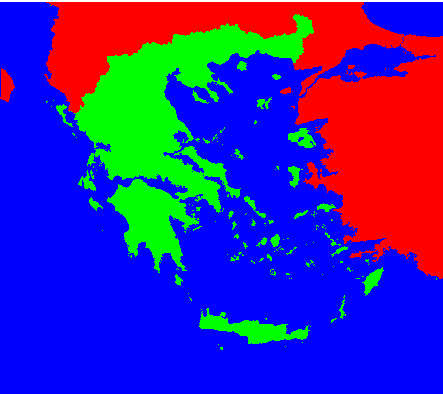
"Greece with its islands"
Relief
As mentioned relief is dominant factor of equal importance to the sea in the Greek culture and history we decided to use the shaded relief in conjunction with different colours at different height levels. This was achieved using the HSV model. In order to best approximate desired colours, we printed an index using HSV model.
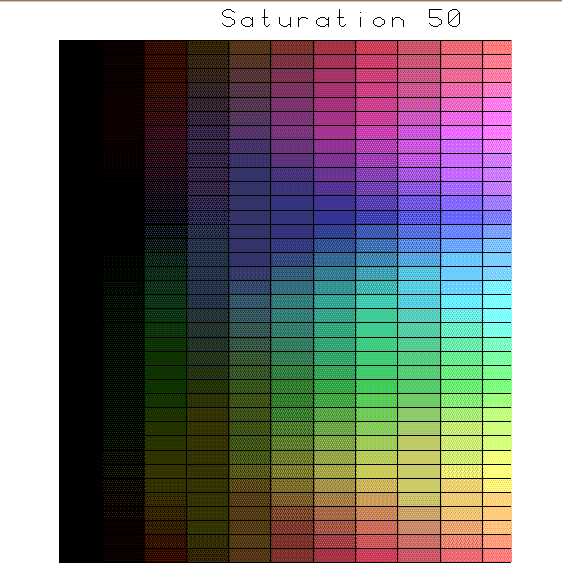
"Hue - Value diagram for Saturation 50"
Hard copy of this index is required especially if only 8 bit acceleration card is used since photosetter machines can produce much more colours than usual monitors. Although we were convinced on the aesthetic result of shaded relief of the bottom of the sea we couldn't persuade the publisher. This shaded relief is very impressive in our area due to the collision of tectonic plates.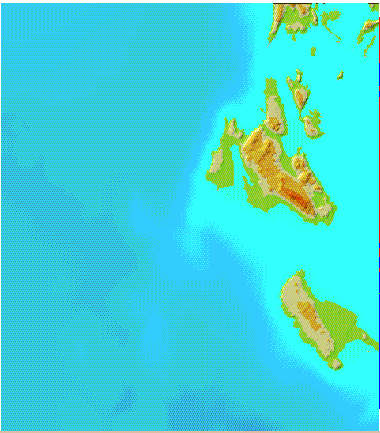
"Map without shaded bottom of the sea"
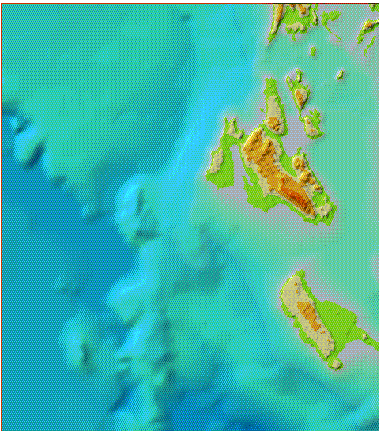
"Map with shaded bottom of the sea"
The colors are optimised for typesetter plotter.
WORK FLOW INTEGRATION OF GIS AND DTP TECHNOLOGIES.
At the early stages of the project we more using ArcInfo 6.1.1 and 6.1.2 that was not supporting accents in the Greece alphabets (imagine letter i without a dot). At the same period our workstation (Sun and DEC) was not supporting 8 bit characters sets. The annotation at those stages was exported out of ArcInfo using DXF files. Those files (7bit) were piped through a program in C code (developed by us) which converts 7bit text to 8bit using the MS windows standards for 8bit of the Greek Alphabet.
Those DXF files were imported to Corel where they were processed. Although this procedure looks straightforward when Corel had to process 4.000 names was extremely slow (changing of a font in a 486/60Mhz with 32 MB memory takes more than 10 minutes if it finishes). Although we have prepared a part of the annotation when we installed ArcInfo 7.0.1 with NLS support and 8bit Xterminals we switched back the database to ArcInfo format and the names were edited using Arcedit. On the border of the maps graphs are placed showing the length of the rivers contained and the height of the mountains. Also some text associated with the map such as brief history, main cultural events, main products, etc. is placed.
The text and the graphs where prepared using Corel Draw. Also in some maps where we had to use complicated symbols that exist in Corel's Clipart we preferred to use Corel as map Composer. The base map (Coastline) was exported from ArcInfo Coverages. The map composition was translated to Postscript files and inserted electronically to Corel Draw. In order the artist who was working in Corel to have an idea how the final layout would be (since PS files are not visible in DTP software) we gave him screen captures of our map compositions that were later replaced by the PostScript files when the final document was ready.
FUTURE PLANS
In next year's edition we will replace the relief with a more detailed one. Also as already mentioned we will gather information on errors and on local names currently used. Using this information we will update the annotation level.