The Montgomery Water Works and Sanitary Sewer Board is in the process of building a total utility management system based around an ArcINFO GIS to more effectively manage their utility in both the day-to-day and the long range operations. The system involves ArcINFO as the GIS as well as a Facility Management system, a Supervisory Control and Data Acquisition system, a Laboratory Information System, a Customer Information System and a Computer Aided Design system.
This paper will describe how this project is planned and designed to make the Water Works more effective in providing service to their customers. The Water Works must rely on a lot of geographic information in order to provide this level of service. As a result, the ArcINFO GIS is planned as the central user interface into this application.
A water and sewer utility, such as the Water and Sewer Board of Montgomery, Alabama, typically maintains several information systems to conduct business, provide quality service on a daily basis and to plan for the needs of an ever growing customer base. Automating these information systems and offering end users access to them through a common user interface, an ArcINFO GIS, will enable the Water and Sewer Board in Montgomery, Alabama to provide the best service available to its customers and to plan with much greater confidence.
The following information systems are either in place or being developed by the Water and Sewer Board in Montgomery, Alabama. Furthermore, most of these information systems are commonly found at any water and sewer utility.
Supervisory Control And Data Acquisition (SCADA) systems are used to monitor and control facilities remotely and to collect data from these remote facilities. Pump stations, lift stations, wells, elevated storage tanks, flow monitors, etc. can be monitored and controlled from a central location. Control of these facilities is necessary to provide uninterrupted service to specific geographic locations in the service area. For instance a dispatched service crew may need to respond to a drop in water pressure in a particular subdivision.
Computer Aided Design & Drafting (CAD) systems are used to produce plan, profile and prospective views of facilities and to maintain information about these facilities once they are complete. Service crews may need access to the record drawings of a major transmission main during an emergency repair. Access to this information may be invaluable to crew supervisors when attempting to restore service to a particular area of town.
Laboratory Information Management Systems (LIMS) are used by our water and wastewater laboratory to track samples and record results of tests required by the Environmental Protection Agency (EPA) and our state regulatory agency, the Alabama Department of Environmental Management. Samples locations around the service area and resulting analysis allows for better geographical management of our systems. The source of odor complaints in a subdivision must be identified by air and wastewater sampling. The incident must be then documented and the problem must be corrected.
Quantity and Quality Models provide an environment to test alternatives and predict results of rehabilitation programs. Water and sewer mains for proposed developments can be tested for adequate capacity and results of inflow and infiltration (I & I) abatement can be predicted and compared to actual benefits. Quality service to our customers can be maintained by anticipating poor water quality at the extremes of our distribution system and planning to prevent these problems.
Emergency Information Systems (EIS) provide necessary data to our staff during emergencies. Location of spares for critical components, after-hours phone numbers of suppliers, phone numbers and addresses of emergency management staff, key contacts at other utilities, phone numbers for police, fire, and medical assistance, etc. can all be stored and readily accessed when needed.
Management Information Systems (MIS) provide support for management decisions. Capital improvement plans, operating budgets, human resource information, and cost accounting are necessary for managers to prepare fiscal plans for their departments.
Facility Management and Work Order Systems (FM/WO) are an operation tool for maintenance departments. Pumps must be inspected, valves exercised, manholes inspected and smoke tested, leaks repaired, etc. to maintain a quality system and to provide quality service to our customers. Costs of these maintenance activities must be tracked to prepare budgets and to help managers decide when to rehabilitate and when to replace components of our systems.
Customer Information Systems (CIS) are the heart and soul of a utility operation: this is the utility's cash register. Customer accounts, billing information, meter locations, account addresses, etc. are maintained in this database.
Given all of the information systems listed above and all of the data stored in the various databases, it's only natural for managers and supervisors to need information from multiple systems at the same moment. This need leads to an attempt by utilities to build direct interfaces between the various information systems. Rather than build twenty eight separate interfaces between each of the eight information systems listed above, why not use a GIS as a common user interface and only build links between the GIS and each individual information system? Why not give our staff access to any and all information stored in these information systems through one common interface? But, since information needs to be available to all of our staff, from the General Manager down to the service crew out working a water main break, the common user interface must be simple to use and easy to learn, or it won't be used at all. Why don't we build a Total Utility Management System that allows users to access and graphically display information through an ArcINFO GIS?
Several departments at the Water and Sewer Board in Montgomery, Alabama have a need to route crews or individuals throughout the service area on a regular basis. Meter Readers and Collectors are dispatched out of the Customer Service Department on a daily basis with routes and work areas developed manually. Meter Readers work until their daily routes are complete and then return to the office to download their hand-held readers. Collectors, on the other hand, return to the department at lunch to pick up new service orders and finally, drop off their completed tickets late in the afternoon.
Water and sewer maintenance crews are dispatched each morning out of the Maintenance Department with little thought to routing and scheduling. It's not uncommon for maintenance crews to pass each other on the freeway headed in opposite directions when responding to work orders. Supervisors meet maintenance crews in the field at designated locations and times to issue new work orders and pick up completed tickets. Construction Inspectors, who work out of the Engineering Department, route themselves around town as they see fit and attempt to cover all water and sewer construction activities inside the service area.
Why don't we access the appropriate information systems (FM/WO, CIS, CAD) through the ArcINFO GIS and route the various crews automatically? All of the crews and individuals mentioned above could be routed by the spatial capabilities in the GIS to reduce travel time and to optimize their time in the field. Hand-held readers could be downloaded and new routes uploaded at night by modem from the Meter Readers' homes. Work orders generated from the defect codes entered by the Meter Readers could be scheduled automatically the following day. Collectors could be routed in the same fashion with the routing occurring after the CIS database has been checked for critical customers and outstanding service orders.
Why don't we build an application to allow the ArcINFO GIS to access the necessary information systems to assign and route work orders to appropriate collectors, print maps for collectors to follow, provide a sequential list of jobs to be worked, and load work orders onto palmtop PC's connected to a Local Area Network (LAN)? Maintenance crews could be routed in the same manner. They could pick up their maps, lists, and palmtops at the office early each morning and follow the sequence laid out by the GIS. Construction Inspectors could be assigned geographic areas of responsibility, with work loads appropriately balanced to minimize travel time each day.
All of the procedures mentioned above should provide for more efficient and higher quality work. Meter readers, collectors, and maintenance crews should spend less time traveling from site to site and they will no longer be required to return to the office or meet supervisors at designated times to simply exchange information. Maps, drawings, information, etc. can be sent directly to maintenance crews via cellular modem during emergencies. Response time to emergency situations should be reduced considerably. Reduced travel time each day will allow Construction Inspectors to have more time to spend with contractors at each job site.
Unaccounted-for water loss can be a serious problem for some water utilities and numbers in Montgomery surpass 20% some months. With over $30 million in water revenue each year, a 3% reduction in unaccounted-for water may produce $1 million in additional revenue or save several hundred thousands of dollars in unnecessary water production, depending upon whether water is stolen or simply leaking from the distribution system. Currently, little emphasis is placed on attempting to reduce this number. This is partly due to the fact that it is difficult to decide where to even start looking. What if we used the ArcINFO GIS as an interface to the SCADA database to determine pumping totals in a particular geographic area for a specific time period? Then compare these water production totals with consumption based upon meter totals in the CIS database. Complete and outstanding work orders could be reviewed for broken pipes, leaks, etc. in the area of concern. Models of the distribution system could be run and calibrated from the ArcINFO GIS. This would allow for the comparison of actual versus anticipated flows and pressures in a service area in an effort to identify likely leaks or stolen water.
Finally, demographic data is available, along with the information listed above, to assist management in prioritizing search areas. Quicker and more accurate predictions of sources of unaccounted-for water loss can be provided by utilizing the information systems listed above. More search time for our maintenance crews can also now be provided to give our crews a better chance of finding the missing water.
Once we begin managing our own I & I program as described above, we expect to save a considerable sum of money on consulting fees and to begin managing the program more efficiently (after all, who knows our system better than our own staff?). Reduced flows in the sanitary sewer system will extend the time before expansions are required at WWTP's, thereby delaying the expenditure of several million dollars. Impact on the environment will also be reduced by limiting SSO's.
Response to emergency situations is handled like most other situations at the Water and Sewer Board in Montgomery: by whoever and whatever means necessary to get the job done! Volumes of data are available to assist our managers, supervisors, and repair crews during emergency response. If we only had a way to get at all this data in a timely manner. Much of the necessary data is still in hard copy format and workers at the office are forced to dig through mountains of files, locate the one piece of information requested by the field crews, and radio the information back to the field, only to find out they have looked up the wrong information.
What if all of the data created and maintained by the Water and Sewer Board were in digital format, stored in a relational database and available to any manager, supervisor, or field crew through a common user interface? Imagine how much more comfortable a supervisor would feel making a decision to valve around a major water main break if he or she had information about pressures and flows in the area and how customers would be affected by closing certain valves (SCADA, CIS, Models, GIS).
If field crews knew immediately where all critical customers were located (CIS), action could be taken during an emergency to maintain service to these residences or businesses while repairs were being made to the damaged facility. If a water main or water source were contaminated, supervisors could predict the spread or dispersion of the contamination (LIMS, Models), display this information graphically (GIS), and work to limit the impact of the contamination.
With the Total Utility Management System being developed in Montgomery, Alabama we will be able to get the information to the people who need the information in a much more timely fashion. Response time should improve significantly and field decisions will be based upon facts rather than supposition.
All of our systems modeling, both distribution and collection systems, is handled by a consulting firm. Yes, they do an outstanding job of maintaining our system models, but our staff has no input or experience with models of the systems that we are maintaining on a daily basis. Why not give the engineers on staff who are charged with designing and maintaining these systems the capability of modeling our systems? Shouldn't we give our own people information about our own systems dynamics? Could we do a better job of planning and maintaining our distribution and collection systems if we knew first hand what was happening to flows and pressures? I think so!
Let's use the ArcINFO GIS as a common user interface into the various quantity and quality models. Let's pull data from the SCADA database, the CIS, the FM/WO system, and any other information system necessary to provide input to these models and have the results displayed graphically, on the GIS, or in report form if needed. Let's give our people the tools they need to make informed, intelligent decisions.
When, and if, custom maps are produced now, they are produced manually or by our consulting firm (so they don't get produced very often). I propose that we use the ArcINFO GIS to produce maps for everyone and anyone who has a need to know more about our systems or operations; anyone who has a need to be better informed. Why not make detailed information about our systems available to engineers, contractors, and plumbers who are designing and installing mains connected to our systems? Shouldn't we get higher quality plans and installations if these people are more informed? Let's produce route maps for meter readers, collectors, repair crews, emergency response crews, etc.
Let's show our crews exactly where to go and what to expect when they get there. Let's produce maps for the Board of Directors so they can see what they are spending our money on: annual capital improvement plans, inflow & infiltration abatement programs, annual well and lift station rehabilitation projects, groundwater resource investigation, well-head protection studies, watershed management programs, water main replacement programs, water and wastewater plant improvements and expansions, extension and expansion of the service area, new elevated storage tanks, new lift stations, water models, sewer models, pipeline evaluation models, water quality models. With an annual budget of $35 million and a bond debt of $80 million, I think a few maps to help the Board members see where their money is going is a wise investment.
The applications listed above - routing, reduction of unaccounted-for water loss, inflow and infiltration abatement, emergency response management, modeling, and map production - are just a few of the major applications planned for the new Total Utility Management System at the Water and Sewer Board in Montgomery, Alabama. Each of these applications, as demonstrated above, should enable our staff to work more efficiently and more intelligently in an effort to provide the highest quality service available to our customers.
The planning phase for the Total Utility Management System consisted of four major task items: the Logical Design, the Functional Design, the Physical Design and the Implementation Design.
The Logical Design is the preliminary project design and is based on information about the current available tools and technologies as they relate to our end goals and existing conditions. In effect, the Logical Design detailed our expectations. All of the data collected on tools and technologies were quantitatively analyzed and resulted in the selection of the tools and technologies that made the most sense on the basis of existing conditions and future plans. In other words, this effort indicated the most logical choices for us.
The Functional Design defines the desired functionality for the Total Utility Management System. The qualitative aspects of the system functionality were documented as opposed to the quantitative structure of the task above. This includes the qualitative expression and definition of the functions that will be expected to be performed by the systems and people involved.
The Physical Design identifies the hardware, software, and services needed to implement the Total Utility Management System. This included aspects such as the physical layout of networks, hardware systems and the associated software systems that will provide the functionality needed and expected. This effort maximized the capability provided by standard equipment for the functions identified in the Functional Design. The Physical Design also specifies planned hardware and software equipment purchases for each phase of the Total Utility Management System project. This, in turn, provides scheduling information needed for the Implementation Design.
The Implementation Design provides the schedule for all phases and elements of the project. Items considered included software, hardware, functions, locations, people, resources, phasing, and the other items needed for project implementation. Timing is the main emphasis of this design document. The design lays out the staging of the entire project on the basis of a time line with line items as detailed tasks, including both calendar duration and labor effort. Most importantly, the Implementation Design provides the project schedule, which helps not only plan the project work, but also track progress.
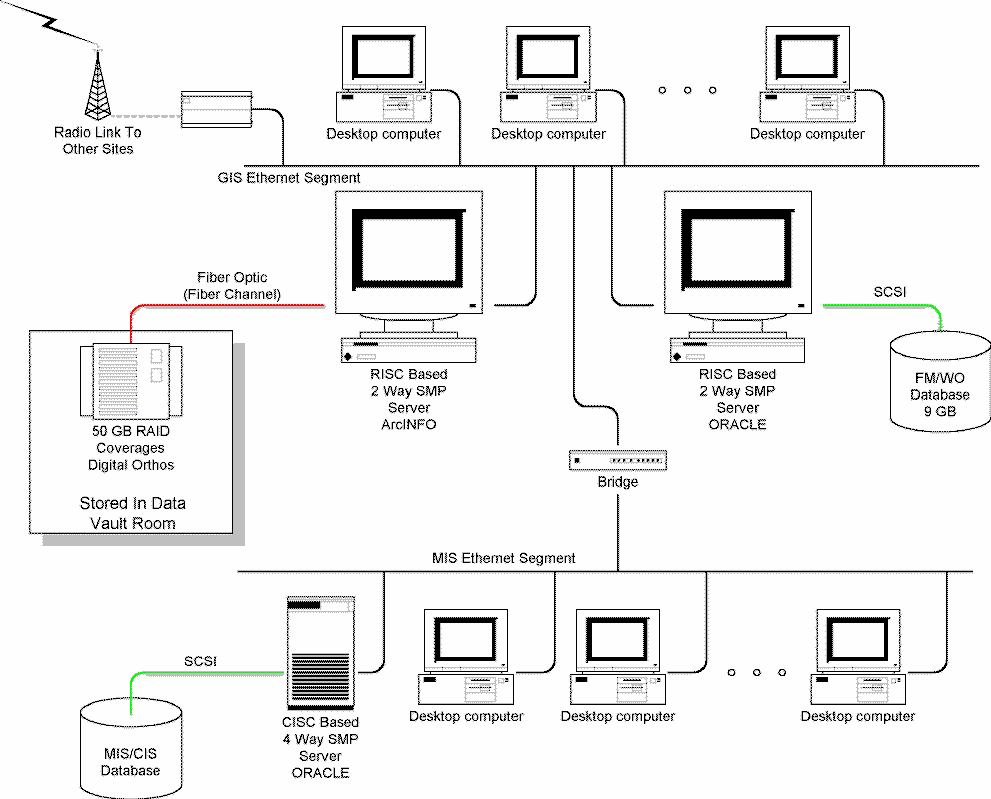
As stated above the Physical Design identifies the hardware, software, and services needed to implement the Total Utility Management System. The system block diagram for the initial subset of the overall system is given in figure 1. The first phase of this system involves ArcINFO running on a multi- processor Reduced Instruction Set Computer (RISC) based workstation that has a disk array configured for RAID level 5 with an on-line storage capacity of 50 Gigabytes. This storage will house the coverages of our distribution and collection system and also house digital ortho-photographs for the entire county. A second multi-processor RISC based workstation runs the ORACLE based FM/WO system and has 9 Gigabytes of storage for the FM/WO data and history. More tables and database instances will be added to this machine as future application links are added.
An existing Customer Information System (CIS) and MIS are running on a multi-processor Conventional Instruction Set Computer (CISC) based mini-computer. The CIS/MIS is an ORACLE application and is kept on a separate Ethernet segment to reduce network traffic. Since both the CIS/MIS and FM/WO databases are Structured Query Language (SQL) based, in fact they are both ORACLE, simple data transferal can occur in a client-server setting. Future system upgrades will adhere to this standard to allow for easy integration into the overall system.
The desktop computers house applications to interact with FM/WO data and also to view the coverages (via ArcView II) and associated attributes in the distribution and collection system as stored in the FM/WO system. This is all accomplished via distributed computing across the network using a client- server architecture. Integration with the hydraulic modeling engine is accomplished through ArcView II getting the necessary data from the FM/WO database and the distribution/collection system coverages to create the model input file. The results are then sent to a table in the ORACLE server for use in ArcINFO and ArcView II as attribute information.
It is clear how future applications will be added with this framework in place and by using the GIS as the view-window into all these systems a consistent user interface is maintained.
There is no doubt that GIS plays a central role in the automation plans of a water/wastewater utility. There has been recent doubt, however, over exactly where GIS fits within such a setting. Most similar agencies have pushed GIS into the role of a mapping tool. Others have simply treated it as just another system in the utility. And some simply got some bad advice from consultants. This is mostly due to the lack of understanding of what GIS is.
We have demonstrated in this paper that the business of a utility is out in the real world where geopgraphy is a day-to-day part of the job. The utility's facilities are geographically distributed and all of the information that a utility deals with is geographically related. At a minimum, the geopgraphic relationship between its facilities has operational significance. As such, a GIS forms the very backbone of the information that a water/wastewater utility deals with.
In the design of this system we have placed GIS in a central role as a workbench on top of which all of the utility's information can be related, analyzed, and assimilated. We were able to do this because:
In the near future the Water Works will realize capabilities to manage its utility the likes of which have never been available before. This overall system will allow the staff to perform their daily duties efficiently and effectively so the utility as a whole will reach an optimal operating state.