Jacquline A. Townsend, P.E., Planning and Analysis Engineer, Charlotte-Mecklenburg Utility Department, Charlotte, NC.
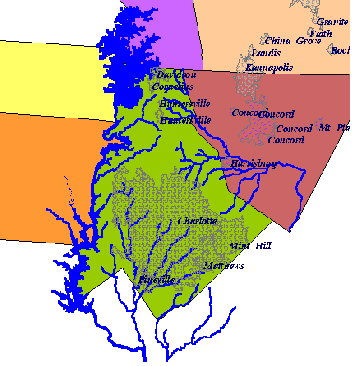
CMUD serves approximately 140,000 customers and the number is growing. Their current Capital Improvement Program (CIP) totals approximately $151 million for water and $257 million for sanitary sewer. Population is expected to increase by 17% by the year 2000. The area is becoming a regional center, both economically and for infrastructure needs. Figure 1 shows Mountain Island Lake on the Catawba River which is the water source on the west side of Mecklenburg County.
Computer modeling in the water industry has come a long way. It serves as a key tool in identifying and planning capital improvements as well as a base for hydraulic analysis and now, water quality analysis. CMUD has been utilizing steady state hydraulic computer modeling for approximately eleven years. The computer model utilized and customized for the CMUD system was the Kentucky Pipe Model. The model was re-calibrated again in 1987. It is housed on the City of Charlotte’s mainframe system and did not offer true graphics capability. It took approximately half of a day for two people to manually plot the model results. The computer model did offer Extended Period Simulation (EPS) but it was never utilized by staff due to the cumbersome amounts of data sheets that it produced.
There are basically two way to model a water distribution system, steady-state and EPS. The steady-state is modeling the hydraulic conditions of a particular time-slice or a single picture of the system. EPS is a series of operating conditions or time- slices that usually represent a 24-hour period. During the EPS the model will test a series of hourly models passing the hydraulic information from the previous time period to the present time period. An EPS can be accomplished in a series of steady-state models, but what would be the point. All the information is in the computer and is digital, what do we need a human messing things up. The EPS passes the information for use from one steady-state model to another automatically. The advantage to EPS modeling is the ability to view the fluctuations of tanks and the switching on and off of the pumps based on the water level in a particular tank. It is important not to run the pumps to long and to permit the tank to fluctuate and turn the water over for improved water quality.
CMUD considers this tool to be critical for projecting a variety of situations in the system and it does not sit idle for this reason. Information from the model has been utilized for simulating construction situations, various changes to operations, improvements to the system and forecasting.
Figure 1 - Vicinity County Map with Catawba River (CMUD’s water source)
The goals of this master plan were expanded to include other issues. Over the past few years CMUD had been utilizing the computer model to analyze the water system hydraulically without consideration for water quality issues. CMUD needed a tool to help identify possible water quality problems in the system. In the past CMUD knew what size water mains were needed to meet system demands in the future, but there was always the question of how water quality was affected. With the upcoming changes in drinking water regulations, CMUD felt there was even a greater need to have the capability to better look at water quality parameters.
The water quality model would be based from the hydraulic model of 12-inch water mains and larger. There was discussion that to develop an accurate water quality model, the model should include the smaller lines in the system. However, CMUD determined due to the size of our system, utilizing the skeletonized model would be a satisfactory first step for establishing trends and pinpointing problem areas. In order to get a realistic picture of the system, field evaluation and calibration was also included in the scope for both the hydraulic and the water quality considerations. Some of the water quality related parameters CMUD was interested in evaluating included temperature, pH, alkalinity, calcium, conductivity, lead, copper, iron, chlorine residuals, turbidity, heterotrophic plate count, and trihalomethanes (THMs). CMUD looked for a water quality model that would evaluate or consider as many of these parameters as possible.
One of the most important goals of the study was for a new hydraulic and water quality model to be developed that was flexible and user friendly. The idea was to make the models and the results more accessible to CMUD staff. The water quality model will mainly be utilized by the water quality staff and the hydraulic model will be maintained and operated mainly by engineering staff. In order to make the models user friendly, CMUD wanted familiar, compatible software. CMUD currently uses IBM compatible software such as dBASE and AutoCAD and GIS tool ArcInfo (Esri) on a UNIX workstation. CMUD also wanted a flexible system to integrate and incorporate other tools such as the maintenance and operation information, SCADA, and existing capital planning programs. The tabular data output needed to be easy to read and understand. "Hands on" training was requested to help the staff become accustomed to the new models and understand their development.
CMUD desperately needed better graphics capabilities for displaying modeling results. As stated earlier, manual plots of the model results were being completed for each run which was not only time consuming but ineffective for providing information to various divisions. The former computer model could only produce a block/grid type schematic, not a "realistic" map representation of the system. CMUD needed graphics capabilities that were easy to understand and depicted the distribution system in a true map representation. The graphics also required accessibility by other divisions. The scope also included the need for the graphics, databases, and models to be compatible with CMUD's GIS environment.
CMUD requested EPS capability. EPS was not utilized by CMUD in the past but it seemed more necessary with the development of a water quality model and the size of the system. EPS provides the user with a dynamic view of system operations and changing patterns or trends. Due to the amount of data results that EPS, a facility management system was necessary to process the data. EPS is not a new concept. It has been around for several years. The problem is the EPS model generates such a large amount of data/printout that it was not feasible to use the information without making a career of it. An EPS for CMUD’s water distribution system of about 1000 pipes generates anywhere from 150,000 to 190,000 lines of output. The files themselves are from 12 to 18 MB. If we where to print the results on a standard printer of compressed print 88 lines per page, it would generate from 1700 to 2160 pages of output. Besides the fact that we would be using paper faster than trees grow, who is going to review all of this information. There are some very key pieces of information that really tell to story. Boyle has modified the hydraulic model to generate all the important information in six tables that can be read directly by the GIS. The tables contain the water levels in the tanks, pipelines flow, pipelines headloss, pipeline velocity, junction demands, and junction pressures.
The last part of the scope was to develop a master plan. It was expected that system projections and analysis could be completed to the year 2015. Specific improvements and new facilities would be identified. A visionary view beyond the year 2015 was also requested.
Following is the description of the development of the computer models, integration into CMUD's existing systems and the result of a usable computer system and master plan for the Charlotte-Mecklenburg Utility Department.
Figure 2 shows the interrelationships between modules of the BFMS. The lines connecting the elements represent two way flow of information from the graphics to the application to the models, back to the application and back again into the geographical information system for graphical representations of model results.
BOYLE FACILITY MANAGEMENT SYSTEM
Figure 2 - Boyle Facility Management System
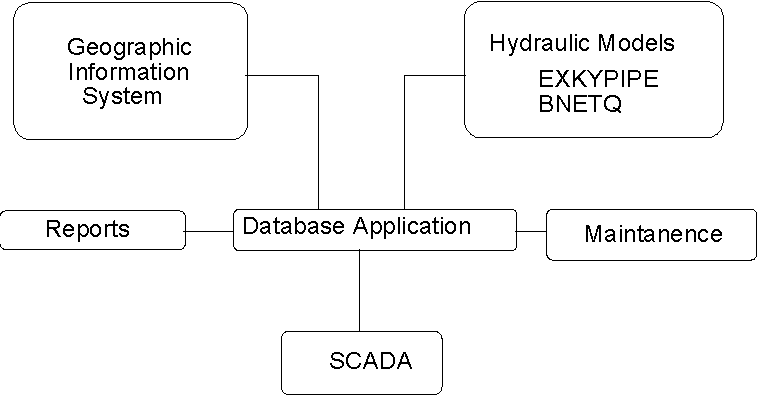
The SCADA and Maintenance modules can be linked into the system but were not included in this project. CMUD is reviewing their SCADA operation and will later require the SCADA connection to the BFMS for modeling by capturing data for direct input it into the hydraulic and water quality models.
Computers can be the best thing since sliced bread. They can, on the other hand, be the worst plague that man has ever imposed on himself. The computer system described in this paper is, of course, the former. The software packages chosen for this system are readily available engineering standards and cost effective. One of the first task of this project was to review the available software for the GIS and modeling to determine the best options. The GIS software search was not much of a task only because the correct choice was so evident. The hydraulic model review for this project was more extensive and a comparison of model features and parameters were reviewed with CMUD. The final choices were AutoCAD by Autodesk, Boyle’s Hydraulic and Water Quality models (EXKYPIPE and BNETQ), and ArcCAD and ArcView by Environmental Systems Research Institute, Inc. (Esri). The two components of the system that are created and maintained by Boyle are the hydraulic models and the application which is the heart of the information exchange capability. The models are maintained by Boyle to permit modification to meet the specific needs of individual projects. Maintenance of the models by Boyle permits timely modifications of the software and prevents delays caused by the software vendor scheduling. The same approach is taken with the application. The code is maintained by Boyle to meet the needs of the client’s specific project. In CMUD’s case, CMUD set the standards for the project and Boyle responded by modifying the application and the models to those standards.
While users are familiar with the term “databases” to represent a single file with fields and records, the GIS environment refers to these files as “tables”. The term “database” refers to a group or series of tables. The application accesses a series of tables, therefore accesses a database. This paper conforms to the GIS terminology for tables and databases.
Figure 3 - WATPLAN Edit Menu for table editing.
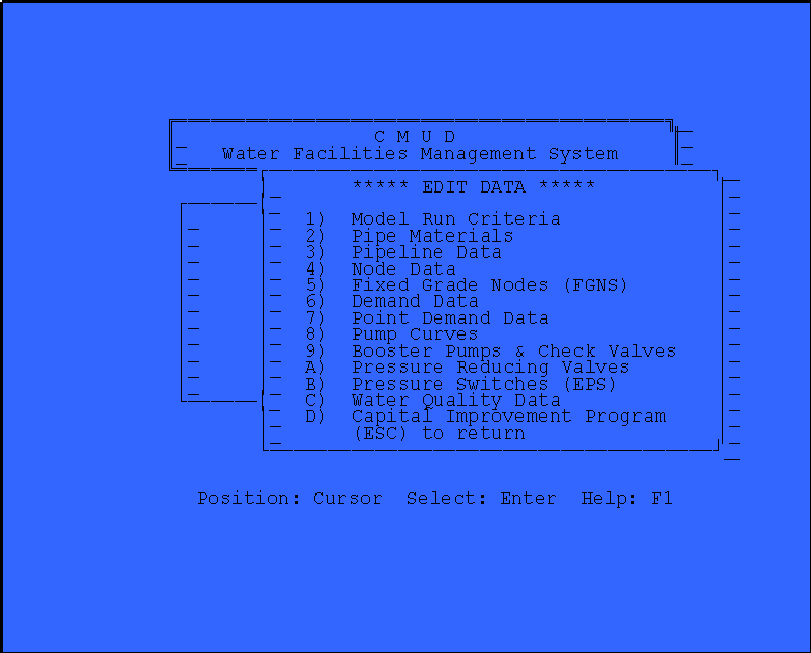
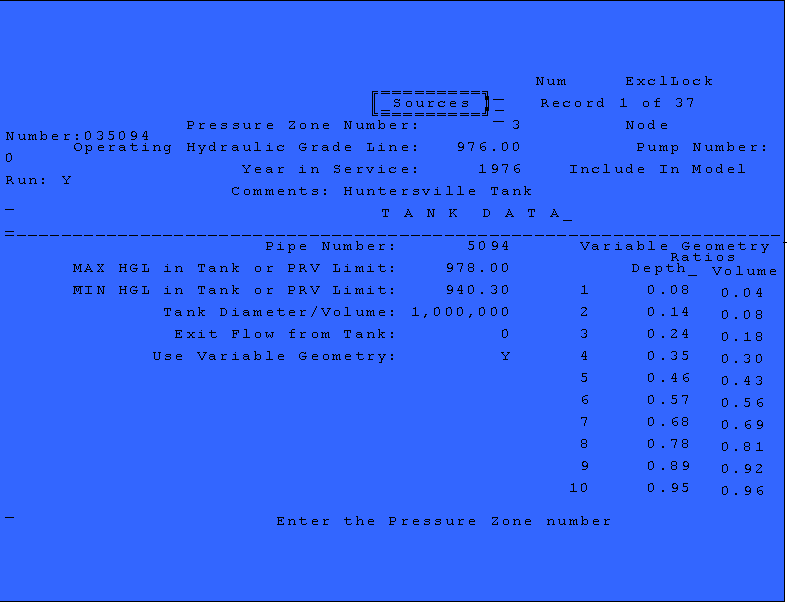
Figure 4 - Sources table editing screen for Fixed Grade Nodes for hydraulic model.
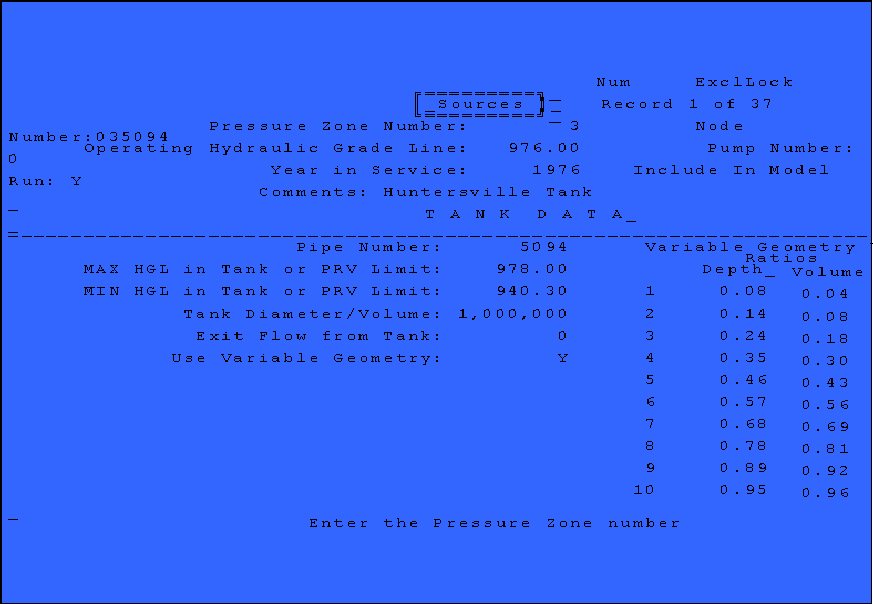
The dBASE application is programmed in dBASE IV and is an editor for tables similar to AutoCAD’s editing capabilities of drawings. The application is referred to as the “WATPLAN” application. Figure 3 shows the editing menu screen for the WATPLAN application. This figure shows the different tables and type of information required to modeling the system. Figure 4 shows the SOURCES table data for fixed grade node for modeling. A fixed grade node can be a tank or booster pump station. Note the “Include in Model Run” item in the table. This permits the user to turn off the fixed grade node and not include this information in the model run without the labor intensive task of removing the data from the table only to re-enter the data for a later model execution.
The tables can be accessed by the normal functionality of any database program which can read a DBF format and do not require, but can be easily viewed in, WATPLAN. WATPLAN is required to build the input files for the models, make reports, use custom screens to aid the user with data input, manage the model criteria, and update the graphics with the modeling results for viewing in ArcView.
The geographic information system in Figure 2 represents the AutoCAD and ArcCAD family of programs. AutoCAD is fast becoming a standard in the engineering community for graphic editing. The distribution system definition begins as AutoCAD entities as simple blocks, polylines, and extended attributes. From there it grows into a more powerful data set by the use of ArcCAD. ArcCAD works inside of AutoCAD and permits a wide degree of flexibility and possible uses of the data. This marriage by Esri provides extremely powerful capabilities inside of AutoCAD. ArcCAD organizes the data into a coverage. A coverage is a set of binary graphic files and linked tables that can be viewed in either ArcCAD or ArcView. ArcView is
- very easy to use and follows the standard Windows format for a user interface;
- used to view the coverages by filter, color, size, or feature type;
- used to permit viewing of the coverages in a wide variety of legends and views;
- a very powerful vehicle to depict the graphic and non-graphic information in an easy format; and
- is fully integrated with Windows and supports all of the Windows functionality.
Most of the figures for this paper were created by the BFMS in ArcView.
A coverage can be exported into a format that can be read in a UNIX environment with ArcInfo. This exchange of information is a very valuable capability. Data for this project was easily exchanged using this link with CMUD’s and the North Carolina Center for Geographic Information’s ArcInfo systems.
The street coverage is a prime example of this exchange of information. CMUD’s base map of streets is housed in their UNIX based ArcInfo system. They exported this information into a PC format to make the information available to Boyle as a base map. During the project, CMUD wanted the Zone and Origin and Destination (O & D) area coverages, for which the reverse exchange was used. This exchange of information and simplicity of crossing platforms made the project data flow seamlessly. There was never any question if information was available; it could be used by anyone on the project team.
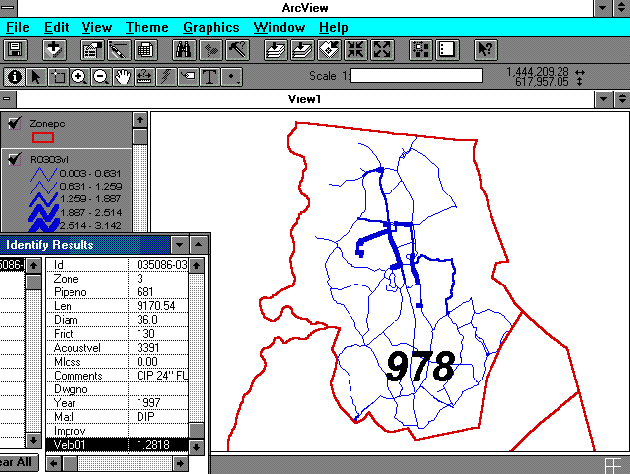
ArcCAD also has the capability to link non-graphic information into a graphic representation. One of the files associated with the coverage is a table. This table houses the topology information associated with the graphic entities in the coverage. Topology defines the feature coordinates and spatial relationships between line and point features. Once the boundary topology is built, non-graphic information can be included in the table. An example of non-graphic information for the zone boundaries is the maximum hydraulic head associated with each zone. In Figure 5, the 978, 960, and 882 indicate hydraulic heads, which are non-graphic information. Another example of non-graphic information shown in a coverage graphic format is the years of installation of the pipes by color. This is a very useful tool for showing modeling results and is especially useful for large complex distribution systems such as this one created for CMUD. Figure 6 shows the modeling results for the 978 zone for velocity by thickness of pipeline. The table shown in Figure 6 is an example of the graphics tie to the table associated with the results coverage. By snapping on a pipeline, the table record is accessed and shown. The ArcCad, non-graphic, and modeling results information are all housed in the table. “VEL01” is the velocity item in the table for a steady-state model run velocity in the pipeline under the modeled operating conditions.
The use of ArcCAD permits the polygon-to-polygon comparison with results ported to an additional coverage with a table detailing intersection of areas. This feature was used for the demand analysis and the population per zone from the spatial distribution of the O & D areas with the zone boundary. ArcCAD and ArcView also permit the view of modeling results.
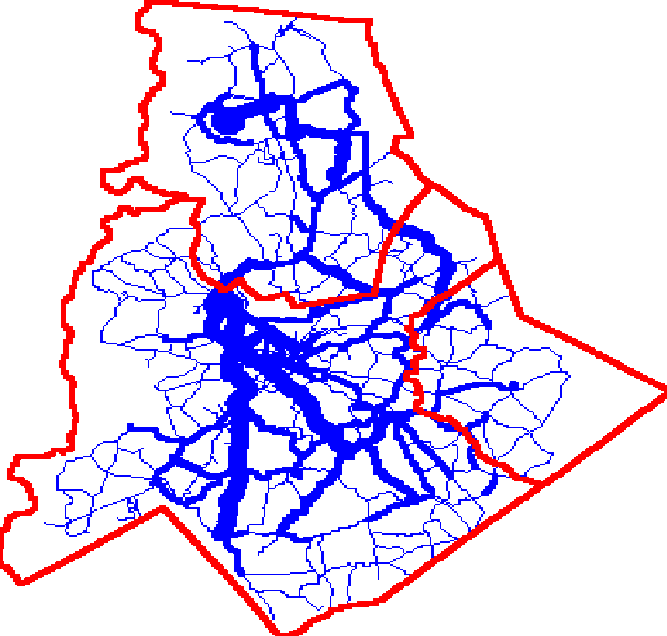
Figure 5 - CMUD Water Distribution System and Facility Map
In the case of CMUD’s water distribution system, the 1992 meter records for all Mecklenburg County were used as the basis for the existing demand on the system. Approximately 160,000 meters were address-matched by CMUD for location using their GIS ArcInfo system. The billing records for the previous twelve months were collected from the Finance Office records, and with the addresses and the GIS street coverage CMUD used ArcInfo to determine the location of each meter. Approximately 15,000 records were rejected based on missing matching of addresses. These locations were determined based on the position in the meter readers' routes. Meter reading route are numbered by zone, book, and sequence number. The rejected meters were ordered in the database using the zone, book, and sequence number in the meter reader route. The location was then specified by the nearest known meter location in the route. The meters without locations were then assigned coordinates of the nearest meter with a known location. From the original 160,000 meters, there were 132,219 meters with usage of interest that didn’t fall into the category of fire meter, components of compound meters, zero usage records not previously cleared from the billing system, or meters read for sewer service billing purposes only.
Figure 6 - Model Results shown by thickness of line based on velocity and access to results table.
The meters were then located within O & D areas. These O & D areas were defined by the City of Charlotte’s Transportation Department for the purpose of planning transportation improvements. Geographic distribution of the population with existing and future projections are detailed in 440 O & D areas for all of Mecklenburg County (see Figure 7).
Figure 7- Origin and Destination Areas by Zone
By using the coordinate locations of the meters and a spatial model of the O & D areas, a table was created with the usage for each O & D area with existing and future population. The meter geographic definition by O & D area was the first step in distributing the demands onto the water distribution network system. With the geographic base of the O & D areas, demand areas for each node in the water distribution network were assigned. One or more of the O & D areas were assigned to each pipeline connection, known as a node in the model. Some of the O & D areas crossed the zone boundaries and therefore the meter usage for those particular areas was divided or prorated between zones and node assignments by area within each zone. Basically, for this we started with the O & D areas and assigned each area to a node or assigned several areas the one node. Using the analysis capabilities of ArcCAD to intersect polygon areas, a table was created to assign O & D areas to each node, therefore assigning demand to each node. Since some of the O & D areas were divided by zone boundaries, a pro-rationing program was written to assign the actual demand to each assigned node in a different zone based on area. This was necessary if one of the O & D areas was divided at a zone boundary, then the population and the meter usage needed to be pro-rated based on the area division between the zones.
ArcCad’s analytical capabilities are very useful in comparing two polygon coverages, such as demand areas and O & D areas. Intersection of O & D areas, with population and demand areas, assigned to model nodes, permitted the meter usage to be spatially distributed. Remember the meters have already been assigned to O & D areas. The O & D area coverage therefore, has an item in the table with total meter usage. As with any powerful tool it is important to keep in mind its limitation. ArcCAD divides areas, such as polygons, but not the non-graphic information associated with those areas, such as population or total meter usage per O & D area. In this case, ArcCAD will provide an intersection of the O & D areas and the demand areas, but will assign all of the population and meter usage for an O & D area to all associated demand areas. The O & D areas that were divided at the zone boundary have the total population and meter usage assigned to each area. This meant that some of the population and meter usage are assigned twice. This doubling was resolved by writing a dBASE program to pro-rate the non-graphic data based on total O & D area.
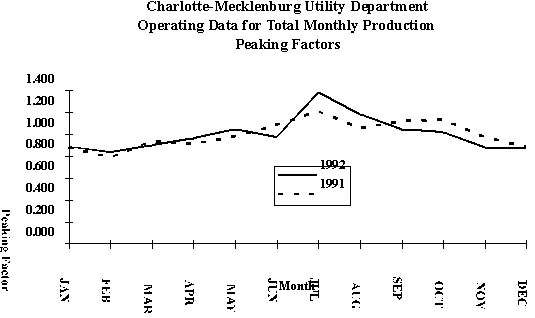
The City of Charlotte’s finance department creates a report (not digitally available), which summarizes the use of water by month by meter use. Meter usage definition includes apartment, residential, commercial, industrial, irrigation, school, and others to report the water usage per month per category. This information is useful in water usage distribution throughout the year. The meter analysis defines the average day demand (ADD) of the distribution system. One of the project requirements was to review the system operation for winter and summer for both hydraulic and water quality problems. This monthly record is used to determine seasonal peaking factors. Figure 8 shows the seasonal variation of ADD.
Figure 8 - Seasonal Peaking Factors determined from High Service Pump Production
CMUD maintains water treatment plant high service pump records of water quantity pumped into the distribution system. These records were transmitted to Boyle in a Lotus 123 spreadsheet and converted to Microsoft EXCEL. As with any system, an independent check is required to verify the computations and assumptions. Boyle reviewed the high service pumping records for the same period of the meter records and compared them on a system-wide basis. This cursory check revealed that the meter readings were approximately eight percent below the average annual production for the three water treatment plants. The difference of eight percent was attributed to water losses in the system and was confirmed by CMUD as realistic in their experience.
Once the existing demands were computed and distributed throughout the water distribution system, the future demand estimates were needed to provide a basis for determining the future infrastructure needs and Capital Improvement Program (CIP). With the historic and existing populations data, future population projections, and the historic average day demand (ADD) from CMUD’s production records, a projected ADD statistical analysis yielded future ADDs. With the population and the ADD records, a linear regression in Microsoft EXCEL was used to define the future estimated ADD based on the population projections. This permitted the future demand to be estimated for the modeling years 1995, 2000, 2005, 2010, and 2015 . Population projections were provided by the City of Charlotte Planning Department and the Mecklenburg County Transportation Department. These population projections were spatially distributed by O & D area.
Figure 9 - ADD and MDD Historic Data and Projections
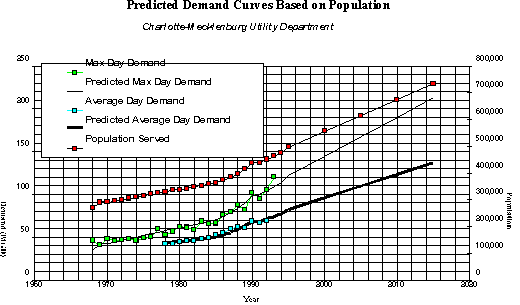
The results of the statistical analysis are shown in Figure 9. With the future population and the ADD known, using the O & D area distribution, Boyle was able to define the differential change in ADD demand for each node based on the differential change in population. The combination of the programming functionality of Microsoft EXCEL and dBASE IV were used to make the mathematical computations
The MDD was recorded by CMUD from 1968 to the present, and was used in a statistical analysis using a linear regression in Microsoft EXCEL to correlate population and MDD. Boyle then projected that algorithm into the future (see Figure 9). This provided the MDD projections for determination of the water treatment plant expansions and their phasing for the system.
A complete system-wide analysis was required to analyze and separate the North Mecklenburg Water Treatment Plant requirements from the other water treatment plant expansions. To conduct this analysis, CMUD and Boyle created an expansion policy that provided a guide for Boyle's recommendations. The policy stated that recommendations would be based on the requirement that all expansions would provide adequate water production to satisfy the year 2010 MDD. The analysis provided CMUD with expansions options by outlining four alternative scenarios. By approaching the water treatment plant expansions in this manner, Boyle was able to recommend expansion for all of the water treatment plants and booster pump stations based on the statistical results of the linear regression and a balancing of required demand within each zone.
After all of the graphic and the non-graphic information for the distribution system was entered into the BFMS, additional information was gathered to model the operation of the system. Pump curves, tank shapes, elevations, capacities, control valves, ground storage re-pump facilities, and operations of the system were entered in to the WATPLAN application. This application housed all of the information used in the hydraulic modeling in separate tables. The hydraulic modeling was conducted with Boyle’s EXKYPIPE. This version of KYPIPE enhances all of the original functionality and maintains the original algorithms of the program. It also adds several needed features which make the program more applicable to CMUD’s system and passes information into Boyle’s BNETQ water quality model. Additional features included the capability of modeling variable shaped tanks, such as elevated tanks, and to output the modeling results to tables for the BFMS. This allows easier integration of the results into the ArcCAD coverages for viewing model results in ArcView. This version of EXKYPIPE has an improved input and output file format making model results easier to prepare and review.
Calibration of the water distribution system is required to create an accurate model of the system. Usually, field pressure measurements at strategic locations and specific tank locations are recorded under a certain operating criterion. In this case, CMUD had a working hydraulic model of the water distribution system that was felt to be accurate. CMUD’s desire to add graphical capabilities and water quality analysis to their toolbox made the previous hydraulic model limiting. CMUD opted to calibrate Boyle’s model to the previous distribution system study model. This worked reasonably well, except that the new model had to be skeletonized to match CMUD’s model, but still provided a good basis for calibration. By peaking our demand distribution onto the previous water distribution model system with updated “C” factors and accurate lengths taken from the AutoCAD map (which was based on the state plain coordinate system), the model was calibrated. Also, measured loss of head for specific pump discharge lines in the system. The head loss was compared to the model results providing an additional check on the model. It is hard, if not impossible, to get the pressure at enough locations and tank elevations and pump operational status at one point in time to calibrate the model with field measurements for a system as large as CMUD’s. The operation of the system changes too rapidly for instantaneous or even semi-instantaneous measurements. CMUD has tank level recorders on all of the elevated tanks in the system, but does not have pressure recorders in the system. Therefore, the previously defined method was utilized to calibrate the model.
The existing water distribution system, with the present operational criteria, was modeled to determine the existing deficiencies. These deficiencies included booster pump station capacity, storage tank capacity, pipeline distribution problems, and/or system pressure problems. Recommendations were made to improve the infrastructure to permit better water service to the public. In this case, the system deficiencies determined during the course of this task were the pump capacity and pump operation for each of the booster pump stations. Storage quantity was analyzed and additional tank locations were recommended for construction along with the North Mecklenburg Water Treatment Plant, which is scheduled to come on line in 1996. Additional pipelines were recommended to deliver water from the new plant into the distribution system along with location and quantity of additional zone tank storage.
The proposed CIP was based on the operation of the system, population demand projections and distribution, and water quality modeling. Current and evolving water quality standards have a definite effect on utilities planning for the expansion of their systems. Several years ago, if an additional pipeline was required and the determined size was, say, 16-inch, the agency would try to install the largest size pipe they could afford in order to stretch their dollar. Today, this is not the always the best approach. The effects on water quality by large-diameter pipelines with long detention time and low velocity in the short term can degrade the water quality to outside acceptable limits. Today, the effects of hydraulics on water quality must be taken into account. This project reviewed the existing CMUD CIP and checked it against the required demands as distributed spatially and over time. The water quality was then modeled on the revised system and reviewed. Adjustments in the CIP were made to comply with water quality requirements.
As part of the BFMS applications, future “C” factors for hydraulic models are aged based on the date of installation and the pipe material type. PVC and Asbestos Cement pipe are not aged. Steel, ductile iron, and cast iron pipelines are aged. The system does not require a “C” factor for future or existing pipe. The system will use an assumption and age the assumption over time, again based on the year of installation and the pipe material type which the user defines.
The family of modeling programs works in conjunction to fully simulate the operation of the system. The hydraulic model must be executed first. Hydraulic operation of the system must take into account the demand on the system (peaking factors), tank elevations, booster pump station, and high service pump operation, ground storage re-pump facility operation, and control valve operation and position. Each of these operational parameters changes as the water distribution system responses to the demands of the system.
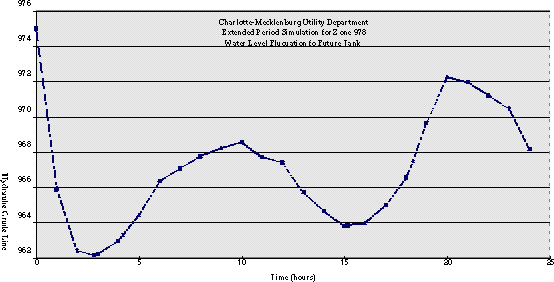
As one of the project goal was to use EPS modeling and was anticipated to be a vital tool in the water quality modeling. The ability to model over a time period and examine the water quality changing based on all of the operational parameters of the distribution system is very valuable. The volume change in tanks over time, age of water, distribution system changes in demands, operation of high service and booster pump stations are all hydraulic parameters tracked during the EPS modeling. As you can imagine, this type of modeling creates a large amount of tabular output. The hydraulic EPS modeling for CMUD’s system results in approximately 150,000 lines of tabular output. This is where a facility management system is helpful to manage and review the results. The results are also stored in a table format for velocity, head loss , pressure, demand, HGL at the fixed grade nodes (such as tanks and pump stations), and flow in pipelines. These tables are joined with the pipes and nodes coverages to permit the modeling results to be viewed graphically in ArcView. Without this ability, the modeler would be required to review the 150,000 lines (or 1700 pages at 88 lines per page). Figure 10 shows one of the most effective methods for reviewing EPS modeling results. A graph of any of the modeling results can be created. This example is for water level fluctuation in the future tank proposed for the 978 zone.
The real trick in creating an accurate water quality model is to have an adequate sampling program spatially distributed to help calibrate the model and aid in determining the decay factors. Decay factors can be based on several factors, and each system needs to be examined to determine its specific decay factors. In the case of temperature, the decay factors are seasonally dependent. In the summer, the water cools in the system because the ground is cooler than the water entering the system from the raw water facility. In the winter, the water is cooler than the ground and the water tends to warm up. The water temperature in the winter is about 50 degrees, but in the summer can be as high as 90 degrees. Each system and constituent is different and needs to be reviewed and examined in this light.
Figure 10 - Example of Extended Period Simulation Model results for 978 Zone for Future Tank
It is important of keep in mind that the system used for this project is a planning-level tool. AutoCAD and ArcCAD can produce a survey -level accurate map, but the cost of generating such a map is significant. For modeling purposes and the purposes of creating a BFMS, a planning-level accurate tool is adequate. A secondary factor affecting the level of accuracy was the street coverage provided by CMUD and used as a basis for location of pipelines and facilities. It was centerline only. A survey-level accurate map would require a double-line map with right-of-way and curb and gutter location. For hydraulic modeling purposes, a planning-level base map, such as the one used in this project, provides an adequate basis.
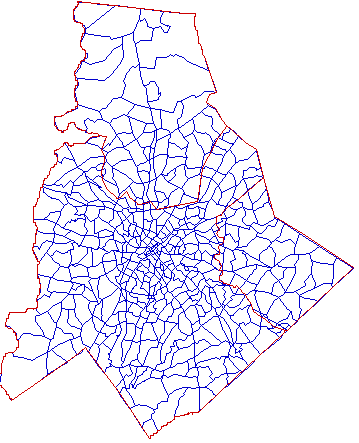
By definition, a GIS permits the graphical representation of non-graphic information. An example would be pipeline diameter coded by color and line thickness. ArcView and ArcCAD permit this type of graphical depiction (see Figure 11).
Figure 11 - Pipeline by Diameter with Zone Boundaries.
Factors in choosing ArcCAD and ArcView for the GIS were ease of use, versatility, familiarity of the working environment, applicability of existing ArcInfo system information, vendor stability, and required equipment and software. ArcCAD, as previously reviewed, only requires AutoCAD. ArcView requires Windows. Both Windows and AutoCAD are usually found in most engineering departments. The ArcCAD-ArcView package is very reasonable in cost, about the same as AutoCAD.
Esri is dedicated to supporting multi-platform software. Information can be shared on a UNIX or Personal Computer platform. This permit a wide degree of expandability and versatility with existing computer system. The programs also work well in a networked environment to share data and take advantage of networking capabilities.
Other potential uses of a facility management system that includes a GIS are:
- Sharing of information over a network with other departments;
- SCADA system integration for system operation and condition capture;
- Maintenance record and schedule programs;
- Valve or facility information housed in a central system;
- Pressure boundary modification and modeling;
- Pipe replacement program for older pipeline facilities; and/or
- System facility aged analysis.
The degree of accuracy desired is a major concern. The tools detailed in this paper and for hydraulic modeling of water distribution systems are planning-level accuracy tools and adequate for master planning and water quality management. There is a quantum leap from a planning-level to a survey-level accurate system. The benefits of such a decision should be carefully weighed.
GIS goes hand in hand with system-wide automation. This applies to management, operation, maintenance, and modeling. Many cities on the east coast are preparing to enter, if they haven’t already done so, the GIS world. This step doesn’t have to be like crossing the Grand Canyon. If the system is chosen with future growth in mind, then starting small will work better than biting off more than you are willing to chew or swallow. The ArcCAD system is very powerful and can be used for large data sets. If, for any reason, the data sets become too large, the system can be ported to ArcInfo on the UNIX based platform. This type of approach can be viewed as a natural progression. Start off small and grow into the future. The only requirement is to choose software that permits growth rather than limits it.
One of the most desirable features is the accessibility of the Esri products. The user has the choice of using a complex system such as ArcInfo, or an easy one like ArcView (in an Windows or UNIX environment). ArcView permits management-level staff access to the data without the requirement of weeks of training and constantly staying up to date with the software. ArcView is very easy to use in a Windows environment. It can be printed or plotted and was used to prepare this paper. The views in Figures 1, 3 ,4, 5, and 8 are ArcView screens captured in Windows. The vicinity map in Figure 1 was also made in ArcView and ported to a Windows Bitmap file.
The key in any successful system is versatility, growth potential, and capability. Keeping these factors in mind in choosing a system and maintaining that system will provide the major ingredients to face the future. Power is a great thing, but the price may be excessive effort required to operate and maintain the system. As systems become more powerful, the systems can be more difficult to use. Start off small and work your way into it.
Don’t be fooled by the title of this paper. The Total Picture is one that is constantly evolving. The needs change, so in conjunction the facility management system must respond. The user sets the requirements and the system must accommodate them. Therefore, any system must be versatile and adaptable to the changing need of the user. CMUD and Boyle have conducted this project with this in mind. The system can be adapted to meet the needs. The system is only limited by the imagination of the individuals that use, maintain, and design it.
“Employment and Household Projections, Mecklenburg County - a Synoptic Report”, Feb. 1985
“Franklin Reports”, 1992, (Planning Dept., City of Charlotte).
“Land Use Data”, 1984-1990, Planning Division, City of Charlotte (digital)
“Record of Inspection and Maintenance - Elevated Water Storage Tanks”, J J & G, February 1993.
“Report on Pitometer Engineering Study Charlotte-Mecklenburg Utility Department, Charlotte, NC”, the Pitometer Associates, 1983 - 1984, Volumes I and II.
“Report on Pitometer Engineering Study Water Distribution System, Charlotte, NC”, the Pitometer Associates 1988 - 1989
“Water Quality Modeling in a Distribution System”, Grayman, Walter M., and Clark, Robert M., AWWA Conference Proceedings.
1990 Census and Dwelling Unit Count, Planning Division, City of Charlotte (digital)
1990 Census Data, North Carolina, US Census Department (NC Center for Geographical Information).
1990, 1995, 2000, 2005, 2010, 2015 Population by region, City Planning Dept., City of Charlotte.
1992 Meter Records with X-Y Coordinates, CMUD.
Developing Models for Predicting Trihalomethane Formation Potential and Kinetics, Gary L. Amy, Paul A. Chadik, and Zaid K. Chowdhury, AWWA Journal, July 1987.
Four Quarters of THM Water Quality Sampling for 1993 (CMUD.
Franklin WTP Yard Piping Schematic
Low Pressure Complaints, 1989 - 1992, CMUD, (digital)
Maximum Day and Average Day Pump Productions for Franklin, Vest, and Davidson Water Treatment Plants (CMUD).
NC County Boundaries (NC Center for Geographical Info)
Pitometer KTPIPE input file, 1988, digital.
Population by Origin and Destination areas, 1990 - 2002, Planning Department, City of Charlotte (digital).
Pump Curves for all High-Service and Booster Pump Stations.
Trihalomethane Analysis, 1989 - 1992, CMUD (digital)
Vest WTP Yard Piping Schematic
Water Treatment Plant State Water Quality Sampling Reports, 1992, (CMUD) (digital)
Westway and 48-inch control valve layout & Manufacturer’s info, (CMUD)
Jacqueline, A. Townsend, P.E.
Planning and Analysis Engineer
Charlotte-Mecklenburg Utility Department
5100 Brookshire Blvd.
Charlotte, NC 28216
(704) 391-5100
(704) 393-2219(FAX)